Evolution of X-ray emission from young massive star clusters
Abstract
The evolution of X-ray emission from young massive star clusters is modeled, taking into account the emission from the stars as well as from the cluster wind. It is shown that the level and character of the soft (0.2-10 keV) X-ray emission change drastically with cluster age and are tightly linked with stellar evolution. Using the modern X-ray observations of massive stars we show that the correlation between bolometric and X-ray luminosity known for single O stars also holds for O+O and O+Wolf-Rayet (WR) binaries. The diffuse emission originates from the cluster wind heated by the kinetic energy of stellar winds and supernova explosions. To model the evolution of the cluster wind, the mass and energy yields from a population synthesis are used as input to a hydrodynamic model. It is shown that in a very young clusters the emission from the cluster wind is low. When the cluster evolves, WR stars are formed. Their strong stellar winds power an increasing X-ray emission of the cluster wind. Subsequent supernova explosions pump the level of diffuse emission even higher. Clusters at this evolutionary stage may have no X-ray bright stellar point sources, but a relatively high level of diffuse emission. A supernova remnant may become a dominant X-ray source, but only for a short time interval of a few thousand years. We retrieve and analyse Chandra and XMM-Newton observations of six massive star clusters located in the Large Magellanic Cloud. Our model reproduces the observed diffuse and point-source emission from these LMC clusters, as well as from the Galactic clusters Arches, Quintuplet and NGC 3603.
keywords:
stars: winds, outflows – stars: Wolf-Rayet – open clusters and associations: general – galaxies: LMC – X-rays: stars.1 Introduction
Massive star clusters, and super star clusters (SSC) in particular, are among the most extreme cases of star formation regions in the local Universe. These clusters have a central stellar density up to and a total mass ranging from to . Clusters of such mass and density can contain hundreds of thousands of OB stars, providing a unique laboratory to test the theory of evolution of massive stars. Moreover, these clusters can have a dramatic effect on their surrounding interstellar, and in some cases, intergalactic medium. Among Galactic examples of SSCs are the Arches and the Quintuplet cluster located in the vicinity of the Galactic center, and NGC 3603. A few dozens of massive star clusters are known in the Magellanic Clouds.
Recent advantages in X-ray imaging and spectroscopy, resulting in the detection of X-ray emission from some of the SSCs, prompted theoretical work to explain this emission. It is understood that regions of active star formation have high supernova (SN) rates. If the supernova energy input is thermalised, a strong wind is driven out of the active region. Chevalier & Clegg (1985) presented a self-similar analytical solution of the hydrodynamic equations for the wind driven from a region of uniform mass and energy distribution. This solution is scalable with the energy and mass input rates, and with the radius of the region of mass and energy production.
Canto, Raga & Rodriguez (2000) considered a ”cluster wind“ resulting from the multiple interactions of stellar winds produced by the massive stars of a dense cluster. Their cluster wind model is essentially the same as presented by Chevalier & Clegg (1985), but accounts for mass loading due to stellar winds instead of supernovae. An analytical solution from of the hydrodynamic equations was obtained. A numerical simulation of a cluster of 30 stars was also presented. The authors applied their result to the Arches cluster and predicted that the X-ray emission from its cluster wind can be detectable. Law & Yusef-Zadeh (2004) have reported the discovery of diffuse X-ray emission from the Arches on a level similar as calculated by Canto et al. (2000), confirming their prediction.
| Cluster | Center (J2000.0) | Detector | Exp. time | Count Rate | |
| name | name | [ksec] | [ct s-1] | ||
| R 136 | 05:38:42.5 | -69:06:03 | ACIS-I | 21 | |
| NGC 2100 | 05:42:08.6 | -69:12:44 | MOS | 6.5 | off-axis, non-det |
| NGC 1818 | 05:04:13.8 | -66:26:02 | ACIS-S | 25 | |
| NGC 1850 | 05:08:41.2 | -68:45:31 | ACIS-S | 30 | on-axis, non-det |
| NGC 1860 | 05:10:38.9 | -68:45:12 | MOS1 | 4.4 | off-axis, |
| NGC 1831 | 05:06:17.4 | -64:55:11 | ACIS-S | 25 | on-axis, non-det |
| The coordinates of the cluster centers are from Mackey & Gilmore (2003) | |||||
The evolution of the X-ray emission from a cluster of single young stars was investigated by Cerviño, Mas-Hesse & Kunth (2002). They proposed an evolutionary synthesis model, where both supernova remnants and hot diffuse gas contribute to the X-ray emission. However, the hydrodynamics of the hot diffuse gas was not considered, and it was assumed that the X-ray luminosity of this gas is just some arbitrary fraction of the kinetic energy rate released in the cluster.
A theoretical model which includes the effect of mass loading based on the work of Chevalier & Clegg (1985) was considered by Stevens & Hartwell (2003). The authors compared the recent X-ray observations of local massive star clusters (Rosette, NGC346, NGC3603, R 136 and the Arches) with the predictions from the cluster wind theory. It was pointed out that from the observational side the problems remain as to being sure that the diffuse emission is genuinely diffuse and associated with the cluster wind. Stevens & Hartwell (2003) showed that the diffuse X-ray luminosity of a cluster wind is correlated with the cluster wind kinetic energy divided by the cluster radius, but the X-ray temperature inferred from the available data is not well correlated with the predicted one. The authors concluded that from the available data it remains very unclear as to what is going on in the clusters regarding the X-ray emission.
The research we are presenting here is stimulated by the X-ray images of the Galactic Center obtained with the XMM-Newton and Chandra observatories. Two rich massive star clusters, the Arches and the Quintuplet, have comparable masses, are located at approximately the same distance, suffer similar interstellar absorption, but their X-ray images, albeit being in the same field of view, are strikingly different. The Arches exhibits bright point sources and diffuse emission, while the Quintuplet is barely detectable. Only careful examination of the Quintuplet by Law & Yusef-Zadeh (2004) revealed the presence of weak X-rays from this cluster. There are hardly any point sources seen in the Quintuplet, and the ratio of diffuse X-ray to the IR flux is much higher in the Quintuplet than in the Arches. The X-rays from the Arches were modeled in a number of papers (see above), but the scarcity of X-rays from the somewhat older and less compact Quintuplet is not explained.
Another sample of star clusters with similar structural parameters, but different age is known in the Large Magellanic Cloud (LMC) (Mackey & Gilmore, 2003). Conveniently, we could use the archival X-ray observations of six massive LMC clusters. Quite similar to the Galactic Center clusters, the youngest and most compact cluster R 136 is bright in X-rays, while older clusters appear as non-detections, at least from the first glance.
In the present paper we attempt to explain these observations as a consequence of cluster evolution. For our study we chose an approach similar to Stevens & Hartwell (2003), but make use of the self-similar properties of the cluster wind solution. The effects of stellar evolution on the mass and energy deposition in a cluster are included via an evolutionary synthesis model. The important novelty is that we consider stellar X-rays as well as diffuse emission. It is often impossible to disentangle the diffuse and stellar emission in the dense cluster core. Therefore we estimate the luminosity of the stellar population and add it to the predicted luminosity of the cluster wind. The total, then, can be compared with observations. The stellar X-ray emission changes significantly when a star evolves, and we account for these changes as well. Our analysis is restricted to the inner parts of the clusters where the bulk of mass and energy is deposited. This allows us to concentrate on the properties of cluster winds and stellar population, and to avoid considering the hot bubbles that are expected around regions with fast winds.
The paper is organised as follows. The observations of massive stellar clusters used in this work are described in Section 2. The approach to the modeling is specified in Section 3. The evolution of X-ray emission of cluster wind is calculated in Section 4. Section 5 is devoted to the evolution of the stellar X-ray luminosity. In this section we pay special attention to the correlations between X-ray and bolometric luminosities. In Section 6 we discuss the X-ray emission of supernova remnants, and conclusions are drawn in Section 7.
2 Observations of young massive clusters
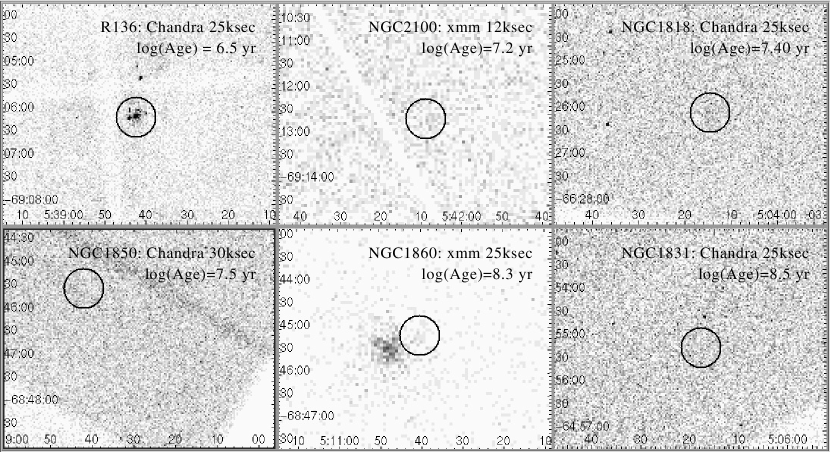
Recently a sample of six massive young star clusters located in the LMC was observed with the XMM-Newton and Chandra X-ray observatories. The observations are in the public archives (see Table 1). To our knowledge the results of these observations, except of R 136, have not been published. Therefore we retrieved the data on five LMC clusters from archives and analysed them. All clusters have similar masses, but differ significantly in age. The structural parameters of the clusters are taken from (Mackey & Gilmore, 2003) and listed in Table 2. Figure 1 shows the X-ray images of the areas of the sky, where the clusters are located. Although being at the same distance and observed through similar absorbing columns, the clusters X-ray images are strikingly different.
The youngest and most compact cluster, R 136, is at least one order of magnitude brighter than the more evolved clusters and displays wealth of bright point sources, but little diffuse emission. Among more evolutionary advanced clusters, three are not detected and the detected ones are apparently lacking point sources.
In order to estimate observed X-ray fluxes from these LMC clusters, a standard analysis of pipeline processed products has been performed. Retrieved count rates were transformed to fluxes assuming that radiation comes from thermal bremsstrahlung with keV. This assumption is based on the spectral fits of the diffuse emission from the Arches and the Quintuplet clusters as discussed in Law & Yusef-Zadeh (2004).The neutral hydrogen column density for all LMC clusters was adopted as cm-2, as derived from spectral fits of R 136 stars by Portegies Zwart, Pooley, & Lewin (2002).
Below we briefly describe how the diffuse X-ray luminosity was estimated for each cluster under consideration.
R 136 was observed by ACIS-I on board of the Chandra X-ray observatory for 21 ksec exposure time. However, even with the superb angular resolution of the ACIS camera (the pixel size is ), it is hardly possible to separate stellar and diffuse emission within the cluster core, which has a radius (corresponding to 0.32 pc). However, as Mackey & Gilmore (2003) pointed out from the analysis of the cluster brightness profile, the inner region of the cluster is extended to 2.43 pc. We estimate the diffuse X-ray luminosity of R 136 from this inner region.
Using the wavedetect tool for the binned by factor of 6 event file we obtained the total count rate in this region and translated it into the background subtracted flux, erg s-1 cm -2. Background correction is important since R 136 is embedded in the extended region of diffuse X-ray emission 30 Dor C. As the next step, we subtracted the luminosities of the point sources CX19 (Portegies Zwart et al., 2002), and attributed the remaining luminosity to the diffuse emission.
NGC 2100 was observed off-axis by XMM-Newton. Although clearly seen on an OM image, this rich young cluster is not detected in the X-rays (see Fig. 1). An upper limit to the count rate from an area corresponding to the cluster core was obtained from a sensitivity map, and is ct s-1 for the pn camera. Thus the upper limit on the flux from NGC 2100 in the XMM-Newton passband is erg s-1 cm -2.
| Cluster | Center (J2000.0) | log Age | Metallicity | |||||
| name | [arcsec] | [pc] | [yr] | [Fe/H] | [erg s-1] | |||
| R 136 | 05:38:42.5 | -69:06:03 | 10 | 2.43 | 6.5 | 34.3 | ||
| NGC 2100 | 05:42:08.6 | -69:12:44 | 5.02 | 1.22 | 7.2 | -0.32 | 4.31 | |
| NGC 1818 | 05:04:13.8 | -66:26:02 | 10.10 | 2.45 | 7.4 | 0.0 to -0.4 | 34.32 | |
| NGC 1850 | 05:08:41.2 | -68:45:31 | 10.48 | 2.55 | 7.5 | -0.12 | 4.87 | |
| NGC 1860 | 05:10:38.9 | -68:45:12 | 9.00 | 2.19 | 8.3 | -0.52 | 3.90 | 34.61 |
| NGC 1831 | 05:06:17.4 | -64:55:11 | 18.28 | 4.44 | 8.5 | +0.01 | 4.71 | |
| NGC 3603 | 11:15:09.1 | -61:16:17 | 29.5 | 1.00 | 6.0 | 0.02 | 4.0 | 34.31 |
| Arches | 17:45:50.4 | -28:49:20 | 10 | 0.39 | 6.3 | 0.02 | 4.9 | 34.22 |
| Quintuplet | 17:46:14.8 | -28:49:35 | 12 | 0.46 | 6.6 | 0.02 | 3.8 | 33.32 |
| Structural parameters of LMC clusters are from Mackey & Gilmore (2003) | ||||||||
| 1 from Sung & Bessell (2004) and Moffat et al. (2002) | ||||||||
| 2 from Figer et al. (2002), Figer, McLean & Morris (1999) and Law & Yusef-Zadeh (2004) | ||||||||
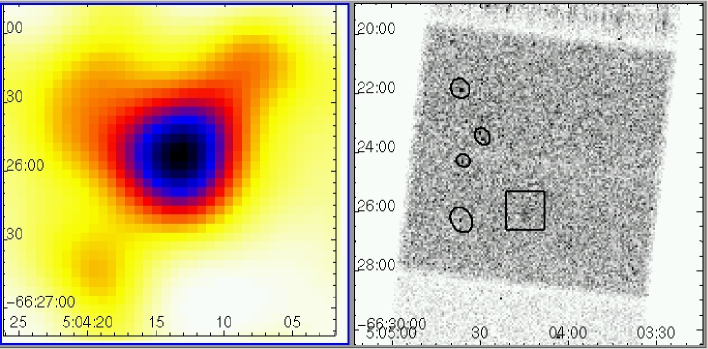
The Chandra X-ray observatory has performed 25 ksec pointing observations of NGC 1818 and NGC 1831, and a 30 ksec pointing observation of NGC 1850. NGC 1818 is a faint source of apparently diffuse emission detected with the standard Chandra data analysis wavedetect tool. The estimated number of source counts is 109. They are distributed nearly uniformly over a area of the sky, with the center of diffuse emission coinciding with the cluster center as listed in the Table 2. Additionally, the psfratio determined by wavedetect is , indicating that the source indeed may be extended. The low signal-to-noise spectrum of NGC 1818 was extracted.
In order to gain information on the absorption column density we extracted and fitted the spectrum of the brightest background object present in the ACIS-S field of view. The Seyfert I galaxy Cal F, only away from NGC 1818, is located behind the LMC (Geha et al., 2003). We tentatively fitted the spectrum of Cal F with a two-component model (power law and black body). This spectral fit allows to determine the absorption column density in the direction to NGC 1818, cm-2. One can make the plausible assumption that the absorption is mainly interstellar and is not intrinsic to the Seyfert I AGN.
With the absorption column density constrained, the spectrum of the X-ray emission from NGC 1818 can be fitted either with a power law with index , or with a multi-temperature thermal plasma with temperatures ranging from 0.3 to 5 keV. The raw and adaptively smoothed images of the cluster are shown in Fig. 2. The X-ray flux from NGC 1818 is erg s-1 cm -2.
A similar observation of NGC 1831 and NGC 1850 failed to detect X-rays from these cluster. In order to estimate an upper limit on its X-ray flux we run the wavedetect tool with significantly lower detection threshold, therefore allowing for fake detections. Eventually the area which coincides with the location of the clusters was “detected“, providing an estimate of the count rate. The upper limit on the flux from NGC 1831 is erg s-1 cm -2, and from NGC 1850 erg s-1 cm -2.
NGC 1860 was observed off-axis by XMM-Newton, and is included in the XMM-Newton Serendipitous Source Catalog. The flux retrieved from the catalog is erg s-1 cm -2. NGC 1860 is located close to the X-ray source 1AXG J051054-6844 (see Fig. 1). The latter is identified as a foreground late-type star in the literature.
Based on the distance of the LMC, which we adopt as 50.1 kpc throughout this paper (Mackey & Gilmore, 2003), the X-ray fluxes corrected for the interstellar absorption are converted into luminosities (Table 2).
The most massive Galactic star clusters also have been observed in X-rays, and analysis of their X-ray properties is available in the literature (Table 2). Galactic clusters demonstrate the same trend as LMC clusters, with younger ones being more X-ray active. NGC 3603 ( Myr old) exhibits a wealth of stellar point sources, along with a detectable level of diffuse emission (Moffat et al., 2002). The two most massive known in the Galaxy are the Arches (1-3 Myr old) and the Quintuplet (3-5 Myr old) (Figer et al., 1999, 2002), located in the central 50 pc of the Milky Way. Law & Yusef-Zadeh (2004) pointed out that the character of X-ray emission of the Arches and Quintuplet is different. The ratio of masses as well as of IR luminosities between Arches and Quintuplet is roughly 3:1. However, the ratio of X-ray flux (0.5-8 keV) is approximately 11:1; if only the point source emission is considered, the ratio rises to 18:1. The Quintuplet cluster appears to have relatively more diffuse emission, the hottest gas being located in the cluster core. In contrast to the Arches’ diffuse emission, the Quintuplet’s diffuse emission is clearly thermal.
3 Modeling of X-ray emission from star clusters
We consider an idealised star cluster with mass . It is assumed that the stars are coeval, i.e. the cluster has undergone an instantaneous burst of star formation. We assume that the stellar masses are distributed according to the standard (Salpeter) initial mass function (IMF), , with a lower mass cut-off at and an upper mass cut-off at . The radius of the cluster is such that the central density is about . The calculations are done for solar () and LMC () metallicity.
With the above assumptions, the output from the Leitherer et al. (1999) stellar population synthesis code can be directly applied.
The major simplifications we have made are the following: (1) We effectively assume a cluster of single stars. The realistic account for binary stars in the cluster would affect the IMF and the age attributed to the cluster. We account for the binarity in a parameterised way when modeling the cluster wind. We also consider binaries in estimates of the collective stellar X-ray luminosity. (2) We neglect the cluster dynamics. Mackey & Gilmore (2003) analysed surface brightness profiles and structural parameters for 53 clusters in the LMC. They concluded that the spread in the core radius increases significantly with increasing cluster age. For our model cluster the radius does not change during the evolution. Cluster mass is also assumed to be constant. (3) We assume that the mass-luminosity relation holds for the stars of all masses. We also assume that the stars evolve with constant mass till they reach WR phase. (4) We do not consider X-ray emission from degenerate stars and X-ray binaries. There is a broad discussion in the literature on this subject. (5) We exclude any possible sources of non-thermal X-rays.
The time dependent X-ray luminosity of a cluster is
| (1) |
The diffuse X-ray emission, , originates in the cluster wind. The collective stellar luminosity is
| (2) |
where is the X-ray luminosity of a star with mass at age . In the next two sections we describe our modeling of the diffuse and the stellar component.
4 Diffuse X-ray emission of star clusters
4.1 Wind from a model cluster
The interstellar medium (ISM) in a star cluster receives a constant supply of gas, at a rate , due to the mass loss from massive stars and, later on, supernova explosions. In addition, material can be ablated from protostellar (or planetary) disks (e.g. Kroupa & Bouvier, 2003). Some quantities of primordial gas may also be present in a young cluster. Following Stevens & Hartwell (2003), let us call this additional contribution . Then the total mass input to a star cluster is . Stellar winds and SN explosions supply also kinetic energy to the cluster’s ISM at a rate . Some fraction of this kinetic energy input is thermalised, heating the gas to X-ray emitting temperatures. Both, and , vary significantly during evolution of the cluster. Being initially low for a very young cluster, stellar mass-loss and energy input are increasing while stars are evolving, and reach their maximum with the beginning of SN ignition. On the other hand, in an old cluster, where massive stars are absent, and steeply decline.
Stellar population synthesis, such as Starburst99 (Leitherer et al., 1999), are convenient tools to provide and that account for both, stellar winds and supernova explosions. We used here the standard output of Starburst99 for the appropriate metallicities to obtain the mass and energy yields.
There is a shortcoming in Starburst99 for determining the mass and energy input in a dense star cluster. The model accounts only for single stars, while in fact the majority of high-mass stars in massive clusters are in binary or multiple systems. The mass-loss rate from a binary star is basically the sum of the mass-loss rates from two single stars. However, there can be a difference in the rates of kinetic energy input between single and binary stars. In massive binary systems the stellar winds interact in a way, that a part of the total kinetic energy is dissipated, e.g. for the heating of the colliding winds zone, and radiated away. Although it is possible to speculate which fraction of kinetic energy is consumed due to the wind-wind collision, there are a number of other uncertainties regarding energy losses in a star cluster. A parameter , accounting for all these uncertainties, was introduced in Chevalier & Clegg (1985) and later called “thermalisation efficiency” in Stevens & Hartwell (2003). Thus, the energy losses due to the wind-wind collisions in binary systems can be accounted for in a parameterised way, using factor .
To calculate the X-ray luminosity of cluster wind one must solve the hydrodynamical equations. Chevalier & Clegg (1985) have shown that a wind from a star formation region can be described as a self-similar process (Zel’dovich & Raiser, 1967, p.789), and obtained solutions applicable to mass loaded cluster winds.
Let us consider the evolution of the broad band X-ray luminosity of an idealised model cluster with mass and radius pc. The resulting density is . We consider the X-ray luminosity of the whole cluster core, and do not infer its radial profile. Therefore the Chevalier & Clegg (1985) solutions for density, , and the pressure, , are integrated over the cluster core radius.
The frequency-integrated X-ray luminosity of the cluster wind at epoch is
| (3) |
where is the cooling function, and is the emission measure of the cluster wind:
| (4) |
and
| (5) |
with the Boltzman constant and proton mass . The mean molecular weights per ion, and per electron, , depend on the cluster age due to chemical evolution. However, for simplicity we assume that and do not change significantly and consider them to be constant (1.3 and 1.14, respectively).
From scaling laws of self-similar solutions, emission measure and temperature of the cluster wind within the mass and energy production region of radius are
| (6) |
and
| (7) |
Therefore, when and are known at time , the temperature, density and velocity of the cluster wind can be obtained without solving partial differential equations.
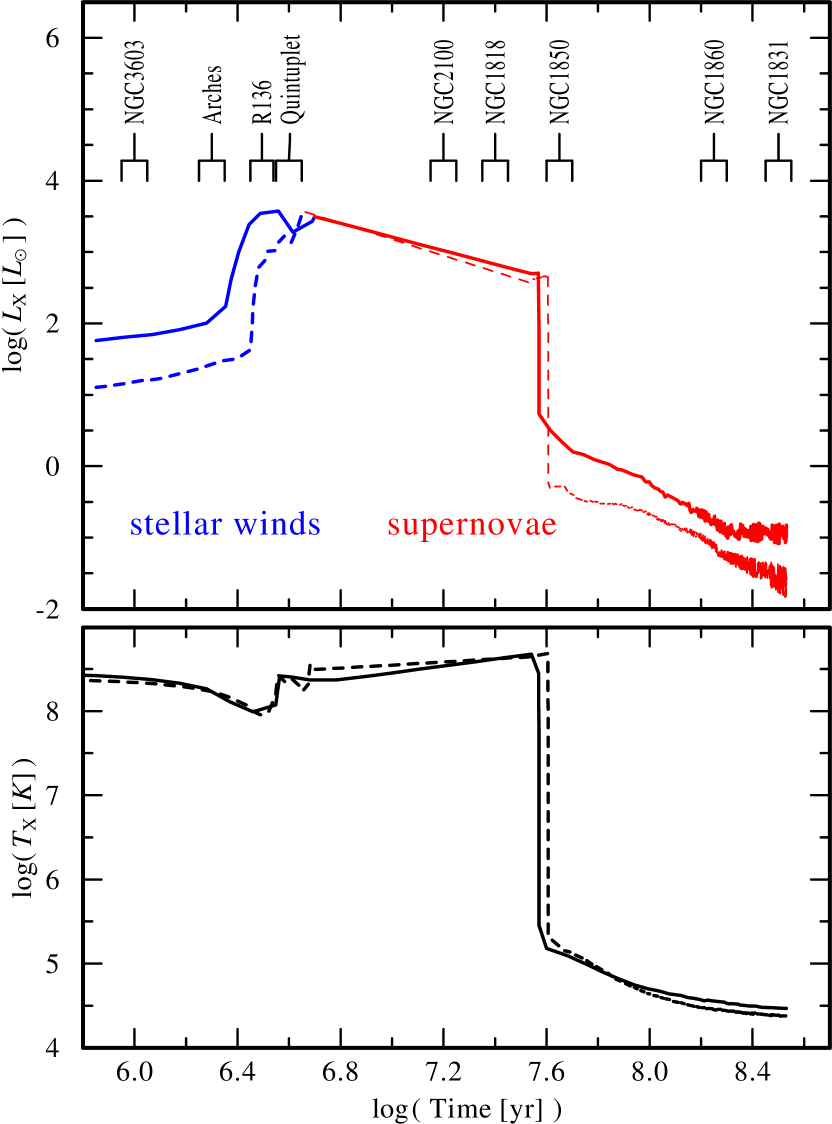
Assuming and , we substitute the mass input, , and kinetic energy input, , provided by population synthesis into Eqs. (3, 6, 7) and obtain the luminosity of the cluster wind versus time (Fig. 3).
As can be readily seen from Fig. 3, the level of diffuse emission varies significantly during the cluster history. In a cluster younger than 2.4 Myr (), stellar population synthesis predicts neither stars with high mass-loss rates (such as LBVs or WR stars) nor supernova remnants. The influx of mass into the intracluster medium is therefore small, resulting in a relatively low density and emission measure.
After the first Myr of stellar evolution the most massive stars pass trough the LBV stage, which is a very brief but nevertheless important phase because of high mass loss. Subsequently they evolve to Wolf-Rayet stars. Due to the mass and energy input of these stars, the level of diffuse X-ray emission of the cluster wind increases by two orders of magnitude. WR stars finish their lives after a few years by a SN explosion. 6.3 Myr () after initial starburst the mass and energy input from SN explosions becomes dominant and maintains a nearly constant X-ray luminosity of the cluster wind for millions of years.
It is not expected that stars with initial masses below undergo a SN explosion (Woosley, Heger & Weaver 2002). These stars do not have significant stellar winds either. Therefore, in a cluster older then Myr () no stars with high mass loss are left. Consequently the mass and energy supply to the cluster wind is cut-off. The temperature drops sharply and cluster wind is not a source of diffuse X-ray emission any more.
4.2 Comparison with observations
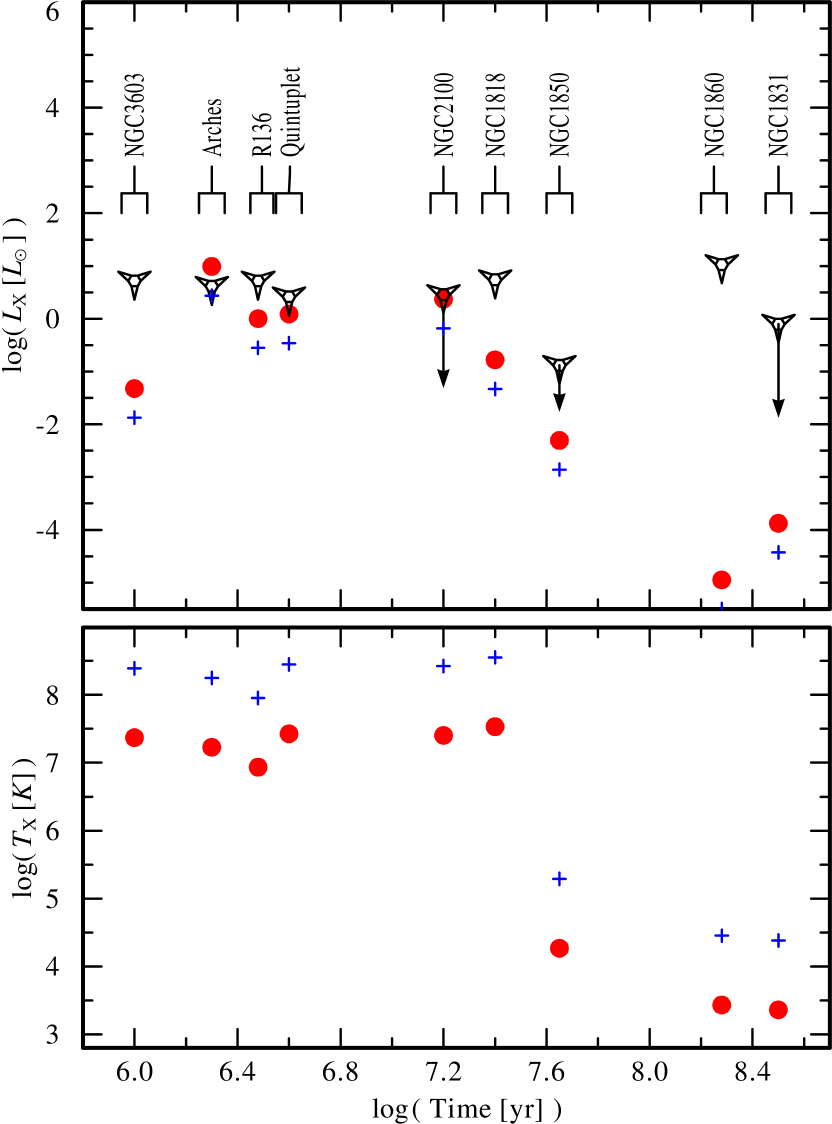
The above theoretical considerations can now be confronted with the empirical data described in Section 3. First, we have plotted the observed diffuse X-ray luminosity of the clusters listed in Table 2 in the upper panel of Fig. 4 (diamond symbols). Next, for each cluster we calculated the theoretical X-ray luminosity and the temperature of cluster wind, assuming , and . The crosses in Fig. 4 represent these theoretical values. As can be seen from the upper panel of Fig. 4 the observed diffuse X-ray luminosity is much higher than the theoretical one, the only exception being the Arches.
Given the quality of the data, the information on the observed temperature is quite limited. Law & Yusef-Zadeh (2004) analysed the spectra of the diffuse gas in the Arches and in the Quintuplet. For the Arches, the best fit is a two-temperature thermal model with K and K. For the Quintuplet the peak temperature of the diffuse gas in the cluster center is K. Stevens & Hartwell (2003) report K as the temperature of diffuse gas in R 136. Our analysis of NGC 1818 suggests that the observed temperature is ranging from to K. (However, due to the quality of the spectra the question whether the Arches and NGC 1818 emission is thermal remains open.) As can be seen from the lower panel in Fig. 4 the theoretical X-ray temperatures (crosses) are apparently too high compared to the temperature estimates deduced from the spectral fits.
There are two aspects to be considered in order to explain these discrepancies. First, the luminosities of diffuse emission listed in Table 2 cannot be attributed unambiguously to the cluster wind alone. Second, regarding the model, we adopted a certain cluster age (listed in Table 2). The estimates of the cluster ages, however, have a large uncertainty. E.g., the estimated ages are 1 – 3 Myr for the Arches, 3 –5 Myr for the Quintuplet, and Myr for NGC 3603. As can be seen from Fig. 3, the model predicts that the diffuse X-ray luminosity rises by two orders of magnitude between 1.6 and 3.2 Myr. Hence, the predicted X-ray luminosity is very sensitive to the cluster age.
Second, the values represented by small crosses are obtained under the assumption that the mass-loss is only from stellar winds and SNe () and that all mechanical luminosity released in the cluster is spent to heat the cluster wind (). But, as can be seen from Eq. (7), a thermalisation efficiency smaller then unity, and increased mass input will act to decrease the temperature of the cluster wind. As pointed out by Stevens & Hartwell (2003), this decrease of the temperature can be understood as a drop in the average energy available per particle. Since bremsstrahlung scales with the square root of temperature and using scaling relation Eq. (7), one notices that . Therefore, for somewhat higher mass input and reduced energy input, the luminosity is expected to rise.
We did not attempt to infer and from the observations because of the many uncertainties in observed quantities. But it can be shown that it is possible to find such a combination of these parameters that would make the theoretical values of X-ray luminosity and temperature resembling the observed ones. As an example, we plotted in Fig. 4 (large dots) and that were obtained assuming plausible values and thermalisation efficiency . Compared to the models with and (crosses) the luminosity is higher while the temperature is lower.
The theoretical values fit quite well to the observed ones for the R 136 and the Quintuplet. For the Arches, the model predicts higher diffuse X-ray luminosity than is actually observed. There are at least two explanations for this discrepancy. First, if the age of the Arches is actually smaller than assumed here (2 Myr), the predicted X-ray luminosity will be reduced towards the observed one. Second, the diffuse luminosity of Arches may be higher than the one used here ( erg s-1), depending on the interpretation of the observational data. For instance, Stevens & Hartwell (2003) used erg s-1 as the empirical value.
Two LMC clusters, NGC 1818 and NGC 1860, show X-ray emission at a much higher level than expected from the cluster wind alone. To explain this, other sources of X-rays radiation should be invoked. From the image of NGC 1818 in Fig. 2 it is difficult to decide if the source is actually diffuse or pointlike. Also, the very low count-rate does not allow to extract any useful spectral information. However, one may expect the presence of a supernova remnant in a 25 Myr old star cluster like NGC 1818. In fact our sample includes five LMC clusters older than 4 Myr. Statistically, at least one of them should exhibit a young supernova remnant (SNR). Applying scaling relations for the dynamical age of SNR and SN energy from Hughes, Hayashi & Koyama (1998) to NGC 1818, we estimate the possible SNR age of a few years and SN’s energy of about erg. The SNR X-ray emission further discussed in Sect. 6.
The relatively high level of X-ray emission from the 200 Myr old cluster deserves special attention. The cluster was observed off-axis. It is also apart from a bright foreground star. As listed in the XMM-Newton Serendipitous Source Catalogue, NGC 1860 has a detectable level of emission harder than 4.5 keV. As we will show in the subsequent sections, it is not expected that normal stars would be significant X-ray sources at the age of NGC 1818 and NGC 1860. Therefore, X-rays in NGC 1860 can be possibly attributed to either a SNR or a degenerate star.
Another interesting result is that the observed X-ray emission from NGC 3603 is much higher than can be accounted for with the cluster wind model. As was suggested by Moffat et al. (2002), the high luminosity of diffuse emission in this cluster may be attributed to unresolved low-mass stars. We will investigate the contribution of the low- and high-mass stars in the next sections.
5 Evolution of the X-ray luminosity of stars
If the X-ray luminosity of a star scales with its bolometric luminosity, and the latter scales with the stellar mass, one can estimate the total X-ray luminosity of stars with given mass.
For simplicity we assume that stars evolve with roughly constant luminosity. In order to model the evolution of stellar X-ray luminosity of a cluster, we a) calculate the number of stars per mass bin from the adopted IMF; b) use a mass-luminosity relation to estimate the stellar bolometric luminosity; c) estimate the X-ray luminosity using a correlation between X-ray and bolometric luminosities; d) estimate the lifetime in hydrogen-burning stages for a star of given mass. Thus a correlation between X-ray luminosity and age is obtained.
We have adopted the mass-luminosity relation from Binney & Merrifield (1998, p.280),
| (8) |
where is assumed to be equal to the bolometric luminosity on the main sequence.
The origin of X-ray emission is different in low and high mass stars. Low-mass stars () emit X-rays as result of magnetic activity caused by the dynamo mechanism and connected with the presence of outer convective layers. Massive stars, on the other hand, are thought to be X-ray emitters due to shock waves in their powerful (either colliding or freely expanding) winds driven by radiation pressure. Stars with masses between 3 and 10 generally do not emit X-rays, because outer convective zones are absent in stars more massive than , and stellar winds are weak for stars less massive then .
5.1 Low- and solar-mass stars
| (Age) [yrs] | [erg/s] | [erg/s] |
|---|---|---|
| 5.5 6.0 | 30.65 | 31.50 |
| 6.0 6.5 | 30.0 | 31.18 |
| 6.5 7.5 | 29.51 | 29.73 |
To trace the evolution of X-ray emission from an ensemble of low- and solar-mass stars () we use the results obtained from the study of stars in the Orion Nebular Cluster (ONC). Flaccomio et al. (2003) explored the relationship between X-ray activity and stellar mass and age for 696 well-characterized ONC members based on Chandra observations. They found a direct correlation between and mass for stars less massive than . For stars with masses in the range from 3 to 10 , is small and attributed to the less massive companion in binaries. For massive O stars (), rises again (see Flaccomio et al., 2003, Fig. 4). The authors attributed the drop in X-ray luminosity at to the time when stars of the ONC’s age ( Myr) become fully radiative and, therefore, the dynamo driven X-ray activity stops. The large number of ONC stars with very small masses () has been undetected in X-rays.
In Table 3 we summarize the correlation between X-ray luminosity and stellar age for stars with masses () observed in the ONC. Flaccomio et al. (2003) discuss the interpretations of this correlations, including possible observational selection effects. They conclude the existence of a real age spread in the ONC.
Stelzer, Micela & Neuhäuser (2004) observed the central region of the Chamaeleon I South star-forming cloud with XMM-Newton. In general, they confirm the results obtained for the ONC and report that about 10% of the low-mass stars in their sample are X-ray flaring. Most of the variability can be attributed to the hard band (2.5-10 keV), while the emission in the soft band (0.2-2.5 keV) is more steady. Some of the variable stars seem to undergo irregular variability and flaring. A large number of stars can be detected only during short duration ( h) flares in the hard band.
Let us trace the evolution of the total X-ray luminosity of low- and solar-mass stars in our idealised model cluster111For the estimate of the number of low-mass stars we assumed a lower mass cut-off of the IMF at 0.1 .. The total number of stars with masses between is , while stars are in the mass bin.
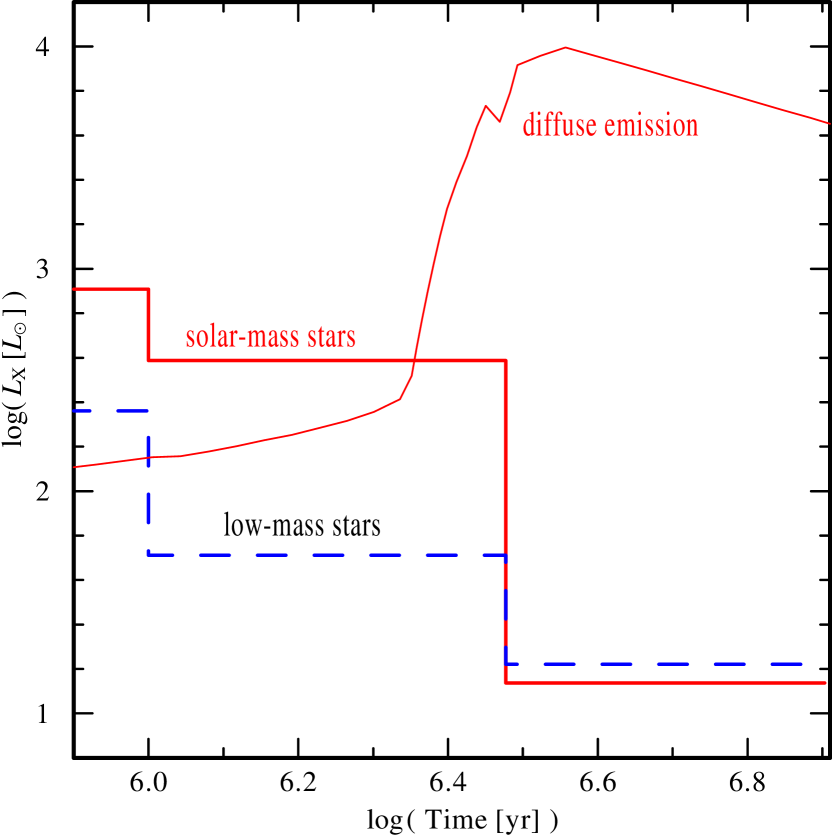
Assuming that the luminosity of each star changes with age as specified in Table 3, and adding all stars in each mass bin, we obtain the collective X-ray luminosity of low- and solar-mass stars as function of age (Fig. 5). Individual low- and solar-mass stars are relatively weak X-ray sources. However, they are numerous and difficult to resolve spatially. Figure 5 demonstrates that in clusters younger than 3 Myr the collective luminosity of low- and solar-mass stars is quite high.
To understand the contribution of low-mass stars to the total X-ray emission of massive clusters let us imagine how the ONC would look if it were located in the LMC. Numerous X-ray dim low-mass stars fill the whole volume of the stellar cluster, while massive stars tend to concentrate towards the center. Chandra’s HRC observations analysed by Flaccomio et al. (2003) covered a field of view, and were centered on the Trapezium cluster. The density of the Trapezium, stars pc-3 within the central 0.1 pc, makes it one of the most dense clusterings known in our Galaxy. Chandra observations resolved 111 point sources (Schulz et al., 2001) in the Trapezium. While most of these sources are faint, twelve have an X-ray luminosity above erg s-1 and four of those are identified with massive early-type stars. The ONC is located at 440 pc. At the distance of the LMC, the 807 stars from Chandra’s HRC observations would be all within . The PSF of Chandra has a FWHM of . Hence it would be impossible to resolve the low- and solar-mass stellar population, while the X-ray bright stars of Trapezium would appear as one point source embeded in diffuse emission.
It was found in the previous section that the cluster wind emission alone cannot explain the observed diffuse X-ray luminosity of NGC 3603. This cluster is only about 1 Myr old, and one may expect that stars less massive than are still fully convective and X-ray active (see references in Flaccomio et al., 2003). Using the standard IMF and the average X-ray luminosity as listed in Table 3, we roughly estimate the collective X-ray luminosity of low- and solar-mass stars in NGC 3603 as erg s-1. The sum of the cluster wind luminosity and the collective luminosity of low- and solar-mass stars matches the observed level of diffuse X-ray emission in NGC 3603 very well, thus confirming the suggestion of Moffat et al. (2002) and Sung & Bessell (2004). In older clusters, such as Quintuplet or R 136, the low-mass stars are less active, and massive stars become the main sources of stellar X-ray emission.
5.2 O stars
| Name | Exp. Time | Count Rate | Detector | ||||
| [ksec] | [ ct s-1] | [cm-2] | [pc] | [erg s-1] | [erg s-1] | ||
| Spectroscopic binary stars | |||||||
| HD 57060 | 3.1 | 3.550.4 | 20.81 | 1514 | 32.15 | 39.44 | pspc |
| HD 57061 | 77.7 | 10.930.1 | 20.74 | 1514 | 32.62 | 39.46 | pspc |
| HD 93205 | 1.4 | 5.90 | 21.33 | 2630 | 33.04 | 39.50 | pspc |
| HD 93206 | 1.2 | 6.590 | 21.34 | 2512 | 33.06 | 39.46 | pspc |
| HD 93403 | 37.8 | 2.10 | 21.57 | 3200 | 33.57 | 39.70 | epic |
| HD 97484 | 4.3 | 1.720.2 | 20.44 | 3200 | 32.41 | 39.28 | pspc |
| HD 135240 | 2.5 | 7.300.6 | 21.18 | 615 | 33.59 | 38.77 | pspc |
| HD 149404 | 2.8 | 8.260.6 | 21.40 | 1380 | 32.68 | 39.70 | pspc |
| HD 152218 | 7.6 | 1.110.1 | 21.34 | 1905 | 32.05 | 38.78 | pspc |
| HD 152219 | 7.6 | 2.210.2 | 20.56 | 1900 | 31.98 | 38.76 | pspc |
| HD 152248 | 180.0 | 1757 | 33.00 | 39.81 | epic | ||
| HD 152590 | 8.9 | 0.910.1 | 20.57 | 1900 | 31.85 | 38.65 | pspc |
| HD 159176 | 20.4 | 130.300.9 | 21.33 | 1500 | 33.17 | 39.17 | epic |
| HD 165052 | 3.5 | 10.410.6 | 21.36 | 1585 | 32.88 | 39.10 | pspc |
| HD 167771 | 5.9 | 4.20 | 21.40 | 1585 | 32.54 | 38.97 | pspc |
| HD 203064 | 6.5 | 5.10 | 20.98 | 794 | 31.79 | 39.09 | pspc |
| HD 206267 | 3.1 | 10.40.6 | 21.49 | 780 | 32.36 | 39.25 | pspc |
| Ori A | 2.3 | 176.52.8 | 20.18 | 501 | 32.77 | 39.34 | acis-s |
| Ori | 0.7 | 158.94.9 | 20.30 | 501 | 32.68 | 39.18 | pspc |
| LZ Cep | 5.0 | 5.640.3 | 21.33 | 583 | 31.72 | 38.66 | pspc |
| V729 Cyg | 3.4 | 12.200.6 | 19.94 | 1800 | 32.96 | 39.7 | pspc |
| Plaskett | 3.7 | 15.600.7 | 21.18 | 1514 | 32.91 | 39.35 | pspc |
| 15 Mon | 0.9 | 3.001.8 | 20.35 | 692 | 32.31 | 38.89 | pspc |
| Runaway single stars | |||||||
| Per | 1.0 | 20.001.0 | 21.06 | 398 | 31.68 | 39.47 | pspc |
| Cam | 3.8 | 6.590.4 | 21.08 | 1010 | 32.10 | 39.42 | pspc |
| Col | 3.7 | 15.140.7 | 20.04 | 669 | 31.89 | 38.45 | pspc |
| AE Aur | 2.4 | 4.370.4 | 21.30 | 321 | 31.02 | 38.16 | pspc |
| Oph | 2.0 | 39.002.0 | 20.78 | 154 | 31.15 | 38.46 | pspc |
| Cep | 4.2 | 6.500.6 | 21.20 | 832 | 31.92 | 39.42 | pspc |
| Pup | 55.7 | 126.901.6 | 20.00 | 437 | 32.43 | 39.49 | pspc |
| count rates are from “Complete Results Archive Sources for the pspc“ catalog | |||||||
| unless otherwise indicated | |||||||
| HD93205: average count rate from Rosat Catalog pspc WGA Sources | |||||||
| HD93403: from Rauw et al. (2002) | |||||||
| HD152248: from Sana et al. (2004) | |||||||
| HD159176: from De Becker et al. (2004) | |||||||
| V729Cyg: from Rauw et al. (1999) | |||||||
| Ori: as in Miller et al. (2002) | |||||||
| HD203064, Per, Cam, Oph, Cep, Pup: from Repolust et al. (2004) | |||||||
A correlation between X-ray and bolometric luminosity for Galactic O stars was suggested by Seward & Chlebowski (1982). Berghoefer et al. (1997) compiled a catalog of optically bright OB stars (RASSOB) based on the Rosat All Sky Survey (RASS). They found that for the ensemble of O stars. From theoretical side, Owocki & Cohen (1999) explained this correlation for single stars invoking the wind-momentum luminosity relation (Kudritzki & Puls, 2000). We decided to verify this correlation selectively, distinguishing between binary and single stars and using the better data available now.
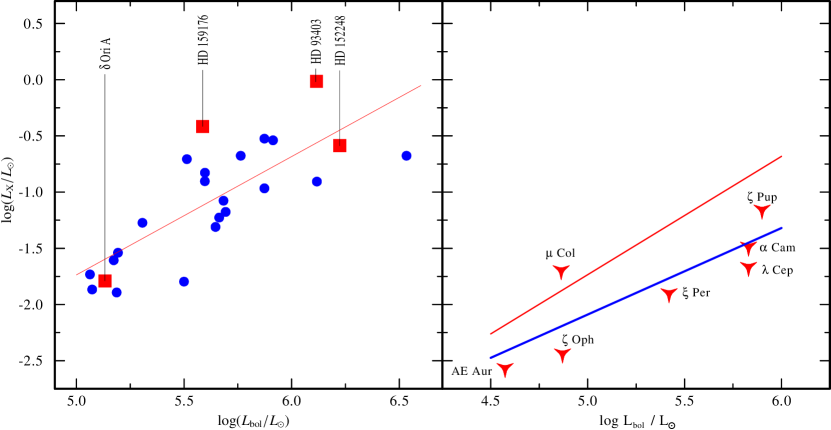
Binary systems. We selected a sample of O+O spectroscopic binary systems with available Rosat pointing observations or observed by Chandra or XMM-Newton. In order to keep the data as uniform as possible, in case when observations by different instruments exist, the preference was given to Rosat (pointing observations, in contrast to the RASS data available to Berghoefer et al., 1997). The data are summarized in Table 4. If not indicated otherwise, the neutral hydrogen column density, distance and are taken from RASSOB. The count rates were retrieved from The Rosat Complete Results Archive Sources for the PSPC catalog, and transformed into the X-ray flux assuming a Raymond-Smith thermal plasma with temperature keV. For the stars with resolved X-ray variability, was averaged over available observations.
From linear regression analysis of our sample of spectroscopic binaries we obtain a good correlation . This is rather puzzling because it is though that in binary stars a significant fraction of X-rays originates from a colliding winds zone. One may suggest that such a correlation is observed because Rosat’s PSPC detector (0.2 - 2.4 keV) was sensitive primarily to the emission from individual stellar winds, which have characteristic temperatures of about 0.6 keV, while plasma in the colliding wind zone might be heated to higher temperatures. If this were true, then the stars that were observed with XMM-Newton (0.2 - 10 keV) should not fit into the relation because this instrument also detects harder radiation. The fact that there is no significant scatter (see left panel of Fig. 6) between the binaries observed with XMM-Newton and Rosat makes us suggest that the bulk of observed X-rays originates in the individual stellar winds.
De Becker et al. (2004) concluded from their study of the colliding O+O binary HD 159176 that the bulk of X-rays comes from a plasma with keV, as expected from the hydrodynamic models of single stars, and that the line width is consistent with the stellar wind velocity. However, the steady-state colliding wind model systematically predicts too high X-ray luminosities. Nevertheless, the observed “hard tail“ in the X-ray spectrum of HD 159176 most likely originates from the colliding wind zone. Miller et al. (2002) discussed extensively the origin of X-rays in the eclipsing system Ori. They as well concluded that the bulk of X-rays is originating in the O star wind.
Single runaway stars. If our hypothesis about stellar wind emission dominance over colliding wind zone emission in O binaries is correct, then there should be a similar correlation for single stars. There is no way to select a sample of O stars which are definitely single. However, one might select a sample of runaway stars. The fraction of single stars among all runaway stars is very high (%). We have chosen all single runaway stars from the O Star Speckle Survey (Mason et al., 1998) (see Table 4) and performed a linear regression analysis for this sample. There are only seven single runaway stars with available Rosat pointing, therefore the result is not statistically significant. Nevertheless, the X-ray luminosity of single stars appears to correlate with in a similar way as found for the O star binaries (Fig. 6).
Hence we may apply the correlation for O stars, disregarding whether they are single or binaries.
5.3 LBV stars
A massive star with initial mass above that began its life on the MS as an O type star may become very unstable near the end of core H-burning. Such stars are called luminous blue variables (LBVs) or S Dor variables. They populate the empirical upper luminosity boundary in the H-R diagram and evolve directly to the WR stage via high mass loss episodes. Less luminous LBVs have initial masses less than and have probably already been through the red supergiant stage (Humphreys, 2003). Dozens of LBVs are identified in the Milky Way and the Local Group (van Genderen, 2001). Many LBVs are found in the vicinity of a young star cluster.
Some of the LBVs are luminous X-ray sources. Nazé et al. (2002) deduce from the Chandra observation of NGC 346 in the SMC that the X-ray luminosity of the binary LBV star HD 5980 is erg s-1. This in fact exceeds the total luminosity of the NGC 346 cluster ( erg s-1). The famous Galactic LBV Car has a similar luminosity erg s-1 (Leutenegger, Kahn & Ramsay 2003). Pittard & Corcoran (2002) fitted the high resolution X-ray spectrum of Car with hydrodynamic models of colliding winds. The X-ray emission of Car is similar to WR 140 and Vel: the emission is hard and variable, with the minimum near the phase when the star with denser wind is presumably in front.
However, not all LBVs are bright in X-rays. The prototypical LBV star P Cyg was observed for 97 ksec with Rosat. Using interstellar reddening and bolometric luminosity from van Genderen (2001) we estimate the X-ray luminosity of P Cyg as erg s-1 resulting in . Another example is the blue supergiant Sher 25 associated with NGC 3603 (Brandner et al., 1997). Moffat et al. (2002) report that this star has no significant X-ray detection and attribute this to the relatively low combined with a low wind velocity.
5.4 WR stars
During its evolution a massive star looses a significant amount of mass via a stellar wind, LBV outbursts or mass transfer in a close binary system, revealing first the CNO-burning products at its surface (WN phase), and subsequently the He-burning products (WC phase). The mass-loss from WR stars ( , Hamann & Koesterke, 1998) is at least one order of magnitude higher than in O-type stars (, Repolust et al., 2004). The winds of WR stars are enriched by nuclear evolution products. An understanding of the mechanisms by which radiative pressure drives WR stellar winds is currently emerging (Gräfener & Hamann, 2004).
X-ray emission from single WR stars is largely enigmatic. There are no theoretical models of WR winds that describe the generation of X-rays, although the expectation is that the same mechanism as in O winds may operate here. This is supported by a study of instability growth rates in WR winds (Gayley & Owocki, 1995). Meanwhile, the increasing number of observations of WR stars reveal a complex picture. Pollock, Haberl & Corcoran (1995) analysed the RASS observations of WR stars, and concluded that there is no correlation between bolometric and X-ray luminosity.
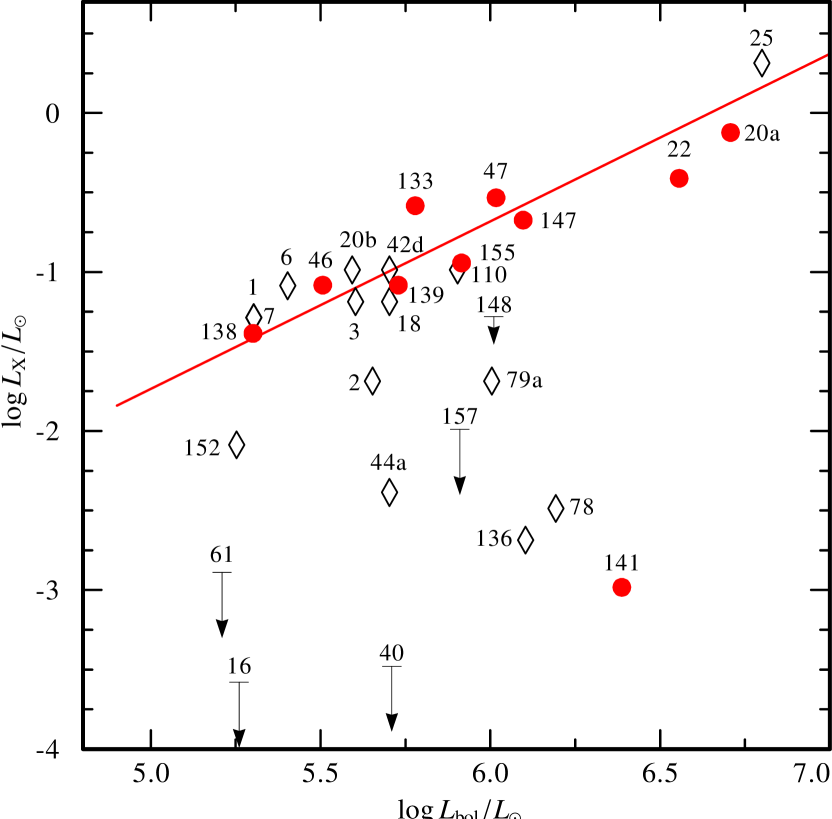
Similar to the study of O-type stars we compile the most sensitive up-to-date X-ray observations of WR stars (Table 5). We restrict ourselves to WN-type stars. As shown in Oskinova et al. (2003), WC-type stars were not detected in X-rays, except for a few binaries. Figure 7 shows the bolometric and X-ray luminosities of our sample of Galactic WN stars. We first discuss the X-ray emission from putatively single WN stars, and then from binary stars.
Single WN stars. Almost all bright O stars are found to emit X-rays. Out of the 11 stars in the RASSOB sample which were not detected in the Rosat All Sky Survey, nine have been detected since. Only HD 68450 and HD 154368 still remain undetected, probably because being observed only off-axis with short RASS exposures.
In contrast, the X-ray luminosity of WN stars shows a much larger scatter. While a couple of WN stars have significant X-ray fluxes, some remain below the detection limit even after long exposures. Correcting for their distance and reddening, which are typically both larger than for the RASSOB stars, these WN stars still must be intrinsically X-ray dim.
| WR | Sp. type | d | Exp. | Detector | |||
|---|---|---|---|---|---|---|---|
| [erg s-1] | [cm-2] | [kpc] | [ks] | [erg s-1] | |||
| Putatively single WN stars | |||||||
| 2 | WN2w | 39.24 | 21.30 | 2.51 | 9.2 | 31.9 | pspc |
| 3 | WN3 | 39.19 | 20.96 | 4.30 | 8.4 | 32.4 | epic |
| 152 | WN3w | 38.84 | 21.26 | 2.75 | 4.7 | 31.5 | pspc |
| 6 | WN4s | 38.99 | 20.78 | 0.97 | 9.5 | 32.5 | epic |
| 1 | WN4s | 38.89 | 21.48 | 1.82 | 7.6 | 32.3 | epic |
| 7 | WN4 | 38.89 | 21.33 | 5.75 | 7.0 | 32.3 | pspc |
| 18 | WN5s | 39.29 | 21.47 | 4.57 | 7.6 | 32.4 | pspc |
| 42d | WN5 | 39.29 | 21.85 | 4.09 | 49.3 | 32.6 | acis-i |
| 44a | WN5 | 39.29 | 21.91 | 3.24 | 57.5 | 31.2 | acis-s |
| 110 | WN5-6 | 39.49 | 22.02 | 1.28 | 20.5 | 32.6 | epic |
| 20b | WN6 | 39.18 | 21.94 | 2.27 | 36.2 | 32.6 | acis-i |
| 136 | WN6 | 39.69 | 21.36 | 1.26 | 93.9 | 30.9 | acis-s |
| 78 | WN7 | 39.78 | 21.28 | 1.99 | 9.9 | 31.1 | pspc |
| 25 | WN7a | 40.38 | 21.28 | 3.24 | 109.0 | 33.9 | epic |
| 79a | WN9 | 39.59 | 21.28 | 1.99 | 9.4 | 31.9 | pspc |
| Binary WN-type stars | |||||||
| 46 | WN3+OB? | 39.09 | 21.08 | 4.07 | 70.3 | 32.5 | epic |
| 133 | WN4+O9I | 39.36 | 21.15 | 2.14 | 78 | 33.0 | gis+sis |
| 138 | WN5+B? | 38.88 | 21.38 | 1.26 | 5.43 | 32.2 | pspc |
| 139 | WN5+O6III-V | 21.50 | 1.90 | 19.0 | 32.5 | pspc | |
| 141 | WN5+O5V-III | 39.97 | 21.66 | 1.26 | 19 | 30.6 | acis-s |
| 47 | WN6+O5V | 39.60 | 21.65 | 3.80 | 151 | 33.05 | epic |
| 155 | WN6+O9II | 21.40 | 2.75 | 90 | 32.64 | gis+sis | |
| 22 | WN7h+O9III-V | 40.14 | 21.02 | 3.24 | 82.7 | 33.17 | epic |
| 20a | WN6+WN6 | 39.99+39.99 | 21.89 | 5.75 | 32.6 | 33.46 | acis-i |
| 147 | WN8(h)+B0.5V | 39.68 | 22.12 | 0.65 | 4.9 | 32.91 | hrs-i |
| Significant non-detections of WN stars | |||||||
| 61 | WN5w | 38.79 | 21.41 | 6.79 | 52.6 | epic | |
| 157 | WN5 | 39.49 | 21.59 | 3.39 | 5.8 | pspc | |
| 40 | WN8 | 39.29 | 21.24 | 2.26 | 16.5 | epic | |
| 16 | WN8h | 38.85 | 21.36 | 2.37 | 7.6 | pspc | |
| 124 | WN8h | 38.88 | 21.70 | 3.36 | 4 | hri | |
| 148 | WN8h+B3IV/BH | 39.59 | 21.62 | 8.28 | 9.9 | ipc | |
Most intriguing are the XMM-Newton observations of WR 61 and WR 40, and the Rosat pointing observation of WR 16. These stars were not detected, and upper limits on are -8.1, -9.2 and -8.9 for WR 61, WR 40 and WR 16, respectively.
Note that WR 40 and WR 16 belong to the spectral subtype WN8. Remarkably, no WR star of this spectral type was ever detected in X-rays (see Table 5). Chandra HRC-I direct imaging of the binary WR147 (WN8(h)+B0.5V) (Pittard et al., 2002) showed X-rays which are certainly not co-spatial with the WN8 component, but associated either with the companion star or the colliding wind zone. There are indications that stellar winds from WN8 stars are basically different from other WN-type stars (Gräfener, priv. communication).
As can be seen from Fig. 7, the scatter of X-ray luminosity for the detected WN stars is extremely high, reaching up to three orders of magnitude. Apart from the WN8 case discussed above, there is no correlation with the WN subtype. The outstandingly X-ray bright star WR 25 was carefully examined in Raassen et al. (2003), who proposed that WR 25 might be a binary in order to explain its rather hard X-ray spectrum.
Binary WN stars. We have examined the available X-ray observations of WR binary stars. One half of 22 spectroscopic binary WN stars listed in the viith Catalog of WR stars was not detected by RASS (the detection rate is even lower for WC-type binaries). Among those which were detected, we select the stars with the most sensitive observations (Table 5). As can be seen from Fig. 7, the X-ray luminosity is proportional to the total bolometric luminosity of the system. Moreover, the correlation is the same as found for O+O binaries, . The only exception is WR 141, which was in Chandra’s field of view but inconveniently located at a CCD edge. The Chandra source detection software recognises WR 141. The count rate is ct s-1, yielding , which is the lowest value among all detected massive binaries. Therefore we consider this count rate being uncertain and exclude the star from our statistical sample to probe the versus relation.
One should bear in mind that in general the O star is the more luminous component in a WR+O binary. Similar relations between and in WN+O and O+O binaries can be expected if the major fraction of observed soft X-rays originates in the individual stellar winds rather than in the colliding winds zone. It seems that this preposition can be confirmed observationally. Maeda et al. (1999) analysed ASCA observation of WR 139 (V444 Cyg). They attribute the soft-component emission at keV and non-variable luminosity to the individual O6 and WN5 components of the system. The hard component ( keV) is phase variable and is caused by a colliding wind shock. Our preliminary analysis of XMM-Newton observations of WR 22 gives a similar result. Overall, given the small number of available observations, it appears that WN+O binaries are quite similar to O+O binaries with respect to a correlation between and .
Summarizing, we conclude that the major fraction of X-ray photons in colliding wind binaries is emitted by the individual stellar winds of the binary components. The individual stellar winds typically have thermal spectra with characteristic temperatures of keV. The colliding wind zone may manifest itself by the presence of an additional, somewhat harder, either thermal or non-thermal component.
Binary WC stars. Only six WC spectroscopic binaries have been observed in X-rays with exposures longer than that of the RASS. ASCA observations of WR 132 and WR 113 are still waiting to be carefully examined. WR 11 ( Vel, WC8+O7.5III) was extensively observed with Chandra and XMM-Newton (e.g. Schild et al., 2004). From an analysis of the spectra taken in different orbital phases, Schild et al. (2004) conclude that the total X-ray emission of the system is dominated by the material located in the wind collision zone. The X-ray emission from the wind of the O-type companion is one order of magnitude smaller, and from the WC-type companion is negligible. For this system , varying by dex in dependence on orbital phase. ASCA observations of WR 140 (WC7+O4-5V) are reported by Zhekov & Skinner (2000). This star has also been monitored by RXTE and Chandra. There is no detailed stellar atmosphere analysis available for WR 140. We roughly estimate the bolometric luminosity of the system from the spectral types of the components, adopting and . Then the ratio of X-ray and bolometric luminosity of the system is estimated as . WR 48 ( Mus, WC6+O6V) was observed by a Rosat PSPC pointing. Assigning the same bolometric luminosity as for WR 140 we find . WR 79 (WC7+O5V) was observed by XMM-Newton. We have retrieved and analysed the archival data for this binary. The spectral types of the companions are similar to WR 140 and WR 48, therefore we use the same bolometric luminosity for an order of magnitude estimate, and obtain . WR 79 is located in the young star cluster NGC 6231, where a large number of massive binaries is present (Garcia & Mermilliod, 2000). Interestingly, WR 79 is the brightest X-ray source in the cluster in the 4.5-12.0 keV band. The spectral energy distribution of WR 79 is quite hard. Perhaps, by analogy with Vel, this hardness is due to the strong absorption that soft X-ray photons suffer when passing through the opaque WC wind.
From our brief review of WC binary systems it appears that the X-ray emission from the colliding wind zone dominates over the emission of the individual stellar winds. Our tentative analysis does not reveal any - correlation for WC binaries.
Population synthesis predicts that most of the time during cluster evolution, the number of WC stars is much smaller than of WN stars. However in clusters that are about 3-4 Myr old, the number of WC stars can be comparable to the number of WN stars (Leitherer et al., 1999).
Regarding to the X-ray emission from WR stars we may conclude that: (a) the emission from binary systems does not significantly differ between O+O and O+WN systems; (b) the level of emission from putatively single WN stars does not correlate with the bolometric luminosity of the stars. Some single WR stars are quite luminous X-ray sources, while others appear as non-emitters; (c) Although some of the WC binary systems can be relatively X-ray bright, this is not universal for all WC binaries. No X-ray emission yet detected from single WC stars. Hence, it seems that decreases for a significant fraction of the massive stars when they evolve to the WN stage, and drops even lower in the WC stage.
5.5 Evolution of X-ray luminosity of massive stars
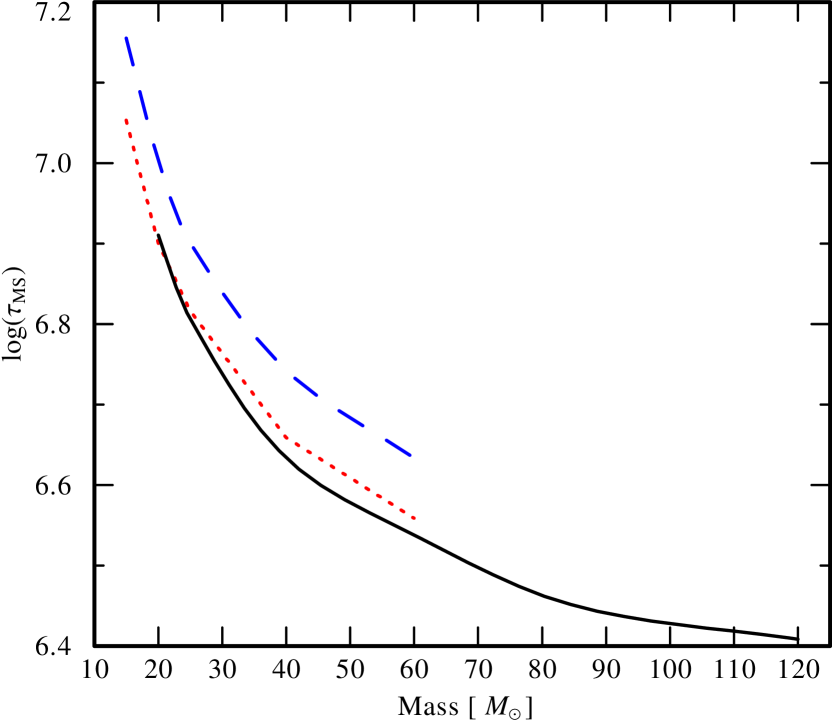
The predicted stellar lifetimes depend on the stellar evolution model. Recent Geneva models include the effects of rotation (Hirschi, Meynet & Maeder A., 2004). The effects of binarity on the evolution are included in the models by, e.g., Van Bever & Vanbeveren (2003). Both effects extend the lifetime on the main sequence. Therefore one attributes a younger age to a cluster when applying these models. Figure 8 shows the lifetime on the H-burning stage for stars of different mass as given by Hirschi et al. (2004) and by Schaller et al. (1992). We use the latter lifetimes in this paper. We do not explicitly include LBVs because of their fast evolution ( yrs), and because little is known about their X-ray emission. However, an LBV star may be the dominant X-ray source in a stellar cluster, as observed in NGC 346 (Nazé et al., 2002).
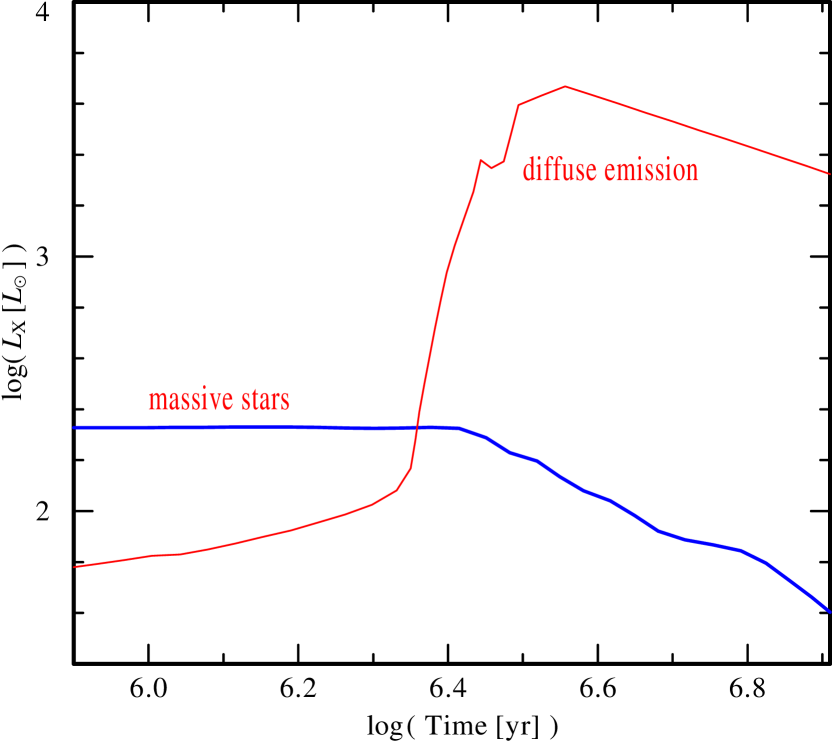
Figure 9 shows the evolution of the collective X-ray luminosity of massive stars in our model cluster. Considering Fig. 9 we shall notice an interesting interplay between the number of massive stars and the level of diffuse emission from the cluster wind. The cluster wind is fed my massive stars. If there are mass-loosing stars in the cluster, the cluster wind luminosity (see Eqs. 3, 6) while the collective stellar luminosity . Therefore, the ratio of cluster wind to stellar emission is smaller for less massive clusters.
Another point to address is the relation between the X-ray luminosity of low- versus high-mass stars. Our model predicts that in very young clusters the collective luminosity of low-mass stars should exceed the collective luminosity of the high-mass stars (compare Fig. 5 and Fig. 9). Nevertheless, the massive stars are detected as point sources in, e.g., NGC 3603, and are not out-shone by low-mass stars. The massive stars tend to concentrate in the cluster core, while low-mass stars fill the whole volume of the cluster. Therefore the surface X-ray brightness due to the low-mass stars is low, while the X-ray bright massive stars can be easily detected above the background. This situation lasts till the most massive stars enter the WR phase, and start to actively feed the cluster wind. After Myr of cluster evolution, the emissivity of the cluster wind exceeds the emissivity of individual stellar X-ray sources. This is exactly the situation observed in the LMC clusters, and shown in Fig. 1: the massive stars are seen in the youngest cluster, but sink into oblivion in the older clusters.
As seen in Fig. 9, the X-ray luminosity declines steeply after Myr of cluster evolution, when the most massive stars end their lives by a core collapse and a supernova explosion. Black holes are formed from stars with initial masses above , while neutron stars result from stars with lower masses (Woosley et al., 2002). From the analysis of the observations it appears that % of all OB stars must produce high mass X-ray binaries (HMXB) (consisting of a compact object and a massive star). This estimate is consistent with population synthesis studies (Helfand & Moran, 2001). The lifetime of a HMXB is limited by the nuclear time-scale of the optical companion ( Myr).
As can be seen from Table 2, NGC 2100, NGC 1818 and NGC 1850 are old enough to produce compact companions in HMXBs, and are young enough for most non-degenerate companions still to be present. Adopting the quoted estimate of % HMXB from all OB stars, one should expect 1 – 3 HMXBs in each of these three clusters. However, none of them shows X-ray point sources which are bright enough that they could be attributed to X-ray binaries. This apparent contradiction may indicate a problem with the predicted HXMB formation probability.
6 X-ray emission from supernova remnants
There are distinct phases in the dynamics of supernova remnants. Initially, the energy liberated in the collapse is deposited in the stellar envelope. The envelope is heated to a high temperature and ejected with high velocity. The expansion is uniform, with till the mass of swept-up material becomes significant. The highly supersonic expansion shock-compresses the ISM. The shocked heated ISM is heated and radiates by thermal bremsstrahlung. Bregman et al. (2003) analysed the ROSAT observations of the complete sample of nearby supernovae that occurred between 1985.5 and 1994.3. They concluded, that the probability of an individual SN to have a luminosity higher then erg s-1 is less then 12%. The probability of a supernova to be more luminous than erg s-1 is in the range . From Leitherer et al. (1999) the SN rate for a solar metallicity cluster is about SN yr-1 for a cluster older than Myr. Applying Bregman et al. (2003) results, the rate of X-ray bright supernovae in such a cluster can be roughly estimated as per year. When an X-ray bright SN occurs, it is likely to be the brightest source of X-rays in its cluster, but only for rather short time. The X-ray brightness of SNe declines sharp with time as or .
After a few years, the swept-up mass becomes greater then the ejected mass, and the expansion is described by the adiabatic blast-wave (Sedov-Taylor) solution. The radius of the remnant is given by
| (9) |
where is the SN explosion energy in units of erg, is the number density of the preshock ISM, and is the SNR age in years and it is assumed that the material has solar composition. The post-shock temperature is
| (10) |
The frequency-integrated X-ray luminosity of the remnant is . The emissivity, , depends on , electron temperature (), abundances, and the ionisation state of the gas. For strong shock conditions and ideal gas behavior, the postshock-to-preshock density ratio is constant, . With the dependence of the remnant radius on time in Eq. (9), the emission measure of the remnant scales as .
Borkowski, Lyerly & Reynolds (2001) presented improved calculations of the X-ray spectra for SNRs in the Sedov-Taylor phase. Their model is implemented in the xspec software package. The input parameters of this model are the shock temperature , electron temperature and the ionisation timescale, determined by the product of post-shock electron density and the remnant’s age. Using the cluster wind model to obtain pre-shock density and (see Eq. 10), we could, in principle, model SNR X-ray emission for a cluster of given age, and trace how the environment in the cluster affects the SNR spectra. However, xspec models are not implemented over a wide enough range of parameters.
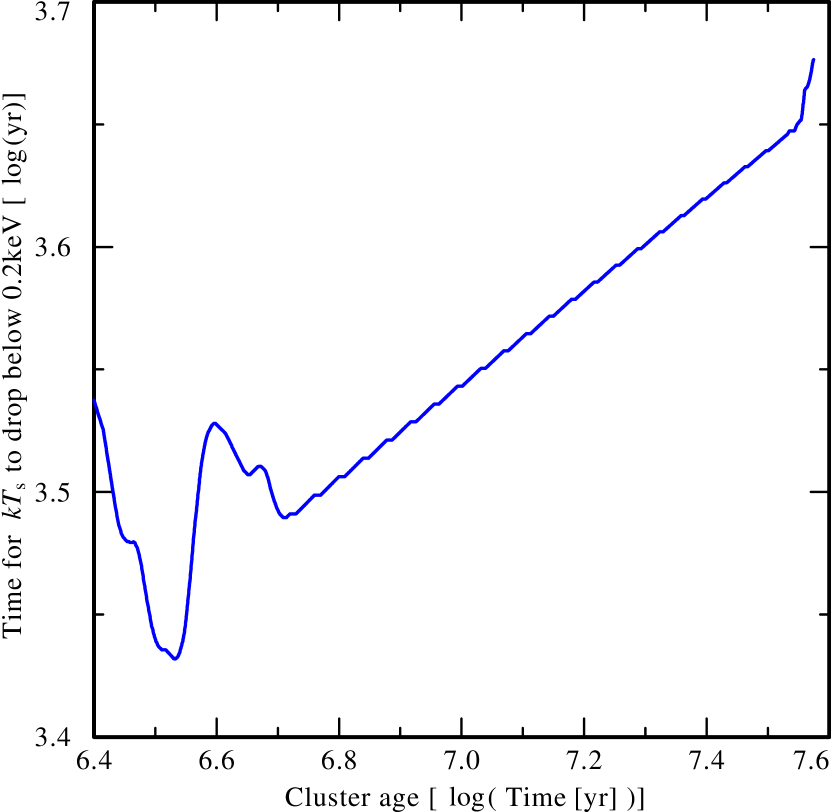
Using formulae from Borkowski et al. (2001) and our cluster model, we calculated the time it will take for a SNR in Sedov-Tayler phase to cool down below 0.2 keV. It was assumed that and erg s-1. The result is shown in Fig. 10. As can be seen, the cooling time is slowly increasing for older clusters. However, even taking into account this small effect, in a dense cluster, the SNR remains a significant X-ray source, with unabsorbed erg s-1, for only a few thousand years. During this time the is comparable to the level of the cluster wind luminosity (see Fig. 3) and the remnant radius is compared to the cluster core radius. However, since the cluster wind temperature is high and roughly constant (see lower panel in Fig. 3), the SNR spectrum is likely to be softer than the cluster wind spectrum. The supernova rate between 5 and 35 Myr in a cluster is about yr-1 (Leitherer et al., 1999), therefore we may expect an enhanced level of diffuse emission for older clusters, as it is observed in the LMC (see Fig. 3).
During the further phase in the dynamics of a SNR, as the remnant continues to expand, the cooling by optical emission lines become important and X-ray emission drops. Later the SNR expansion becomes subsonic, and the remnant disperses into the ISM.
7 Conclusions
We model both the thermal X-ray emission originating in a cluster wind and the evolution of X-ray emission from a stellar population and compare the model with observations. The conclusions are:
(1) Effects of stellar evolution in massive clusters can explain the observed differences in the level of diffuse emission and numbers of point sources in clusters of different age.
(2) The observed level of diffuse X-ray emission in young massive star clusters is in accordance with the theory of mass-loaded cluster winds. We retrieved and analysed X-ray observations of six prominent LMC clusters. The striking differences in the level of X-rays in these clusters can be explained by the different evolutionary stages of the clusters. The same holds for massive Galactic star clusters: NGC 3603, the Arches and the Quintuplet.
(3) The X-ray luminosity of the cluster wind is low for the youngest clusters, such as NGC 3603, where the majority of massive stars is still on the main sequence and, therefore, have moderate stellar winds.
(4) After the most massive stars evolved to the WR stage, characterised by dense and fast stellar winds, the level of cluster wind diffuse X-ray emission rises dramatically. Powered further by supernova explosions, the diffuse emission of a cluster wind is nearly constant during about 40 Myr.
(5) After about 40 Myr of cluster evolution, the supernova rate is expected to drop steeply. At this stage, the cluster wind ceases.
(6) The diffuse X-ray emission observed in the young Galactic cluster NGC 3603 cannot be explained by a cluster wind alone. Based on a study of the Orion Nebular Cluster by Flaccomio et al. (2003), we model the evolution of X-ray emission from an ensemble of low-mass stars. We conclude that X-ray active low-mass stars are the dominant sources of X-rays in clusters younger than Myr. Thus, we confirm the suggestion of Moffat et al. (2002) that non-resolved low-mass stars are responsible for the rather high level of diffuse X-rays observed in NGC 3603.
(7) We analyse the pointing Rosat and available XMM-Newton and Chandra observations of O and WN-type binaries and find that the correlation holds for these stars.
(8) From the study of X-ray observations of WN8 type stars we conclude that stars of this spectral type show no evidence of being X-ray sources. We speculate that the wind driving mechanism might differ between WN8 and other types of O and WN stars.
(7) Assuming evolution with constant bolometric luminosity, the collective X-ray luminosity of massive stars is constant over the first Myr. After the most massive stars become X-ray dim WR stars, the collective X-ray luminosity of massive stars declines fast.
(8) The ratio of diffuse luminosity of the cluster wind to the X-ray luminosity of massive stars is lower for less massive clusters.
(9) If a young supernova remnant is present in a cluster, it will dominate the cluster X-ray emission, however only for a short time of a few hundred years. The X-ray emission from a supernova remnant in the Sedov-Taylor phase is of the same order of magnitude as the cluster wind emission, but is expected to show a softer spectrum.
(10) Since the X-ray emission from a star cluster sensitively depends on its evolutionary stage, it may be used to constrain the cluster age and stellar population.
Acknowledgment
This research has made use of the SIMBAD database, operated at CDS, Strasbourg, France, and of data obtained through the High Energy Astrophysics Science Archive Research Center Online Service, provided by the NASA/Goddard Space Flight Center. The author is grateful to A. Feldmeier for insightful discussions on hydrodynamics, W.-R. Hamann for the careful reading of the manuscript, and to the anonymous referee for the detailed and constructive comments. The author acknowledges support from Deutsche Forschungsgemeinschaft grants Fe 573/1-1 and Fe 573/3-P.
References
- De Becker et al. (2004) De Becker M., Rauw G., Pittard J.M., Antokhin, I.I., Stevens I.R., Gosset E., Owocki S.P., 2004, A&A, 416, 221
- Berghoefer et al. (1997) Berghoefer T.W., Schmitt J.H.M.M., Danner R., Cassinelli J.P., 1997, A&A, 322, 167
- Binney & Merrifield (1998, p.280) Binney J. & Merrifield M., 1998, Galactic Astronomy (Princeton University Press)
- Brandner et al. (1997) Brandner W., Grebel E.K., Chu Y-H., Weis K., 1997, ApJ, 475, L45
- Bregman et al. (2003) Bregman J.N., Houck J.C., Chevalier R.A., Roberts M.S., ApJ, 2003, 596, 323
- Borkowski et al. (2001) Borkowski K.J., Lyerly W.J., & Reynolds S.P., 2001, ApJ, 548, 820
- Canto et al. (2000) Canto J., Raga A., Rodriguez L., 2000, ApJ, 536, 896
- Cerviño et al. (2002) Cerviño M., Mas-Hesse J.M., & Kunth D., 2002, A&A, 392, 19
- Chevalier & Clegg (1985) Chevalier R.A. & Clegg A., 1985, Nature, 317, 44
- Figer et al. (1999) Figer D.F., McLean I.S., & Morris M., 1999, ApJ, 514, 202
- Figer et al. (2002) Figer D.F., et al., 2002, ApJ, 581, 258
- Flaccomio et al. (2003) Flaccomio E., Damiani F., Micela G., Sciortino S., Harnden F.R.Jr., Murray S.S., Wolk S.J., 2003, ApJ, 582, 398
- Garcia & Mermilliod (2000) Garcia B. & Mermilliod J.C., 2000, A&A, 368, 122
- Gayley & Owocki (1995) Gayley K.G. & Owocki S.P., 1995, ApJ, 446, 801
- Gräfener & Hamann (2004) Gräfener G. & Hamann W.-R., 2005, A&A, in press
- Geha et al. (2003) Geha M., et al., 2003, AJ, 125, 1
- van Genderen (2001) van Genderen A. M., 2001, A&A, 366, 508
- Hamann & Koesterke (1998) Hamann W.-R., & Koesterke L., 1998, A&A, 333, 251
- Harries et al. (1998) Harries T.J., Hillier D.J. & Howarth I.D., 1998, MNRAS, 296, 1072
- Helfand & Moran (2001) Helfand D.J. & Moran E.C., 2001, ApJ, 554, 27
- Hirschi et al. (2004) Hirschi R., Meynet G. & Maeder A., 2004, A&A, 425, 649
- van der Hucht (2001) van der Hucht K.A., 2001, The viith Catalog of Galactic Wolf-Rayet Stars, New Astron. Rev., 42, 135
- Hughes et al. (1998) Hughes J.P., Hayashi I. & Koyama K., 1998, ApJ, 505, 732
- Humphreys (2003) Humphreys R.M., in A massive star odyssey: from main sequence to supernova: Proc. of the IAU Symp. no. 212; Edited by K. A. van der Hucht, A. Herrero and C.Esteban. ASP, p.38
- Ignace et al. (2003) Ignace R., Oskinova L.M., Brown J.C., 2003, A&A, 408, 353
- Kroupa & Bouvier (2003) Kroupa P. & Bouvier J., 2003, MNRAS, 346, 369
- Kudritzki & Puls (2000) Kudritzki R.-P. & Puls J., 2000, ARA&A, 2000, 38, 613
- Law & Yusef-Zadeh (2004) Law C., & Yusef-Zadeh F., 2004, ApJ, 611, 858
- Leitherer et al. (1999) Leitherer C., et al., 1999, ApJS, 123, 3
- Leutenegger et al. (2003) Leutenegger M.A., Kahn S.M. & Ramsay G., 2003, ApJ, 585, 101
- Mackey & Gilmore (2003) Mackey A.D. & Gilmore G.F., 2003, MNRAS, 338, 85
- Maeda et al. (1999) Maeda Y., Koyama K., Yokogawa J., Skinner S., 1999, ApJ, 510, 967
- Marchenko et al. (1997) Marchenko S.V., Moffat A.F.J., Eenens P.R.J., Cardona O., Echevarria J., Hervieux Y., 1997, ApJ, 485, 826
- Marchenko et al. (2004) Marchenko S.V., et al., 2004, MNRAS, 353, 153
- Mason et al. (1998) Mason B.D., Gies D.R., Hartkopf W.I., Bagnuolo W.G.Jr., Brummelaar T.T., McAlister H.A., 1998, AJ, 115, 821
- Miller et al. (2002) Miller N.A, Cassinelli J.P., Waldron W.L., MacFarlane J.J., Cohen D.H., 2002, ApJ, 577, 951
- Moffat et al. (2002) Moffat A.F.J., et al., 2002, ApJ, 573, 191
- Nazé et al. (2002) Nazé Y., et al., 2002, ApJ, 580, 225
- Oskinova et al. (2003) Oskinova L.M., Ignace R., Hamann W.-R., Pollock A.M.T., Brown J.C., 2003, A&A, 402, 755
- Owocki & Cohen (1999) Owocki S.P. & Cohen D.H., 1999, ApJ, 520, 833
- Pittard & Corcoran (2002) Pittard J.M. & Corcoran M.F., 2002, A&A, 383, 636
- Pittard et al. (2002) Pittard J.M., Stevens I.R., Williams P.M., Pollock A.M.T., Skinner S.L., Corcoran M.F., Moffat A.F.J., 2002, A&A, 388, 335
- Pollock et al. (1995) Pollock A.M.T., Haberl F. & Corcoran M.F., 1995, in Wolf-Rayet stars: binaries; colliding winds; evolution: Proc. of the IAU Symp. no. 163; Edited by K. A. van der Hucht and P. M. Williams. Kluwer Academic Publishers; Dordrecht, p.512
- Portegies Zwart et al. (2002) Portegies Zwart S.F., Pooley D., & Lewin W.H.G., 2002, ApJ, 574, 762
- Rauw et al. (2004) Rauw G., et al., 2004, A&A, 420, L9
- Rauw et al. (1999) Rauw G., Vreux J.-M., & Bohannan B., 1999, ApJ, 517, 416
- Raassen et al. (2003) Raassen A.J.J., et al., 2003, 402, 653
- Rauw et al. (2002) Rauw G., Vreux J.-M., Stevens I.R., Gosset E., Sana H., Jamar C., Mason K.O., 2002, A&A, 388, 552
- Repolust et al. (2004) Repolust T., Puls J., & Herrero A., 2004, A&A, 415, 349
- Sana et al. (2004) Sana H., Stevens I.R., Gosset E., Rauw G., Vreux J.-M., 2004, MNRAS, 350, 809
- Schaller et al. (1992) Schaller G., Schaerer D., Meynet G., Maeder A., 1992, A&AS 96, 269
- Schild et al. (2004) Schild H., et al., 2004, A&A, 422, 177
- Schulz et al. (2001) Schulz N.S., Caizares C., Huenemoerder D., Kastner J.H., Taylor S.C., Bergstrom E.J., 2001, ApJ, 549, 441
- Seward & Chlebowski (1982) Seward F.D. & Chlebowski T., 1982, ApJ, 256, 530
- Skinner et al. (2002a) Skinner S.L., Zhekov S.A., Gudel M., Schmutz W., 2002a, ApJ, 572, 477
- Skinner et al. (2002b) Skinner S.L., Zhekov S.A., Gudel M., Schmutz W., 2002b, ApJ, 579, 764
- Stelzer et al. (2004) Stelzer B., Micela G. & Neuhäuser R., 2004, A&A, 423, 1029
- Sung & Bessell (2004) Sung H. & Bessell M.S., 2004, AJ 127, 1014
- Stevens & Hartwell (2003) Stevens I.R., & Hartwell J.M., 2003, MNRAS, 339, 280
- Van Bever & Vanbeveren (2003) Van Bever J. & Vanbeveren D., 2003, A&A 400, 63
- Veen et al. (2002) Veen P.M, van Genderen A.M., Crowther P.A.,van der Hucht K.A.,2002, A&A, 385, 600
- Woosley et al. (2002) Woosley S.E., Heger A. & Weaver T.A., 2002, Reviews of Modern Physics, 74, 1015
- Zel’dovich & Raiser (1967, p.789) Zel’dovich Ya.B. & Raiser Yu.P., 1967, Physics of Shock Waves and High Temperature Hydrodynamic Phenomena (New York: Academic)
- Zhekov & Skinner (2000) Zhekov S.A. & Skinner S.L., 2000, ApJ, 538, 808