A library of high resolution synthetic stellar spectra from 300nm to 1.8m with solar and -enhanced composition
Libraries of stellar spectra are fundamental tools for the study of stellar populations and both empirical and synthetic libraries have been used for this purpose. In this paper, a new library of high resolution synthetic spectra is presented, ranging from the near-ultraviolet (300nm) to the near-infrared (1.8m). The library spans all the stellar types that are relevant to the integrated light of old and intermediate-age stellar populations in the involved spectral region (spectral types F through M and all luminosity classes). The grid was computed for metallicities ranging from [Fe/H] = –2.5 to +0.5, including both solar and -enhanced ([/Fe] = 0.4) chemical compositions. The synthetic spectra are a good match to observations of stars throughout the stellar parameter space encompassed by the library and over the whole spectral region covered by the computations.
Key Words.:
Stars: atmospheres, Stars: spectra, Stars: population synthesis1 Introduction
Libraries of stellar spectra are one of the main ingredients of stellar population synthesis models (e.g. Bruzual & Charlot 1993, 2003; Cerviño & Mas-Hesse 1994; Fioc & Rocca-Volmerange 1997; Leitherer et al. 1999; Vazdekis 1999; Buzzoni 2002; Schulz et al. 2002; Jimenez et al. 2004; Gonzalez Delgado et al. 2005; Maraston 2005; Schiavon 2005) and both empirical and theoretical libraries have improved dramatically in recent years. The first empirical libraries (e.g. Gunn & Stryker 1983; Jacoby et al. 1984) used in stellar population synthesis work were restricted to a relatively small number of stars with uncertain atmospheric parameters. The quality of empirical libraries has been refined along the years (e.g. Pickles 1998; Jones 1999) and recently, a major improvement has been achieved by Le Borgne et al. (2003; STELIB) and Valdes et al. (2004; Indo-US), which provide high S/N, medium resolution (down to FWHM 1) and a good coverage of the color-magnitude diagram.
Amongst the synthetic libraries, perhaps the most widely used is the flux distribution predicted from the Kurucz (1993) model atmospheres. Lejeune et al. (1997, 1998) and Westera et al. (2002) extended this library to include spectra of M stars computed from model atmospheres from Fluks et al. (1994), Bessell et al. (1989), Bessell (1991) and Allard & Hauschildt (1995). Moreover, they calibrated the flux distribution of the synthetic spectra in order to match the colors of observed stars (BaSeL library). However, the spectral resolution of the BaSeL library is limited to the sampling of the model atmosphere grid ( 20 ) which is by far lower than the modern observed spectra of both individual stars and integrated stellar populations. More recently, resolution ceased to be a limitation, with the publication of high resolution spectral libraries by Chavez et al. (1997), Murphy & Meiksin (2004), Martins et al. (2005) and Rodrigues-Merino et al (2005). However, these theoretical libraries still have a more limited wavelength coverage than that of the previous low-resolution synthetic libraries.
The choice of using either an empirical or a synthetic library in stellar population models is a subject of debate in the literature. One disadvantage of synthetic libraries is that they rely on model atmospheres, which are subject to systematic uncertainties. Besides, computing a reliable high-resolution synthetic spectral library for a large range of stellar parameters and in a wide spectral region is a very challenging task, because it requires building an extensive and reliable list of atomic and molecular line opacities which are needed for an accurate reproduction of high-resolution spectra of real stars. On the other hand, synthetic spectral libraries overcome limitations of empirical libraries, the most important being their inability to extrapolate to abundance patterns that differ from that of the library stars, which are from the solar neighbourhood or, in some cases, that of the Magellanic Clouds. Therefore, models based on empirical libraries cannot reproduce the integrated spectra of systems that have undergone star formation histories that are different from that of local systems.
The first compelling evidence that models based on empirical libraries have difficulty reproducing the integrated light of extra-galactic populations was presented by Worthey et al. (1992). These authors showed that single stellar population synthesis models for the Lick/IDS indices (Burstein et al. 1984; Worthey et al. 1994; Trager et al. 1998) cannot reproduce the indices measured in giant elliptical galaxies, thus indicating that these systems are overabundant in -elements relative to the Sun. This happens because, by construction, the abundance pattern of models based on empirical libraries is dictated by that of the library stars, which mirrors the abundance pattern of the solar neighborhood (but see discussion in Schiavon 2005). Therefore, such models are bound to follow the relation between [Fe/H] and [/Fe] that is characteristic of the solar neighborhood where [/Fe] is above solar at low metallicities and around solar in the high-metallicity regime (e.g. McWilliam 1997). As a result, the models cannot match the integrated light of metal-rich, -enhanced systems, such as giant ellipticals.
This deficiency could be in principle partially cured empirically, by including spectra of bulge stars in the spectral libraries. The population of the bulge of the Galaxy has an -enhanced abundance pattern even at high [Fe/H] (e.g. McWilliam & Rich 1994, 2004; Zoccali et al. 2004). However, their inclusion in sufficient numbers is hampered by their faintness and severe reddening, so that very few (or none) of these stars are included in empirical libraries.
For the case of the Lick/IDS indices, models accounting for variable -enhancement have been developed (e.g. Trager et al. 2000; Thomas et al. 2003a; Proctor et al. 2004; Tantalo et al. 2004; Mendes de Oliveira et al. 2005; Schiavon 2005). Even though the Lick/IDS indices have already proven their critical importance for the understanding of the stellar populations, it is crucial to develop models that can explore the huge amount of information contained in the whole spectrum, since methods fitting the entire spectrum are now feasible (Heavens et al. 2004; Panter et al. 2004).
Currently, the only way of producing models with abundance patterns that differ from that of the stars in the solar neighbourhood is through the adoption of synthetic stellar spectra. Although grids of high-resolution synthetic spectra have recently been computed, a wide grid with an -enhanced mixture is still lacking. To our knowledge, so far two grids of synthetic spectra with -enhanced mixtures were available: Barbuy et al. (2003) published a grid in the wavelength range 4600 - 5600 Å aiming at the study of the effect of -enhancement on the Lick/IDS indices Mg2, Fe5270 and Fe5335; and Zwitter et al. (2004) published a grid covering 7653 - 8747 , which is aimed to be used with the spectroscopic surveys by RAVE and GAIA (Steinmetz 2003; Katz 2004).
In this work we present for the first time a grid of synthetic spectra covering solar and -enhanced mixtures in a wide baseline. The grid is aimed at applications in stellar population synthesis, specifically to the study of old and intermediate-aged stellar populations. Thus, the grid covers the effective temperatures and surface gravities suitable for these systems.
We would like to emphasize, however, that applications of this grid are not limited to stellar population studies. The spectral library should also be a very useful tool for atmospheric parameter determination work, in particular as input in automatic procedures of deriving atmospheric parameters of a large number of observed stars (e.g. Cayrel et al. 1991a; Franchini et al. 2004; Willemsen et al. 2005; Girard & Soubiran 2005; Valenti & Fischer 2005).
This paper is organized as follows. In Section 2 we briefly describe the computation of the synthetic spectra and the production of the atomic and molecular line lists. In Section 3 the library is presented and aspects of the relative contribution of the chemical species are investigated. A Summary is given in Section 4.
2 Calculations
The spectra were computed using the code PFANT. The first version of this code named FANTOM was developed by Spite (1967) for the calculation of atomic lines. Barbuy (1982) included the calculation of molecular lines, implementing the dissociative equilibrium by Tsuji (1973) and molecular line computations as described in Cayrel et al. (1991b). It has been further improved for calculations of large wavelength coverage and inclusion of Hydrogen lines as described in Barbuy et al. (2003). Ten hydrogen lines from to are considered, through a revised version of the code presented in Praderie (1967). Higher order Balmer lines and Paschen and Brackett series are not yet considered in the present version of the code. Given a stellar model atmosphere and lists of atomic and molecular lines, the code computes a synthetic spectrum assuming local thermodynamic equilibrium.
The model atmospheres adopted were those presented by Castelli & Kurucz (2003), which account for -enhanced compositions. The solar abundances adopted are those from Grevesse & Sauval (1998), which are consistent with the abundances used in the model atmospheres. These models differ from the previous ATLAS9 grid (Kurucz 1993) mainly because they include new opacity distribution functions, new molecular opacities and do not include overshooting.
These models have mixing length to pressure scale height ratio of 2.0. A lower value () was suggested by Fuhrmann et al. (1993) and Van ’t Veer-Menneret & Mégessier (1996) as being more suitable to reproduce the profile of Balmer lines (as was adopted in the models in Barbuy et al. 2003). But it is important to note that the Balmer lines are not well reproduced also because their cores are affected by the chromosphere and by departures from local thermodynamic equilibrium.
2.1 Atomic line opacities
Accurate line opacities are in the very heart of a successful synthetic spectrum computation. The line list employed is an updated version of the one presented in Barbuy et al. (2003), where oscillator strengths (log gfs) and damping constants were revised.
The line list was extended up to 1.8m with the inclusion of the data from Meléndez & Barbuy (1999). The most recent oscillator strengths listed in the latest electronic version of the NIST database (Reader et al. 2002) were adopted. These values account for 10 to 50% of the lines in the near-UV and visible spectral regions, respectively. The log gf values of 139 Fe II lines were updated according to the normalization given in Meléndez & Barbuy (2002). Line by line fits to the solar spectrum were done in specific spectral regions, and in this process 240 lines had their log gfs selected among values from Sneden et al. (1996), Kupka et al. (1999; VALD), Biehl (1976), Steffen (1985), McWilliam & Rich (1994) and Bensby et al. (2003). Additionally, 21 hyperfine structures for the heavy elements Ba, La, Eu, Co, Pb were included, adopting a solar isotopic mix. For the hyperfine structures, a code described and made available by McWilliam (1998) is employed, as described in Allen (2005).
Accurate values for the damping constant are also important for the computation of line profiles. This is crucial for the strong lines, and it also has a non-negligible effect on weaker lines (see Ryan 1998 for a discussion).
In our atomic line list, 36% of the lines had the collisional broadening obtained from Anstee & O’Mara (1995), Barklem & O’Mara (1997), Barklem, O’Mara & Ross (1998) and Barklem et al. 2000 (this series of papers is referred to hereafter as ABO). Those lines correspond to the totality of the strong neutral lines. The other lines were either of higher ionization stages 111Cross sections for ionized lines are not easily computed (see Barklem & O’Mara 1998 and Barklem et al. 2000). The cross sections for ionized transitions presented in Barklem et al. (2000) were included in our line list. or were not in the energy domain range of the tabulated cross sections. Thus these lines were either manually fitted to the Sun or were assumed to have interaction constant .
Around 5% of the lines which had derived from ABO cross sections had to be manually fitted in order to reproduce the solar spectrum. This happened due to the dependence of the line profile both on the collisional broadening and on the model atmosphere employed. The conversion of the ABO cross sections into values are detailed in Appendix A.
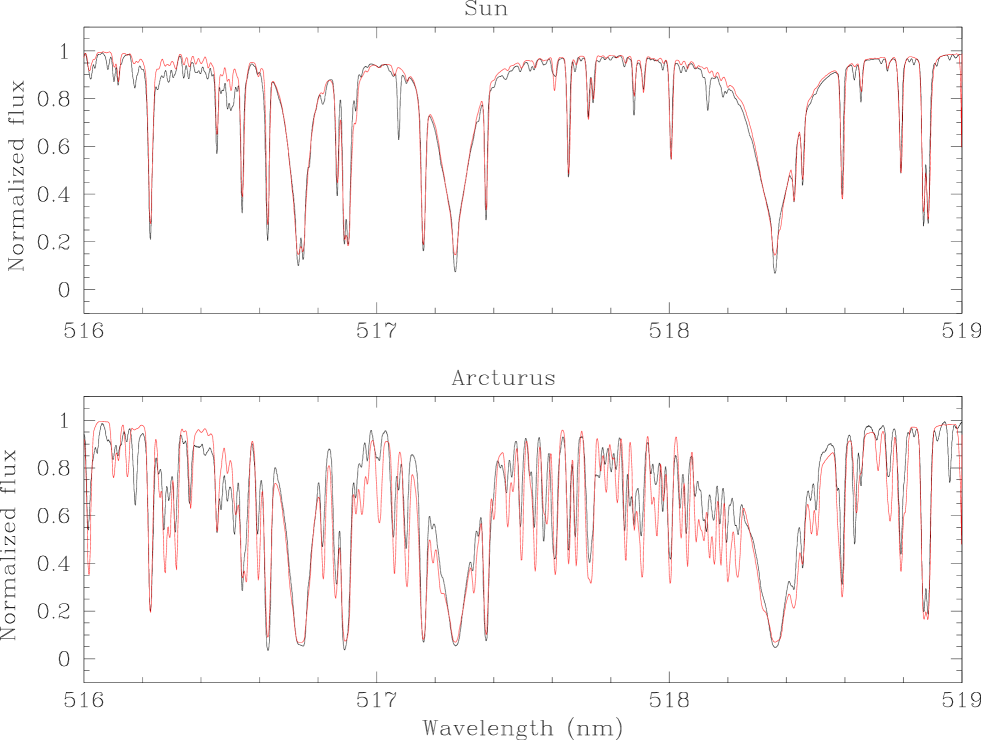
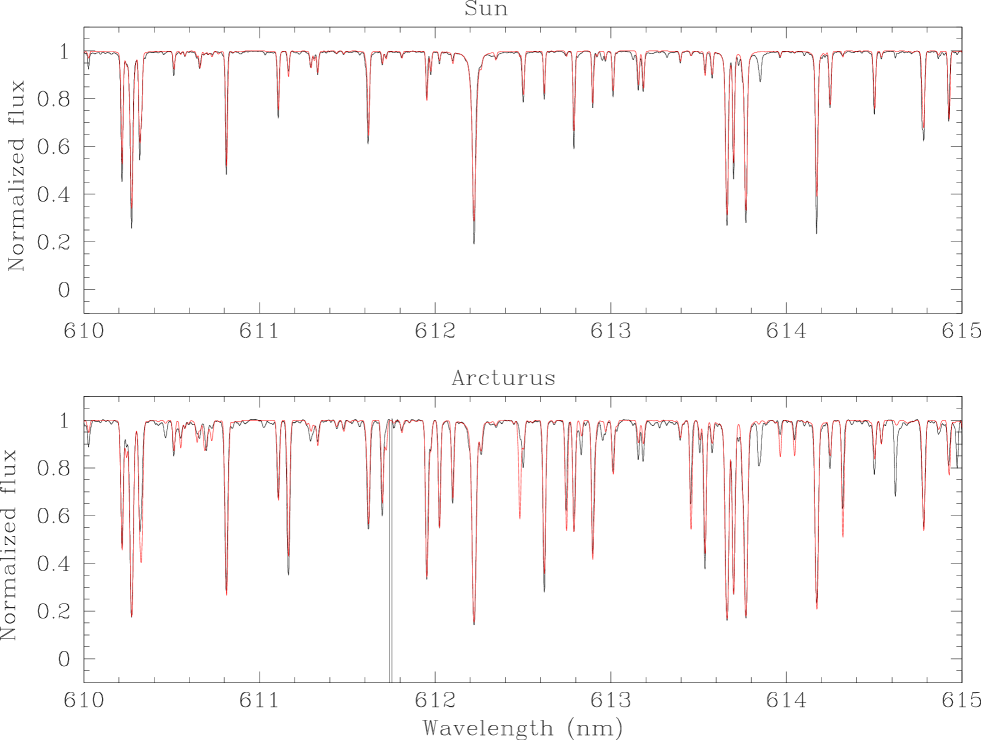
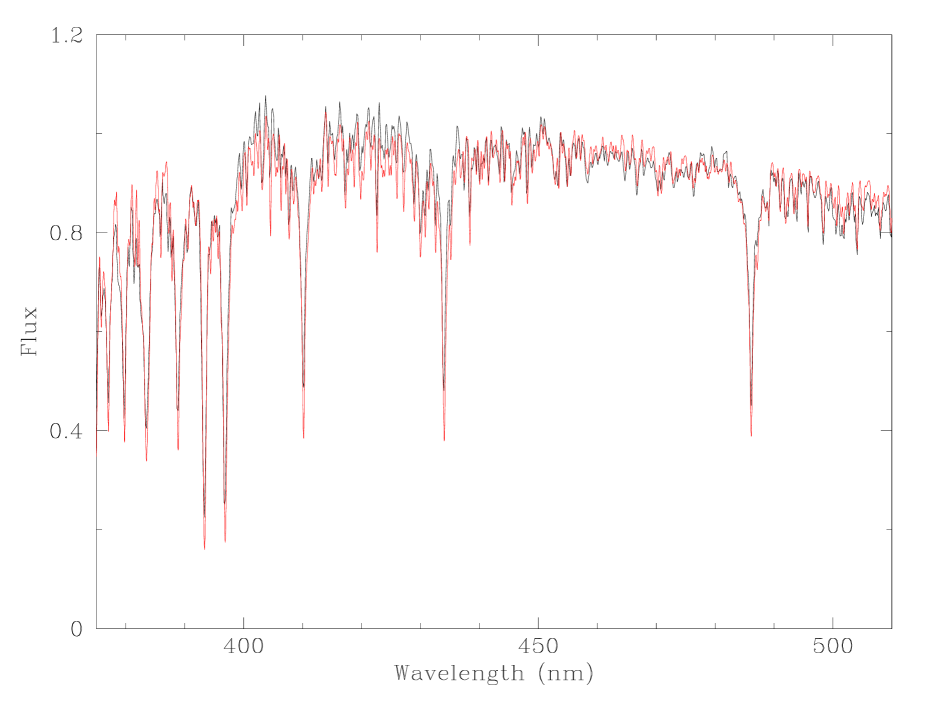
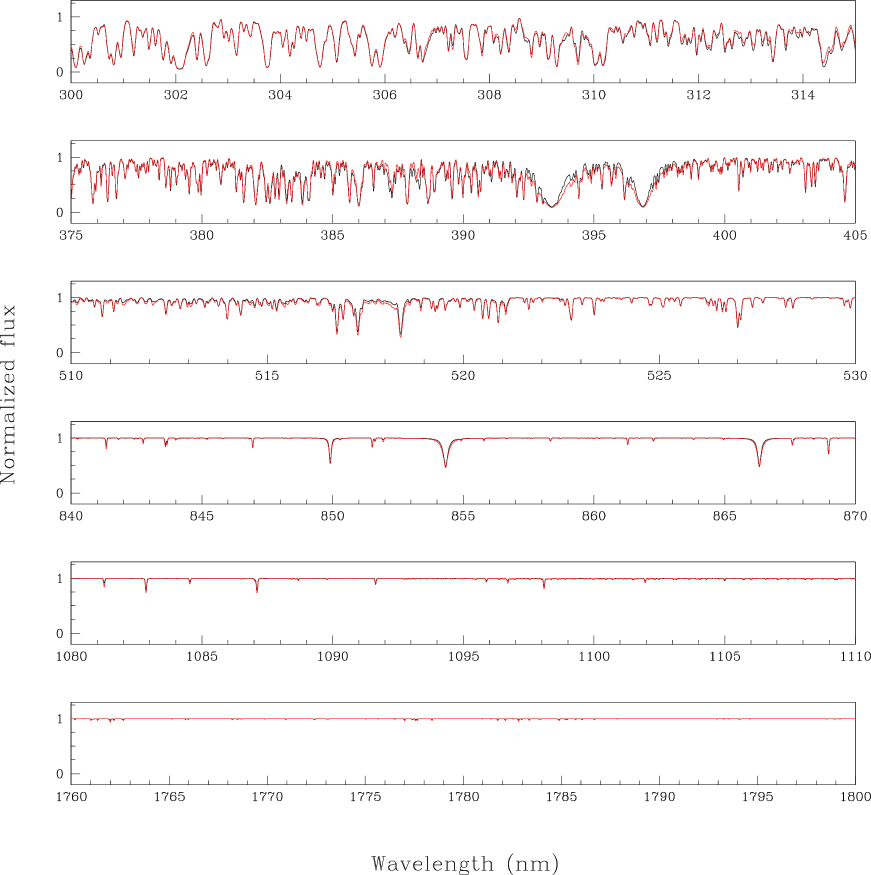
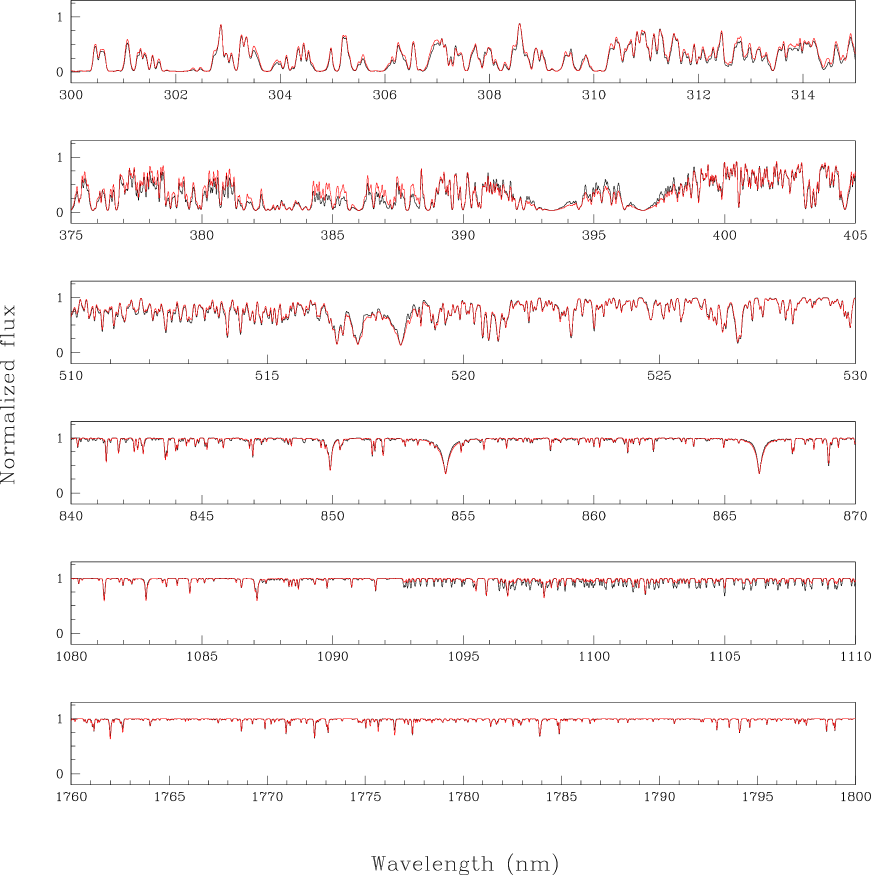
The high quality of the final line list can be assessed by comparisons with high resolution spectra of the Sun (Kurucz et al. 1984) and Arcturus (Hinkle et al. 2000). The resolution of these spectra are of the order R , thus allowing a thorough verification of the accuracy of our wavelengths, oscillator strengths and damping constants. In Figures 1 and 2, comparisons of our synthetic spectra to those of the Sun and Arcturus are shown in two spectral regions. For the Sun the synthetic spectrum was computed adopting Teff = 5770K, log g = 4.44, microturbulent velocity vt = 1.0 km/s and abundances from Grevesse & Sauval (1998). For Arcturus the parameters adopted were Teff = 4275 K, log g = 1.55 and vt = 1.65 km/s (Meléndez et al. 2003). An ATLAS9 model atmosphere with these parameters was kindly computed by F. Castelli (private comunication). For the abundances, we adopted [Fe/H] = -0.54, [C/Fe] = -0.08, [N/Fe] = +0.30, [O/Fe] = 0.43 and [Ni/Fe] = +0.02 from Meléndez et al. (2003), [Mg/Fe] = +0.30 and [Ca/Fe] = +0.17 from McWilliam & Rich (1994).
In both figures the Sun is very well reproduced. For the case of Arcturus, the synthetic spectrum looks somewhat strong-lined. At such a high resolution, small errors in the atmospheric parameters can easily account for this difference, and the overall agreement is very good.
When comparing synthetic spectrum against observed spectrum, one also has to be aware that observed spectra taken through the atmosphere include telluric lines, whereas computed spectra do not. A crucial aspect of our procedure is the derivation of reliable oscillator strengths from comparison with ground-based observations of the Sun and Arcturus, as explained in Barbuy et al. (2003). This however is not feasible in regions of the spectra which are heavily contaminated by telluric lines. For that reason, there is a gap in the line list between 1.35 and 1.50 m - where the telluric absorption is severe - since we refrained from adopting lines with purely theoretical log gfs in that region.
2.2 Molecular line opacities
Molecular lines are an important source of opacity in the atmospheres of late-type stars. Molecular bands in fact dictate the overall shape of the spectra of late-K and M stars, which are the dominant contributors to the integrated light of old and intermediate-age stellar populations longward of 650 nm. Therefore, it is crucial to model their intensities correctly if one wants to make accurate predictions in these spectral regions. The molecules considered in the calculation of the present library are listed in Table 1.
The line list for the molecules MgH, C2 and CN-red were adopted from Balfour & Cartwright (1976), Phillips & Davis (1968) and Davis & Philips (1963), respectively. For the CN-blue, NH and OH-blue systems, the line lists by Kurucz (1993) were adopted, as implemented in Castilho et al. (1999). For the CH blue systems, the LIFBASE program of Luque & Crosley (1999) was used. The OH vibration-rotation line list is the one implemented in Meléndez, Barbuy & Spite (2001). It is based on the laboratory work of Abrams et al. (1994), complemented with the theoretical line list by Goldman et al. (1998). The molecular gf-values of the OH lines was obtained from the Einstein coefficients calculated by Goldman et al. (1998). The CN and CO infrared line lists were implemented in Meléndez & Barbuy (1999). The CO lines are from the theoretical work of Goorvitch (1994) and the infrared CN lines are from S. P. Davis, based on the analyses by M. L. P. Rao (S. P. Davis, private communication). The FeH (A-X) line list of rotational lines were adopted from Philips et al. (1987) as described in Schiavon et al. (1999). The dissociation potential values adopted for all molecules are reported in Table 1, together with corresponding sources.
The line list for the TiO system was adopted from the theoretical work by Jorgensen (1994). The electronic oscillator strength was calibrated to the intensity of the laboratory line list used in Erdelyi-Mendes & Barbuy (1989). For the remaining TiO electronic systems, the list by Plez (1998) was adopted. The Plez line list contains several million lines which makes the computations extremely time-consuming so that we decided to eliminate very weak lines in order to speed up our calculations. Therefore, we include only the lines which satisfy simultaneously the following set of conditions: log gf -4.0, J” 120, and , 9, where J” is the rotational quantum number of the lower level of the transition and , and are the vibrational quantum numbers of the upper and lower levels of the transition. These values were chosen after several tests were performed in order to make sure that removal of lines not satisfying these criteria would have a negligible impact on our computations.
| Molecule | System | Number | Wavelength | Number of | Dissociation potencial (ref) | |
|---|---|---|---|---|---|---|
| of lines | coverage (nm) | vibrational bands | D∘ (eV) | |||
| MgH | AX | 1945 | 404 - 609 | 13 | 1.34 (1) | |
| C2 Swan | AX | 11254 | 429 - 676 | 35 | 6.21 (1) | |
| CN blue | BX | 92851 | 300 - 600 | 197 | 7.72 (2) | |
| CN red | AX | 23828 | 404 - 2714 | 74 | ” | |
| CH AX | AX | 10137 | 321 - 786 | 20 | 3.46 (1) | |
| CH BX | BX | 2016 | 361 - 682 | 10 | ” | |
| CH CX | CX | 2829 | 270 - 424 | 12 | ” | |
| CO nir | X | 7088 | 1578 - 5701 | 63 | 11.09 (1) | |
| NH blue | AX | 8599 | 300 - 600 | 55 | 3.47 (1) | |
| OH blue | AX | 6018 | 300 - 540 | 46 | 4.39 (1) | |
| OH nir | X | 2028 | 746 - 2594 | 43 | ” | |
| FeH | AX | 2705 | 778 - 1634 | 9 | 1.63 (3) | |
| TiO | A-X | 26007 | 622 - 878 | 23 | 6.87 (1) | |
| TiO ’ | BX | 219367 | 501 - 915 | 81 | ” | |
| TiO | CX | 360725 | 380 - 861 | 79 | ” | |
| TiO | ca | 91804 | 431 - 804 | 63 | ” | |
| TiO | ba | 189019 | 622 - 1480 | 66 | ” | |
| TiO | EX | 253755 | 641 - 1341 | 61 | ” | |
| TiO | bd | 105082 | 665 - 1780 | 65 | ” |
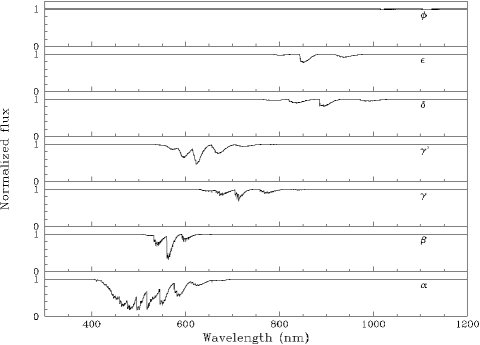
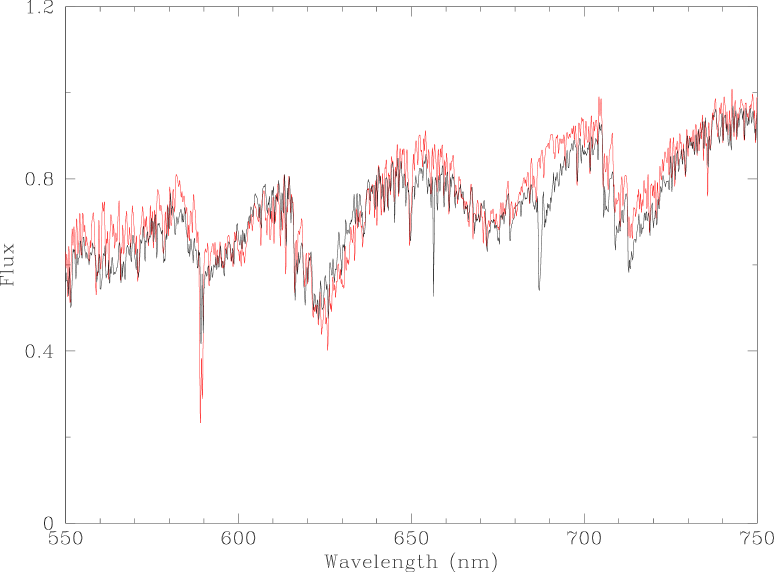
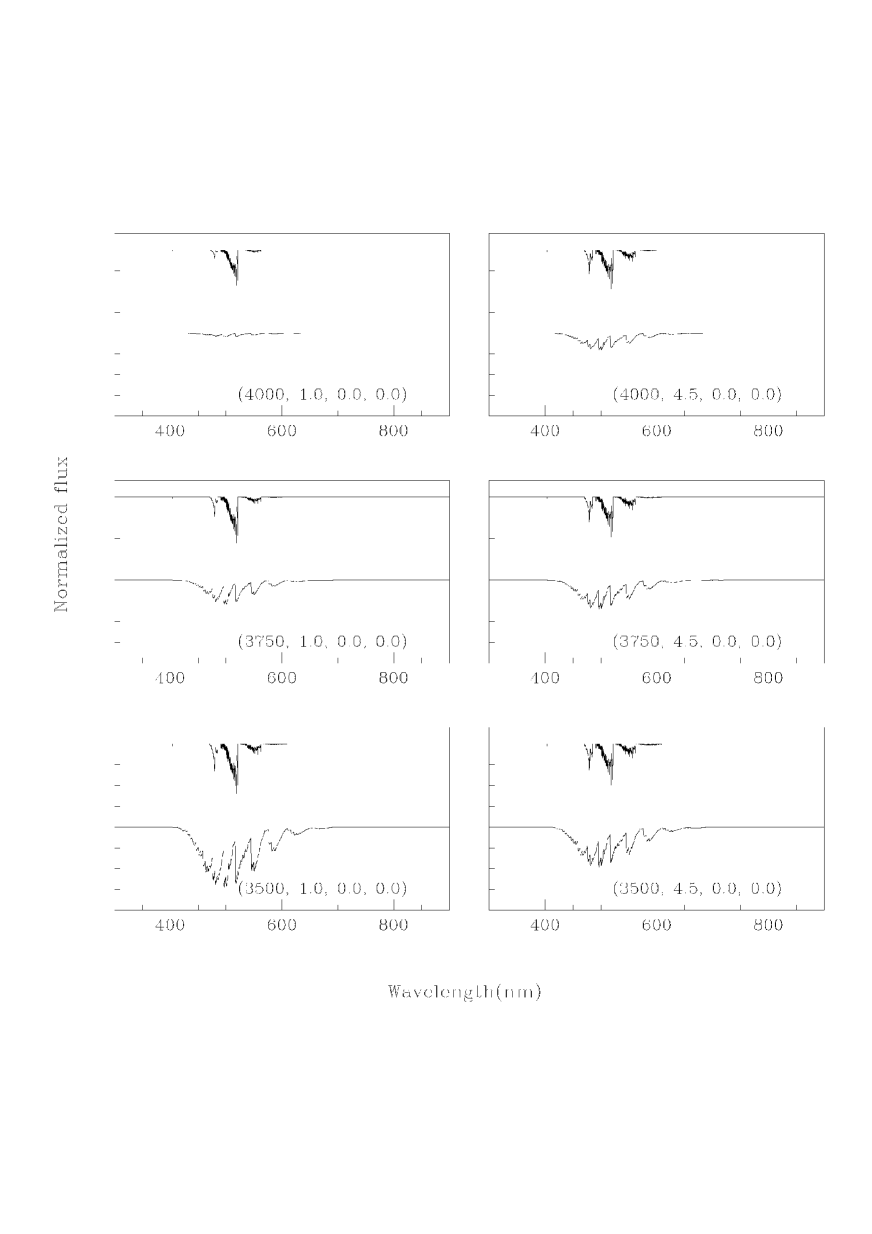
The electronic oscillator strengths (fel) for the TiO systems were obtained empirically by matching band strengths in spectra of observed cool stars with our synthetic spectra. For this purpose, cool giants covering the effective temperature range 3000 Teff 3800 K were selected from the STELIB and Indo-US libraries. In this temperature range, TiO bands dominate the line opacity in the visible region of the spectra of M giants. Because the model atmospheres by Castelli & Kurucz (2003) do not go below Teff = 3500K, we employed MARCS model atmospheres from Plez et al. (1992) to calibrate these fel.
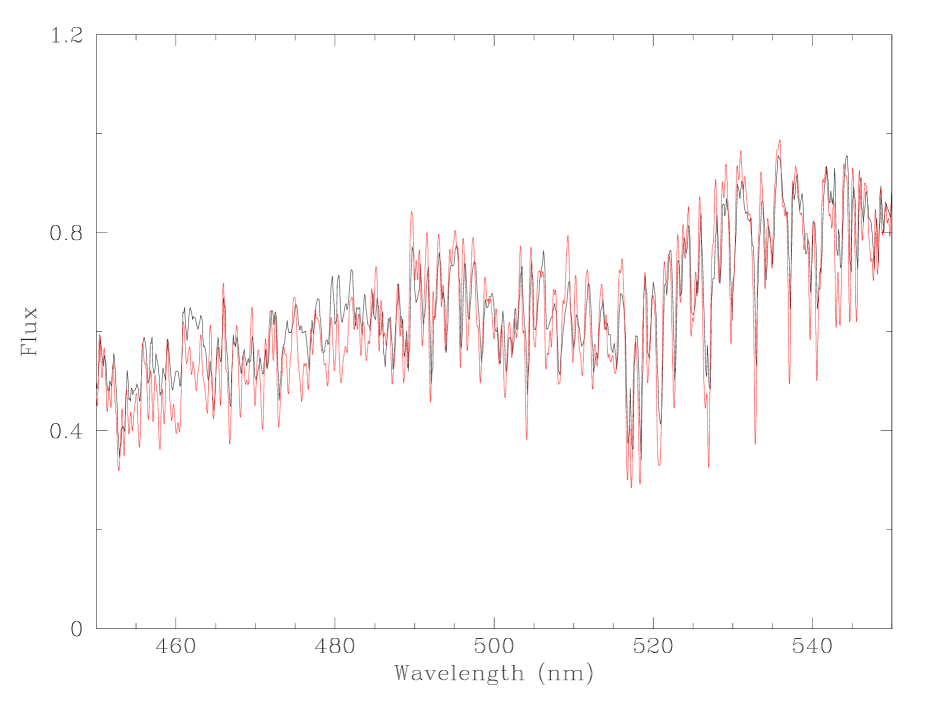
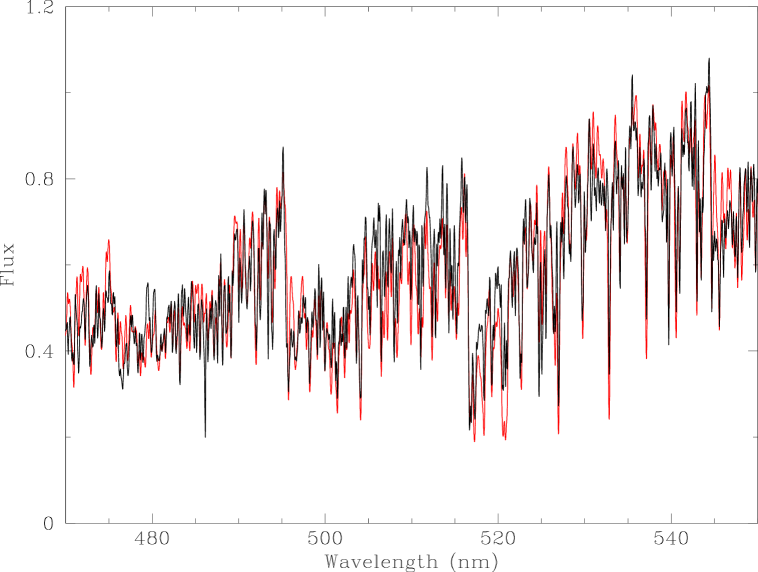
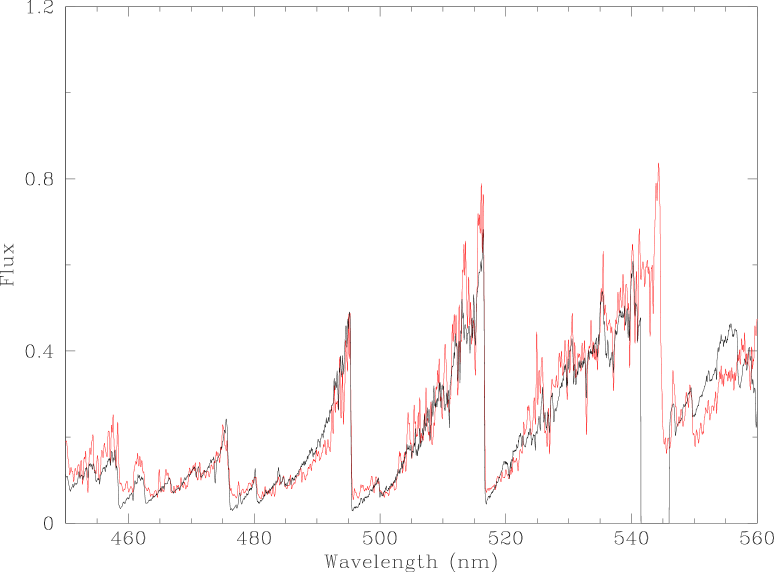
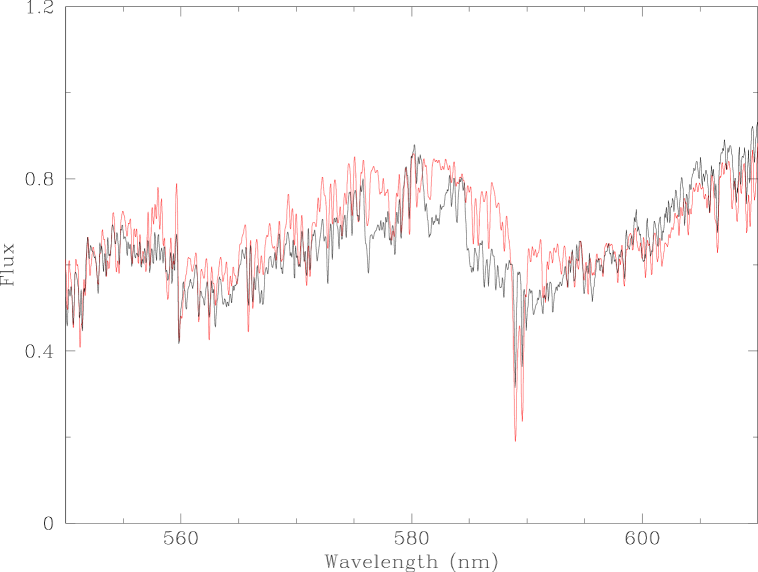
In Figure 3 the relative contribution of each of the TiO systems, calculated for a cool giant, is presented. Some comparisons between empirically calibrated TiO-dominated synthetic spectra to the spectra of some observed stars are presented in Figures 4 to 7. Moreover, the comparison to the spectra of an F dwarf and a K giant are presented in Figures 8 and 9 respectively. The wavelength range plotted in the later two figures were chosen to illustrate the spectral region where those spectral types dominate the flux of integrated population spectra. The synthetic spectra shown in these figures are the ones whose atmospheric parameters are the closest to those of the observed stars, as given in the respective library (STELIB or Indo-US).
3 Library of synthetic spectra
Given the atomic and molecular line lists described in the previous section, a library of synthetic spectra was computed from 3000 Å to 1.8 m, in steps of 0.02. The model atmosphere grid is available for microturbulent velocities vt = 2 km/s, but the synthetic spectra were calculated with values more representatives of observed stars as given below:
-
•
vt = 1.0 km s-1 for log 3.0;
-
•
vt = 1.8 km s-1 for 1.5 log 2.5, and;
-
•
vt = 2.5 km s-1 for log 1.0.
The output of the synthesis code is normalized flux. In order to produce spectra in an absolute flux scale, the normalized high-resolution spectra were multiplied by the true continuum given directly by the ATLAS9 model atmosphere. The library is presented in both normalized and absolute flux formats, and each spectrum is stored in a FITS file consisting of two apertures (multispec IRAF format), where aperture number 1 is the normalized spectrum and aperture number 2 is an absolute flux spectrum. The spectral library is available upon request.
3.1 Coverage in Stellar Parameter Space
The main grid covers the following parameters:
-
•
Effective temperatures: 3500 Teff 7000 K in steps of 250K
-
•
Surface gravities: 0.0 log g 5.0 in steps of 0.5
-
•
Metallicities: = -2.5, -2.0, -1.5, -1.0, -0.5, 0.0, 0.2 and 0.5
-
•
Chemical compositions: = 0.0 and 0.4, where the -elements considered are O, Ne, Mg, Si, S, Ca and Ti.
It is not well established yet whether titanium is associated to the synthesis of the -elements or to the iron-peak elements (Timmes et al. 1995). Nevertheless, it has been shown that its abundance follows the same pattern as that of -elements for several types of populations (e.g. McWilliam & Rich 1994; Pompéia et al. 2003), and thus we decided to include this element in the -enhanced group.
Concerning calcium, observations of halo and disk Galactic stars show that [Ca/Fe] follows closely the behaviour of other -elements as a function of [Fe/H] (McWilliam & Rich 1994; Edvardsson et al. 1993). In the bulge of our galaxy, however, some high-resolution analyses show that [Ca/Fe] seems to be close to solar (e.g. Zoccali et al. 2004). From lower resolution studies, there is evidence as well that [Ca/Fe] is not enhanced in elliptical galaxies (e.g. Thomas et al. 2003b), although Prochaska, Rose & Schiavon (2005) showed that the calcium abundance derived from the Ca4227 index is dependent on the index-measuring strategy.

Considering the application of this grid to the study of old and metal-rich stellar populations, a subsample of the -enhanced main grid was also computed with [Ca/Fe] = 0.0, for [Fe/H] = -0.5, 0.0, 0.2 and 0.5. The sets of Teff and log g for these latter computations were chosen amongst those that are relevant for old stellar populations at these metallicities, for ages between 8 and 13 Gyr. Bertelli et al. (1994) isochrones were used to guide our selection. Some of these isochrones are presented in Figure 10 as well as the (Teff, log g) pairs computed for this extension of the library.
High resolution synthetic spectra computed for a cool giant with solar-scaled and -enhanced abundance patterns are compared in 11 and 12, for the metal-poor and metal-rich cases, respectively. As expected, well known indicators of abundances of -elements, such as the Mg triplet lines at 517 nm, the MgH band at 518 nm and the Ca triplet in the far red, are stronger in the -enhanced spectra. We note however other lines which are very sensitive to -enhancement and yet are virtually unexplored in stellar populations work (e.g. the Ca H & K lines and the lines due to the CN molecule, at 1093 nm). We also note that some lines are visibly weaker in the -enhanced case (e.g. the region around 385 nm in Figure 12). This cannot be attributed to individual abundance variations of the non- elements, because those abundances are the same as in the solar scaled case. The decrease of the intensity of some lines can be explained because the -elements, specially Mg, are electron donors and thus contribute in an important way to the continuum opacity. Because the spectra shown in Figures 11 and 12 are normalized, the net effect is that some lines in the -enhanced case look weaker due to enhanced continuum opacity, even when the individual abundances corresponding to those lines are unchanged.
3.2 The relative contribution of different chemical species to the total line opacity
A great advantange of synthetic spectra over observed spectra, is that with spectral synthesis it is possible to disentangle the relative contribution of different chemical species to the line spectrum, which allows the study of line indices in a more careful way. For example, it is possible to evaluate the presence of blends or the range of applicability of a given line indice.
As an example, the well-known Lick indices Mg1, Mg2 and Mgb measure the intensity of the MgI triplet lines (5167.327, 5172.698 and 5183.619 ) together with MgH, C2 and TiO bands, besides other atomic lines. These indices measure essentially MgI and MgH in K giants and in the integrated light of galaxies. However, it should be noted that in stars cooler than 3750 K, bands from the system of TiO become stronger than MgH, as can be seen in Figure 13. It is clear that for very metal-rich stars at the tip of the red giant branch and galaxies containing such stars these indices are substantially affected by TiO bands, which makes their interpretation somewhat more complicated (see also Schiavon 2005).
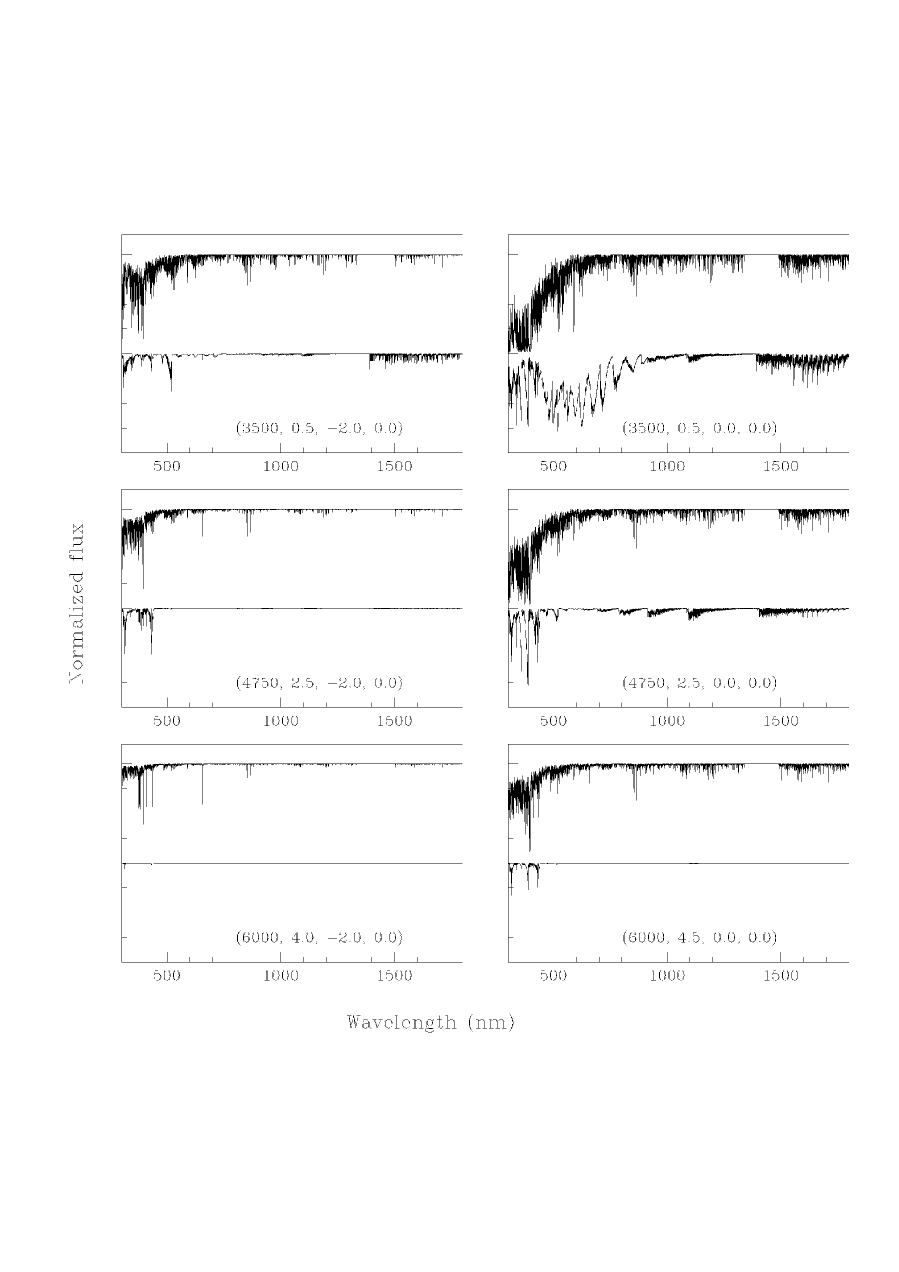
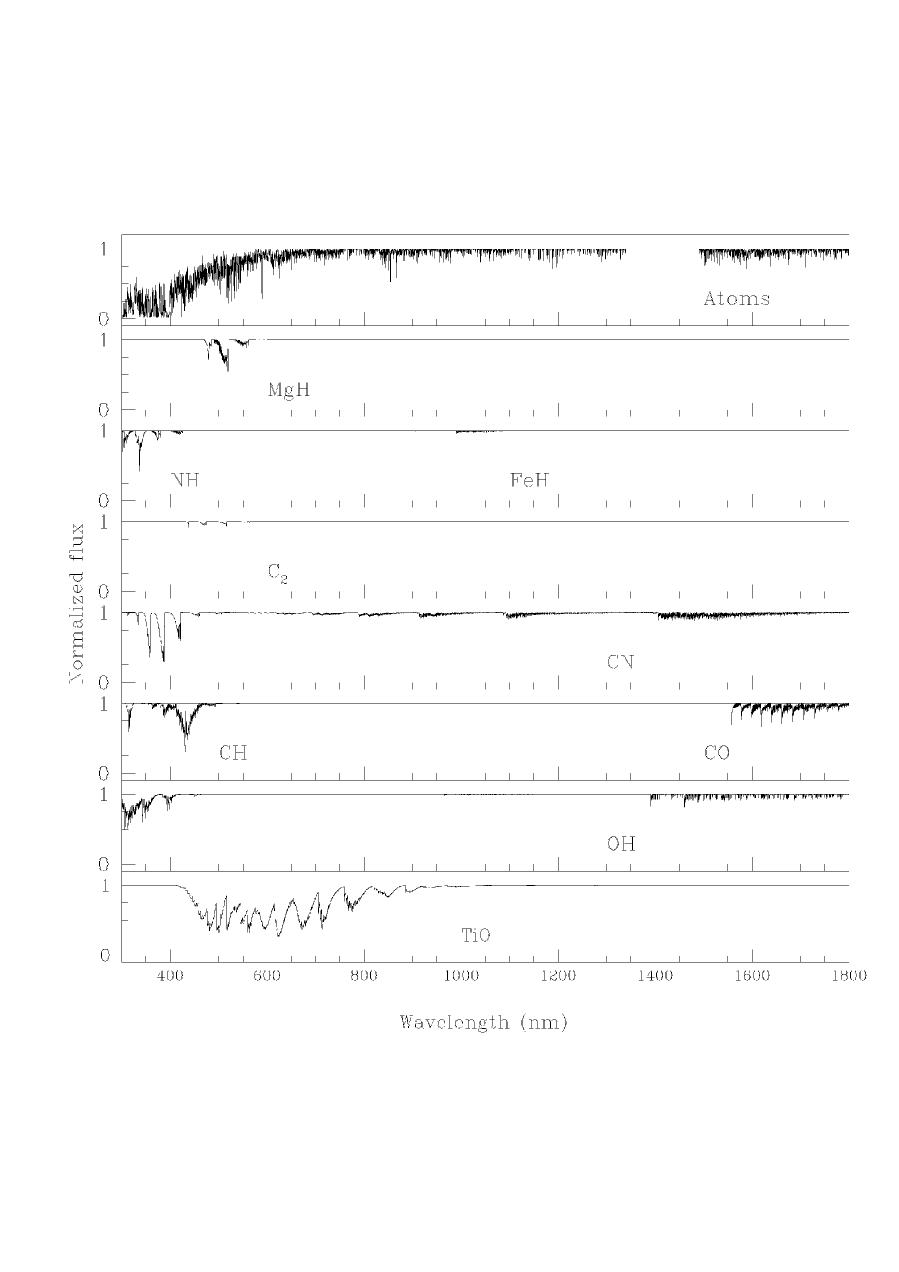
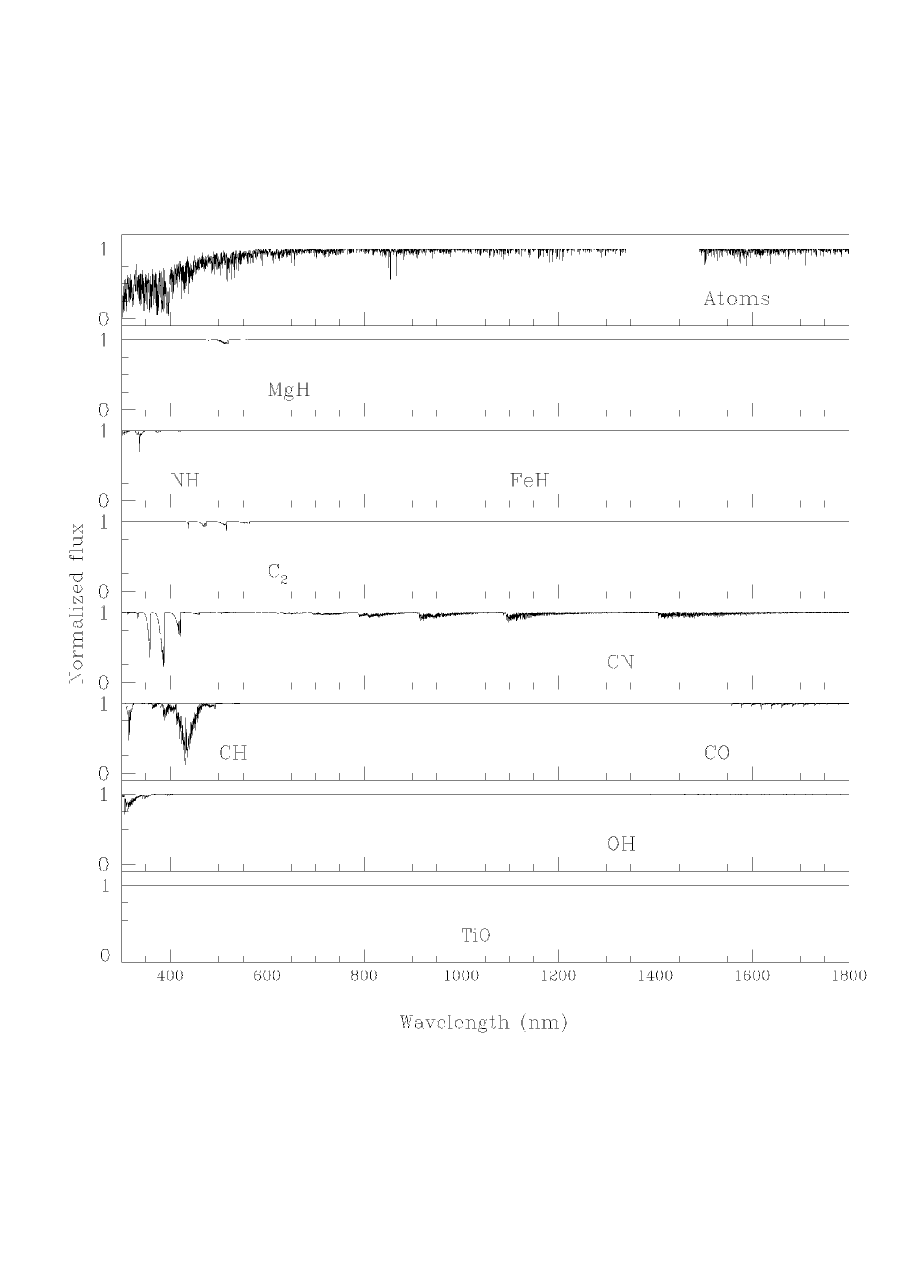
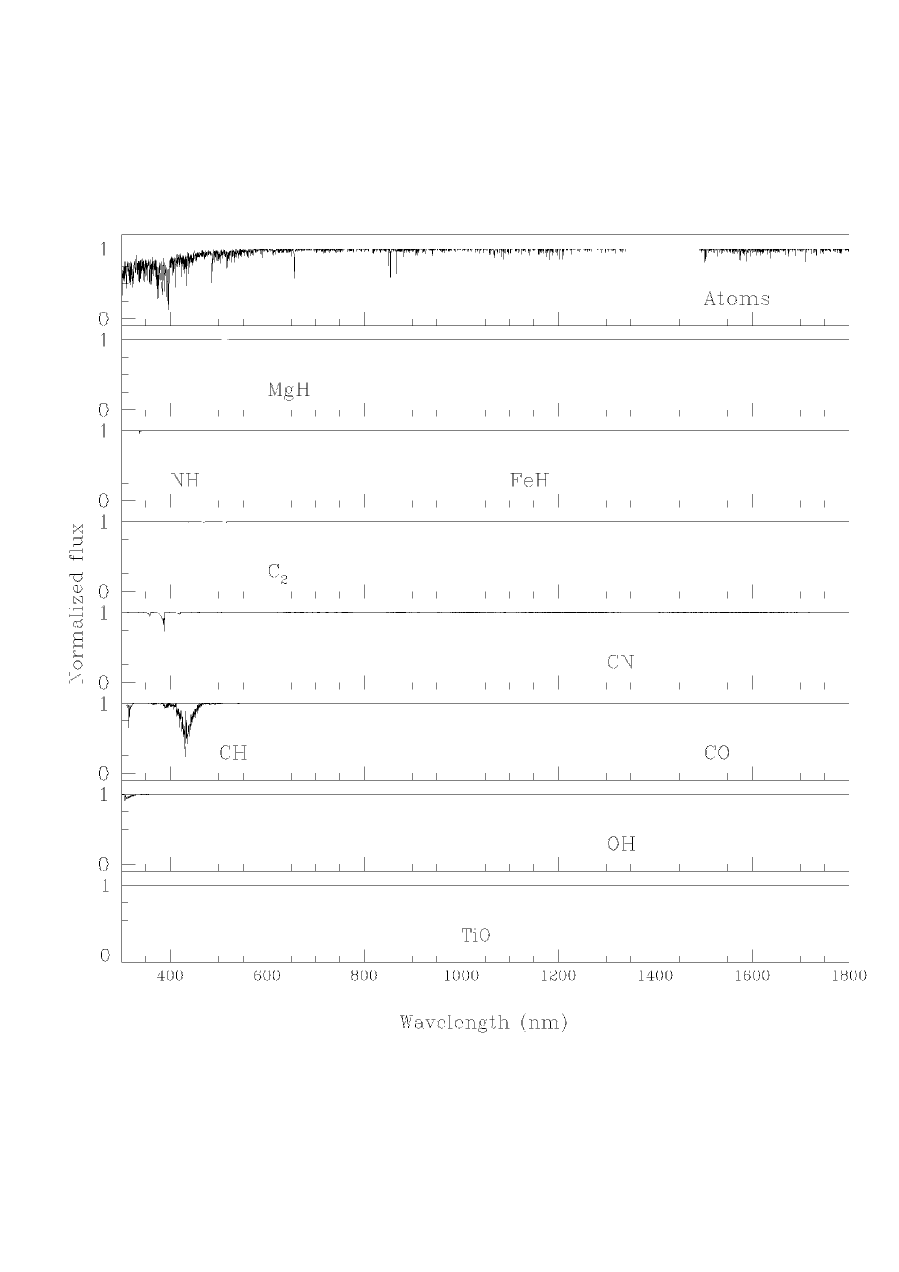
The separate contribution of atoms and molecules is shown in Figure 14 for the parameters (Teff, log g) = (3500, 0.5), (4750, 2.5) and (6000, 4.0) for [Fe/H] = -2.0 and 0.0 ([/Fe] = 0.0). In order to illustrate the contribution of atoms and each diatomic molecule, we computed each molecule separately. The results are shown in Figures 15 - 17, where the impact of each molecule on the line spectrum can be evaluated.
4 Summary
A library of synthetic stellar spectra is presented. This library was computed with a sampling 0.02Å and for the parameters: effective temperatures 3500 Teff 7000 K, surface gravities 0.0 log g 5.0, metallicities -2.5 [Fe/H] +0.5, and -elements over Fe ratio [/Fe] = 0.0 and 0.4. For the metallicites [Fe/H] -0.5, two -enhanced grids are available, with and without Ca in the enhanced group.
For the computation of this grid, an atomic line list was implemented based on the previous lists of Barbuy et al. (2003) and Meléndez & Barbuy (1999). The log gf values were updated to the most recent NIST values, and damping constants were calculated for the totality of strong lines following ABO papers.
The molecular line opacities include the molecules MgH, C2, CN, CH, CO, OH, NH, FeH and TiO. The TiO systems, which dominate the opacity of cool stars in the visible wavelength range, were calibrated by comparison with observed stars in the empirical libraries STELIB and Indo-US.
This high-resolution stellar synthetic library covers simultaneosly a wide wavelength range, and -enhanced chemical compositions. The -enhancement in particular is indispensable to the reproduction of the integrated properties of old stellar populations, for all metallicities regimes. This library is a valuable and powerfull tool for the study of stellar populations, and can be used to model old metal-rich stellar populations with unprecedented accuracy.
Note added after acceptance: We would like to mention that by the time of the acceptance of our paper, two recent libraries including variable -enhancement came to our knowledge, Munari et al. (2005) and Brott & Hauschild (2005).
Acknowledgements.
We are grateful to the referee Robert Kurucz for his comments, Roger Cayrel for valuable discussions on collisional broadening, and Dinah M. Allen for the heavy-elements line list. PC acknowledges: a Fapesp PhD fellowship n∘ 2000/05237-9; the Latin American-European Network on Astrophysics and Cosmology (LENAC) of the European Union’s ALFA Programme; and Fiorella Castelli, for the help with the ATLAS model atmospheres. BB acknowledges partial financial support from CNPq and Fapesp. R.P.S. acknowledges financial support from HST Treasury Program grant GO-09455.05-A to the University of Virginia.Appendix A Calculation of collisional broadening

The main source of collisional broadening for metallic lines in stars of spectral types between F and M is collisions with neutral hydrogen. The spectral synthesis code evaluates for each atmospheric layer given the interaction constant :
| (1) |
where is the relative velocity between the colliding particles and is the density of Hydrogen atoms. The parameter (or any other parameter related to the damping width) is accurately known only for very few lines. The Unsold (1955, see also Gray 1976) approximation allows one to straightforwardly estimate the damping constants, but it has long been recognized that it underestimates the collisional broadening, and thus empirical enhancement factors are applied to in order to reproduce the observed line profiles.
The works by O‘Mara (1976) and Anstee & O’Mara (1991) developed an alternative theory for the computation of cross sections of atomic transitions, thus providing a more accurate way to evaluate . Anstee & O’Mara (1995), Barklem & O’Mara (1997) and Barklem, O’Mara & Ross (1998) published cross sections for a wide range of s-p and p-s, p-d and d-p, d-f and f-d transitions, respectively. Herefrom, we refer to these cross-sections as ABO.
In order to use the more precise ABO theory in our calculations, we had to relate the ABO cross section to the classical interaction constant which is the input value to our spectrum synthesis code. The interaction constant can be expressed by:
| (2) |
where and are the mean-square radii of the upper and lower states of the transition in atomic units. The cross section from the van der Waals theory is given by:
| (3) |
From equations 2 and 3, and replacing the classical cross-section by the cross-section given by ABO theory , we obtain the relation:
| (4) |
Or in terms of :
| (5) |
The expression in Eq. 1 leads to a relationship. However, according to the theory developed by ABO, which is based on the formalism by Brueckner (1971), has a dependence on the temperature that varies between and . The ABO papers tabulate the velocity exponents that take into account this non-universal dependence. Due to the different formalisms used by ABO theory and by the spectral synthesis code, the dependences of on temperature are somewhat different. Nevertheless, the error introduced in the computed line profile is negligible ( 5%) given other sources of errors like uncertainties in the atmospheric parameters, model atmospheres and NLTE effects.
The values were obtained primarily from Barklem et al. (2000). Cross sections for lines not included in Barklem et al. (2000) were calculated through the code presented in Barklem, O’Mara & Ross (1998). For this purpose, the energy levels and orbital angular momentum quantum numbers for each transition were obtained from the line list of Kurucz (1993), available at the web address http://kurucz.harvard.edu/linelists. The ionization limits of the transitions were approximated by the first ionization potential of the atom. Although this approximation is not strictly accurate, as pointed out in Barklem et al. (2000), the detailed inclusion of the ionization limits of each transition is beyond the scope of the present work.
A further step in critically evaluating the damping widths of the strongest lines is to take into account the model atmosphere adopted. This effect is illustrated for the Ca line 6162Å in Figure 18. Cross sections for three lines of Ca I ( = 6102, 6122, 6162) have been accurately calculated by Spielfiedel et al (1991). The ratios for these lines are (0.8, 1.05, 0.96), which indicates good agreement. In Figure 18 is shown the solar spectrum (solid line), a synthetic spectrum calculated using the solar model atmosphere by Holweger & Muller (1974, HM74, filled circles), and another synthetic spectrum calculated with ATLAS9 models (open circles). The employed is the one directly obtained from equation 4, using the same parameters as given in Anstee & O‘Mara (1995), Table 3.
It can be seen that the line profile computed with the ATLAS9 model is stronger than when the HM74 model is used. The use of a MARCS model atmosphere (Plez et al. 1992) results in a line profile that is very similar to that obtained when the ATLAS9 model is employed.
The computed line profile depends on both the damping constant and the model atmosphere. Hence, even employing perfect damping parameters does not guarantee that correct profiles are computed, since the synthetic profile also depends on the adopted model atmosphere, as already pointed out by Cayrel et al. (1996) and Barbuy et al. (2003), and as is clearly shown in Fig. A1.
As a result, 5% of the lines for which the broadening values were calculated through ABO theory have too strong wings when compared with the observed spectrum of the Sun, when calculated with an ATLAS9 model. Therefore, the values for these lines were fitted manually to the solar spectrum. It was found that the average (ABO)/(best fit) for those lines is 1.4. Cayrel & Van’t Veer (private communication) performed similar tests for the Mg I triplet lines, and found that (ABO)/(best fit) 1.5, which is in remarkable agreement with our own results.
The wings of the weaker lines are not critically affected by the use of different model atmospheres (as can be seen for the two weaker lines in Figure 18). This implies that for 95% of the lines, the broadening predicted by ABO theory fits well the solar spectrum when ATLAS9 models are employed.
References
- (1) Abrams, M. C., Davis, S. P., Rao, M. L. P., Engleman, R., Jr., 1994, ApJS, 93, 351
- (2) Allard, F. & Hauschildt, P.H. 1995, ApJ, 445, 433
- (3) Allen, D. M., 2005, PhD Thesis, Univ. de São Paulo
- (4) Anstee, S.D., O’Mara, B.J., 1991, MNRAS, 253, 549
- (5) Anstee, S.D., O’Mara, B.J., 1995, MNRAS, 276, 859
- (6) Barbuy, B. 1982, PhD Thesis, Université de Paris VII
- (7) Barbuy, B., Perrin, M.-N., Katz, D., Coelho, P., Cayrel, R., Spite, M., Van’t Veer-Menneret, C., 2003, A&A, 404, 661
- (8) Balfour, W. J., Cartwright, H. M., 1976, A&AS, 26, 389
- (9) Barklem, P.S., O’Mara, B.J. 1997, MNRAS, 290, 102
- (10) Barklem, P.S., O’Mara, B. J., 1998, MNRAS, 300, 863
- (11) Barklem, P.S., O’Mara, B.J., Ross, J.E. 1998, MNRAS, 296, 1057
- (12) Barklem, P. S., Piskunov, N., O’Mara, B. J., 2000, A&AS, 142, 467
- (13) Bell, R. A., Dwivedi, P. H., Branch, D., Huffaker, J. N., 1979, ApJS, 41, 593
- (14) Bensby, T., Feltzing, S., Lundstrom, I., 2003,A&A, 410, 527
- (15) Bertelli, G., Bressan, A., Chiosi, C., Fagotto, F., Nasi, E., 1994, A&AS, 106, 275
- (16) Bessell, M. S., 1991, A&AS, 89, 335.
- (17) Bessell, M. S., Brett, J. M., Wood, P. R., Scholz, M., 1989, A&AS, 77, 1
- (18) Biehl, D., 1976, PhD thesis, Univ. Kiel
- (19) Brott, I., Hauschildt, P.H., 2005, in The Three Dimensional Universe with Gaia, M.A.C. Perryman and C. Turon eds., ESA SP-576, 565
- (20) Bruecknerm K., 1971, ApJ, 169, 621
- (21) Bruzual, A. G., Charlot, S., 1993, ApJ, 405, 538
- (22) Bruzual, A. G., Charlot, S., 2003, MNRAS, 344, 1000
- (23) Burstein, D., Faber, S.M., Gaskell, C.M., Krumm, N., 1984, ApJ, 287, 56
- (24) Buzzoni, A., 2002, AJ, 123, 1188
- (25) Castelli, F., Kurucz, R. L., 2003, Proceedings of the 210th Symposium of the International Astronomical Union held at Uppsala University, Uppsala, Sweden, 17-21 June, 2002. Edited by N. Piskunov, W.W. Weiss, and D.F. Gray. Published on behalf of the IAU by the Astronomical Society of the Pacific, 2003., p.A20
- (26) Castilho, B.V., Spite, F., Barbuy, B., Spite, M., de Medeiros, J.R., Gregorio Hetem, J. 1999, A&A, 345, 249
- (27) Cayrel, R., Perrin, M.-N., Barbuy, B., Buser, R., 1991b, A&A, 247, 108
- (28) Cayrel, R., Perrin, M. N., Buser, R., Barbuy, B., Coupry, M. F., 1991a, A&A, 247, 122
- (29) Cayrel, R., Faurobert-Scholl, M., Feautrier, N., Spielfieldel, A., Thevenin, F., 1996, A&A, 312, 549
- (30) Cerviño, M., Mas-Hesse, J., 1994, A&A, 284, 749
- (31) Chavez, K., Malagnini, M. L., Morossi, C. 1997, A&AS, 126, 267
- (32) Davis, S. P., Phillips, J. G., 1963, Berkeley Analyses of Molecular Spectra, Berkeley: University of California Press
- (33) Delgado, R. M. González, Cervi o, M., Martins, L. P., Leitherer, C., Hauschildt, P. H., 2005, MNRAS, 357, 945
- (34) Erdelyi-Mendes, M., Barbuy, B., 1989, A&AS, 80, 229
- (35) Edvardsson, B., Andersen, J., Gustafsson, B., Lambert, D. L., Nissen, P. E., Tomkin, J., 1993, A&A, 275, 101
- (36) Fioc, K., Rocca-Volmerange, B., 1997, A&A, 326, 950
- (37) Fluks, M. A., Plez, B., The, P. S., de Winter, D., Westerlund, B. E., Steenman, H. C., 1994, A&AS, 105, 311
- (38) Franchini, M., Morossi, C., Di Marcantonio, P., Malagnini, M. L., Chavez, M., Rodriguez-Merino, L., 2004, ApJ, 601, 485
- (39) Fuhrmann, K., Axer, M., Gehren, T. 1993, A&A, 271, 451
- (40) Girard, P., Soubiran, C., 2005, Proceedings of the Gaia Symposium ”The Three-Dimensional Universe with Gaia” (ESA SP-576). Held at the Observatoire de Paris-Meudon, 4-7 October 2004. Editors: C. Turon, K.S. O’Flaherty, M.A.C. Perryman, p. 169
- (41) Goldman, A., Shoenfeld, W. G., Goorvitch, D., Chackerian C. Jr., Dothe, H., Mélen, F., Abrams, M. C., Selby, J. E. A. 1998, JQSRT, 59, 453
- (42) Gray, D., 1976, The observation and analysis of stellar photospheres, New York: Wiley-Interscience.
- (43) Grevesse, N., Sauval, A. J., 1998, Space Science Reviews, v. 85, Issue 1/2, p. 161
- (44) Goorvitch, D., 1994, ApJS, 95, 535
- (45) Gunn, J.E., Stryker, L.L., 1983, ApJS, 52, 121
- (46) Heavens, A., Panter, B., Jimenez, R., Dunlop, J., 2004, Nature, 428, 625
- (47) Hinkle, K., Wallace, L., Valenti, J., Harmer, D., 2000, Visible and Near Infrared Atlas of the Arcturus Spectrum 3727-9300 A, ed. Kenneth Hinkle, Lloyd Wallace, Jeff Valenti, and Dianne Harmer, San Francisco: ASP
- (48) Holweger, H., Müller, E. 1974, Solar Phys., 39, 19 (HM74)
- (49) Huber, K.P., Herzberg, G., 1979, Constants of Diatomic Molecules, van Nostrand Reinhold, New York Spectra of Diatomic Molecules, Am. Elsevier Pub. Co.
- (50) Jacoby, G.H., Hunter, G.A., Christian, C.A., 1984, ApJ, 419, 592
- (51) Jimenez, R., MacDonald, J., Dunlop, J., Padoan, P., Peacock, J., 2004, MNRAS, 349, 240
- (52) Jones, L.A. 1999, PhD Thesis, University of North Carolina, Chapel Hill
- (53) Jorgensen, U. G., 1994, A&A, 284, 179
- (54) Katz, D.; The Rvs Team, 2004, Semaine de l’Astrophysique Francaise, meeting held in Paris, France,Eds.: F. Combes, D. Barret, T. Contini, F. Meynadier and L. Pagani, EdP-Sciences, Conference Series
- (55) Kupka, F., Piskunov, N., Ryabchikova, T. A., Stempels, H. C., Weiss, W. W., 1999, A&AS, 138, 119
- (56) Kurucz, R.L., 1993, CD-ROM 13, 14, 18, 23
- (57) Kurucz, R.L., Furenlid, I., Brault, J., 1984, Solar flux atlas from 296 to 1300 nm, National Solar Observatory Atlas, Sunspot, New Mexico: National Solar Observatory.
- (58) Le Borgne, J.-F., Bruzual, G., Pell , R., Lan on, A., Rocca-Volmerange, B., Sanahuja, B., Schaerer, D., Soubiran, C., V lchez-G mez, R., 2003, A&A, 402, 433
- (59) Leitherer, C., Schaerer, J., Goldader, J., Delgado, R., Robert, C. et al., 1999, ApJS, 123, 3
- (60) Lejeune, Th., Cuisinier, F., Buser, R., 1997, A&AS, 125, 229
- (61) Lejeune, Th., Cuisinier, F., Buser, R., 1998, A&AS, 130, 65
- (62) Luque, J., Crosley, D. R. 1999, SRI International Report MP 99-009
- (63) Maraston, C., 2005, submitted to MNRAS, astro-ph/0410207
- (64) McWilliam, A., 1997, ARA&A, 35, 503
- (65) McWilliam, A. 1998, AJ, 115, 1640
- (66) McWilliam, A., Rich, R. M., 1994, ApJS, 91, 749
- (67) Martins, L.; Gonzalez Delgado, R. M.; Leitherer, C., Cerviño, M., Hauschildt, P., 2005, MNRAS 358, 49
- (68) McWilliam, A., Rich, R. M., 1994, ApJS, 91, 749
- (69) McWilliam, A., Rich, R. M., 2004, Origin and Evolution of the Elements, from the Carnegie Observatories Centennial Symposia. Carnegie Observatories Astrophysics Series. Edited by A. McWilliam and M. Rauch. Pasadena: Carnegie Observatories
- (70) Meléndez, J., Barbuy, B., 1999, ApJS, 124, 527
- (71) Meléndez, J., Barbuy, B., 2002, ApJ, 575, 474
- (72) Meléndez, J., Barbuy, B. & Spite, F. 2001, ApJ, 556, 858
- (73) Meléndez, J., Barbuy, B., Bica, E., Zoccali, M., Ortolani, S., Renzini, A., Hill, V., 2003, A&A, 411, 417
- (74) Mendes de Oliveira, C., Coelho, P., Gonzalez, J.J., Barbuy, B., 2005, AJ, 130, 55
- (75) Munari, U., Castelli, F., Zwitter, T., 2005, A&A, accepted (astro-ph/0502047)
- (76) Murphy, T., Meiksin, A., 2004, MNRAS, 351, 1430
- (77) O’Mara, B., 1976, MNRAS, 177, 551
- (78) Panter, B., Heavens, A., Jimenez, R., 2004, MNRAS, 355, 764
- (79) Pickles, A.J. 1998, PASP, 110, 863
- (80) Plez, B., 1998, A&A, 337, 495
- (81) Plez, B., Brett, J.M., Nordlund, 1992, A&A, 256, 551
- (82) Phillips, J. G., Davis, S. P., 1968, Berkeley Analyses of Molecular Spectra, Berkeley: University of California Press
- (83) Phillips, J.G., Davis, S.P., Lindgren, B., Balfour, W.J. 1987, ApJS, 65, 721
- (84) Pompéia, L., Barbuy, B., Grenon, M., 2003, ApJ, 592, 1173
- (85) Praderie, F., 1967, Annales d’Astrophysique, Vol. 30, p.31
- (86) Pradhan, A.D., Partridge, H., Bauschlicher, C.W.J. 1994, J. Chem. Phys., 101, 3857
- (87) Prochaska, L.C., Rose, J.A. & Schiavon, R.P., 2005, AJ, submitted
- (88) Proctor, R. N., Forbes, D. A., Beasley, M. A., 2004, MNRAS 355, 1327
- (89) Reader, J., Wiese, W. L., Martin, W. C., Musgrove, A., Fuhr, J. R., 2002, NASA Laboratory Astrophysics Workshop, held May 1-3 2002 at NASA Ames Research Center, Moffett Field, CA 94035-1000. Publisher: NASA. Edited by Farid Salama. Reference Conference Proceedings: NASA/CP-2002-21186, p. 80.
- (90) Rodriguez-Merino, L.H., Chavez, M., Bertone, E., Buzzoni, A 2005, ApJ, 626, 411
- (91) Ryan, S. G., 1998, A&A, 331, 1051
- (92) Schiavon, R.P., Barbuy, B., Singh, P.D.: 1997, ApJ, 484, 499
- (93) Schiavon, R.P., Barbuy, B., 1999, ApJ, 510, 934
- (94) Schiavon, R.P., 2005, ApJS, submitted
- (95) Schulz, R.H., Armentrout, P.B. 1991, J.Chem.Phys., 94, 2262
- (96) Schulz, J., Fritze-v. Alvensleben, U,, M ller, C. S., Fricke, K. J., 2002, A&A, 392, 971
- (97) Sneden, C., McWilliam, A., Preston, G. W., Cowan, J. J., Burris, D. L., Armosky, B. J., 1996, ApJ, 467, 819
- (98) Spielfiedel, A., Feautrier, N., Chambaud, G., Levy, B., 1991, Journal of Physics B: Atomic, Molecular, and Optical Physics, Volume 24, Issue 22, p. 4711
- (99) Spite, M.: 1967, Ann. d’Astroph., 30, 211
- (100) Steffen, M., 1985, A&AS, 59, 403
- (101) Steinmetz, M., 2003, ASPC, 298, 381
- (102) Tantalo, R., Chiosi, C., 2004, MNRAS 353, 917
- (103) Thomas, D., Maraston, C., Bender, R., 2003a, MNRAS, 339, 897
- (104) Thomas, D., Maraston, C., Bender, R., 2003b, MNRAS, 343, 279
- (105) Timmes, F. X., Woosley, S. E., Weaver, Thomas A., 1995, ApJS, 98, 617
- (106) Trager, S.C., Worthey, G., Faber, S.M., Burstein, D., González, J.J. 1998, ApJS, 116, 1
- (107) Tsuji, T. 1973, A&A, 23, 411
- (108) Unsold, A., 1955, Physik der Sternatmospharen, MIT besonderer Berucksichtigung der Sonne, Berlin: Springer.
- (109) Valdes, F., Gupta, R., Rose, J., Singh, H., Bell, D., 2004, ApJS, 152, 251
- (110) Valenti, J.A. & Fischer, D.A. 2005, ApJS, 159, 141
- (111) van ’t Veer-Menneret, C., Megessier, C. 1996, A&A, 309, 879
- (112) Vazdekis, A., 1999, ApJ 513, 224
- (113) Westera, P., Lejeune, T., Buser, R., Cuisinier, F., Bruzual, G., 2002, A&A 381, 524
- (114) Willemsen, P.G, Hilker M., Kayser, A., Bailer-Jones, C.A.L., 2005, A&A, in press, astro-ph:0503345
- (115) Worthey, G., Faber, S. M., Gonzalez, J. J., 1992, ApJ, 398, 69
- (116) Worthey, G., Faber S.M., González, J.J., Burstein, D., 1994, ApJS, 94, 687
- (117) Zoccali, M., Barbuy, B., Hill, V., Ortolani, S., Renzini, A., Bica, E., Momany, Y., Pasquini, L., Minniti, D., Rich, R. M., 2004, A&A, 423, 507
- (118) Zwitter, T., Castelli, F., Munari, U., 2004, A&A, 417, 1055