Cluster scaling and its redshift evolution from XMM-Newton.
Abstract
We put together the results of XMM-Newton observations of a number of representative group and cluster samples at low and high redshifts. These results confirm the entropy ramp as an explanation of the observed scaling relations. We observe a mild evolution in the entropy of clusters. The observed degree of evolution is consistent with expectations of the shock heating at a fixed overdensity (500) with respect to the critical density in . The study of the evolution in the pressure scaling imposes strong requirements in the definition of the average temperature of the cluster. The scaling temperature should be consistent to better than the 10% level. Once such a consistency is achieved, no additional evolution in the pressure has been detected in addition to the prediction of the shock heating in the Universe.
keywords:
Galaxy groups, clusters; large scale structure of the Universe , Galaxy clusters , X-ray sources , Observational cosmology, , , , , ,
1 Introduction
Comparative studies of the scaling relations in clusters of galaxies reveal strong deviations of the observed relations from predictions based on self-similar collapse, e.g. the observations show a steeper relation than predicted by the self-similar laws (Kaiser 1986). These deviations are thought to be best characterized by the injection of energy (preheating) into the gas before clusters collapse (Kaiser 1991; Evrard & Henry 1991). Recently, an analysis of a large compilation of entropy profiles on groups and clusters of galaxies also required at much larger entropy levels than was thought before (Finoguenov et al. 2002) and modifying the concept of the entropy floor to the entropy ramp at (Ponman et al. 2003). Reproduction of these results both analytically and numerically, strongly supports the scenario of Dos Santos & Dore (2002), where an initial adiabatic state of the infalling gas is further modified by the accretion shock (Voit & Ponman 2003). As a supporting evidence to the latter, Ponman et al. (2003) noticed a self-similarity in the entropy profiles, once scaled to . Some XMM-Newton observations are consistent with this result (Pratt & Arnaud 2003). A major change introduced by these studies is that groups of galaxies can again be viewed as scaled-down versions of clusters, yet the scaling itself is modified. Other evidence for the departure of groups from the trends seen in clusters, such as the slope of the relation, has been recently refuted by Osmond & Ponman (2004).
The idea of this contribution is to check the consistency between the data and both the concept and the level of the modified entropy scaling. While we give an overview of the results here, the details of the data analysis could be found in Zhang et al. (2004); Finoguenov et al. (2004b, and in prep.).
For our study we have selected 14 groups in Mulchaey et al. (2003) in the redshift range with publicly available XMM-Newton (Jansen et al. 2001) observations. Most of the groups in the Mulchaey et al. (2003) sample were found by cross-correlating the ROSAT observation log with the positions of optically-selected groups. Their final group list contains 109 systems.
The REFLEX-DXL galaxy cluster sample, comprising distant X-ray luminous objects within REFLEX, was constructed from the REFLEX galaxy cluster survey covering the ROSAT detected galaxy clusters above a flux limit of erg s-1 cm-2 in the 0.1 to 2.4 keV band in an 4.24 ster region of the southern sky (see Böhringer et al. 2004 for details). The REFLEX-DXL clusters form a volume limited subset of REFLEX in the redshift range 0.27 to 0.31 including 14 members. The properties of the REFLEX-DXL clusters are described in Zhang et al. (2004).
In addition to these two samples, we have added some of the published work on the nearby clusters, A754 (Henry et al. 2004), A3667 (Briel et al. 2004), A3562 (Finoguenov et al. 2004a); A478 (Sanderson et al. 2004); A3558 (Rossetti et al. in prep.); A3266 (Finoguenov et al. 2005). Addition of these data allows us to demonstrate to which extent the scaling works at low redshift.
At the moment a number of prescriptions exists on how to scale the cluster properties and look for their evolution (e.g. Voit 2004). We choose the following approach to scale the observables. The calculation of the is the following: , where the scaling in Finoguenov et al. (2001) for () is translated into our assumption for . We use , suitable for our choice of cosmological model. In Finoguenov et al. (2001) it has been demonstrated that the cosmological corrections are negligible in deriving the scaling for in their sample of local clusters. These corrections are, however important for REFLEX-DXL.
The normalization of the empirical entropy scaling is taken from Ponman et al. (2003; hereafter PSF) and rescaled for the difference in the assumption for the Hubble constant.
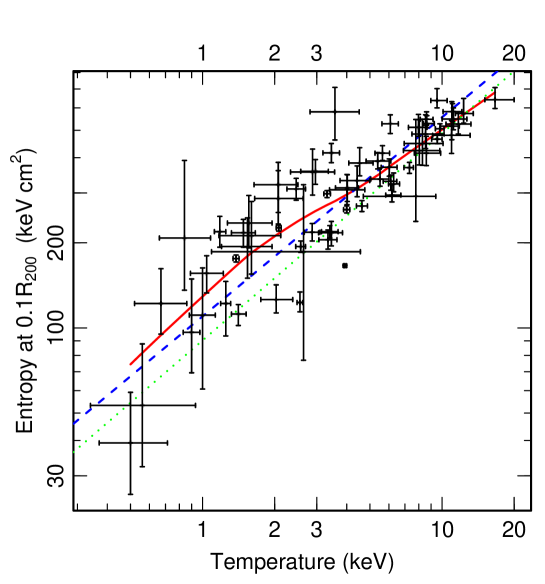
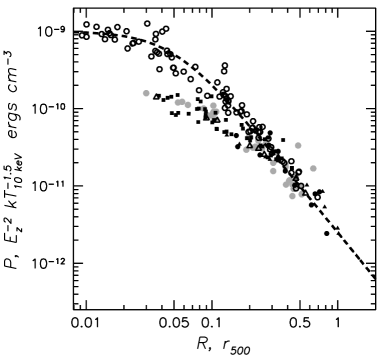
A suggested modified entropy scaling of PSF reads . We also take into account that to fit the clusters hotter than 5 keV, the normalization of this relation should be 20% lower. In Fig.1 we illustrate this issue by performing the locally-weighted pseudo-non-parametric analysis (for further insights and references, see Sanderson et al. 2004). While this is done here to properly reproduce the mean entropy of the clusters, observed previously, a glitch in the (and ) relation implied by such an approach, will be studied elsewhere. In the following we will use the entropies measured at for a 10 keV systems and apply scaling with . In addition to the scaling of the entropy and a fixed fraction of virial radius, we adopt a radial behavior of the entropy as , which for the local sample has been shown to work outside the (Pratt et al. 2003).
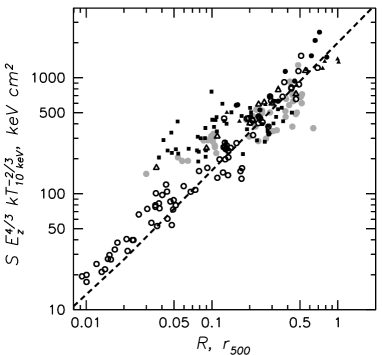
In the analysis of clusters, we will also present the scaled pressure plots. As entropy, , scales as (where is the weighted temperature), the density scales as and the pressure . For high-redshift clusters, we introduce a correction for the evolution of the critical density, which is proportional to . Introduction of the correction for the evolution of the critical density to either pressure or entropy is appropriate only if the shock heating of the accreted gas is the dominant mechanism defining the thermodynamics of the ICM and the resulting agreement of the data with the local scaling confirms the major role of the shock heating in establishing the entropy and pressure profiles for clusters. A sample of high-redshift groups would be needed to extend this conclusion to groups.
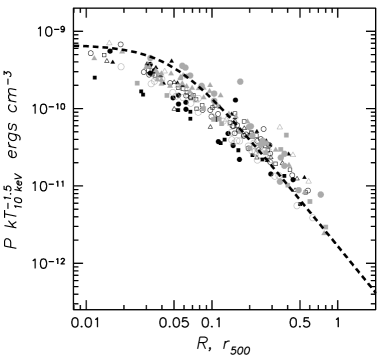
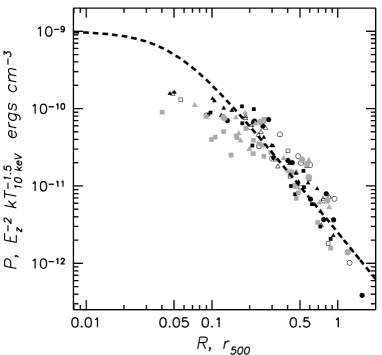
As we are not aware of any prescription for the pressure, in this contribution we use the fit to A478 data and discuss whether it is representative. Including the prescription for the scaling of the pressure with the average cluster temperature, the pressure model, implied by the A478 data reads as ergs cm-3. In addition, we adopt a factor of 1.5 lower pressure normalization for systems with temperatures less than 5 keV in concordance with the entropy scaling.
The pressure within the central in clusters with on-going mergers (most remarkably A3558 and A3266) lies below our pressure model. The same clusters also reveal an entropy which is much higher in the center, which may at least partly explain the effect. At radii beyond , there is less scatter among the clusters and the adopted pressure model performs well.
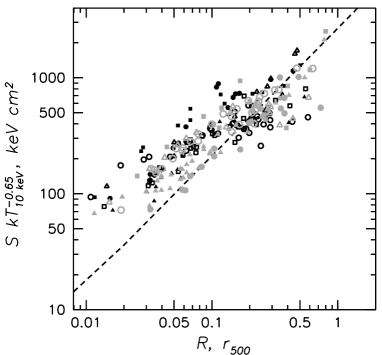
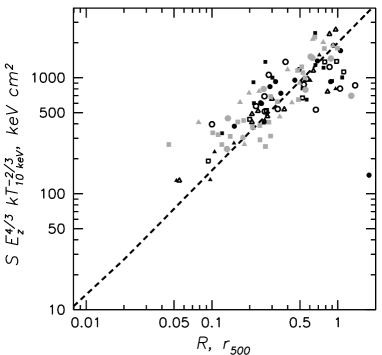
Our main results are presented in Fig.2 and imply:
(1) Strong deviations from the law are occurring inside for groups, while in regular clusters such deviations are generally confined to (Pratt & Arnaud 2003). It may indicate that the effect of non-gravitational processes is important to a larger extent in the groups. However, similar level of deviations is also present in the merger clusters.
(2) At radii , the entropy profiles in the groups are on average flatter than the law. This result raises an interest in a systematic study of entropy profiles at . The level of the observed flattening is around 100 keV cm2 and could be related to the cooling threshold, discussed in Voit et al. (2003). At the same radii, the pressure profile in groups is on average flatter than in clusters, which is seen as on average higher pressure at outskirts of the groups compared to the model.
(3) A comparison between the prediction of the entropy according to the evolution of the shock heating in the Universe and the data can explain the entropy of the gas. The radial behavior of the entropy is flatter, compared to the index of predicted in a hierarchical cluster growth with no feedback effects (Tozzi & Norman 2001; Voit 2004). This result implies that either the growth of clusters has been slower or feedback effects are significant. Slower accretion rates support a suggestion of a dark energy dominated Universe (Schuecker et al. 2003).
(4) At high redshift, the typical pressure of the gas is found to be in agreement with prediction of the evolution, once a consistent definition of the mean temperature has been assumed for scaling. The effect of energy band in determining the mean temperatures has been discussed in Zhang et al. (2004) in application to the REFLEX-DXL sample and by Mazzotta et al (2004) in application to clusters in general.
References
- (1) Böhringer, H., Schuecker, P., Guzzo, L., et al. 2004, A&A, 425, 367-383 The ROSAT-ESO Flux Limited X-ray (REFLEX) Galaxy cluster survey. V. The cluster catalogue
- (2) Briel, U. G., Finoguenov, A., Henry, J. P. 2004, A&A, 426, 1-9 XMM-Newton EPIC observation of the galaxy cluster A 3667
- (3) Dos Santos, S. & Doré, O. 2002, A&A, 383, 450-471 Competition between shocks and entropy floor: Unifying groups and clusters of galaxies
- (4) Evrard, A. E. & Henry, J. P. 1991, ApJ, 383, 95-103 Expectations for X-ray cluster observations by the ROSAT satellite
- (5) Finoguenov, A., Reiprich, T., Böhringer, H. 2001, A&A, 368, 749-759 Details of the mass-temperature relation for clusters of galaxies
- (6) Finoguenov, A., Jones, C., Böhringer, H., & Ponman, T. J. 2002, ApJ, 578, 74-89 ASCA Observations of Groups at Radii of Low Overdensity: Implications for the Cosmic Preheating
- (7) Finoguenov, A., Henriksen, M. J., Briel, U. G., de Plaa, J., Kaastra, J. S. 2004a, ApJ, 611, 811-820 XMM-Newton study of A3562 and its immediate Shapley environs.
- (8) Finoguenov, A., Boehringer, H., Zhang, Y.-Y. A&A, subm. XMM-Newton study of the two-dimensional structure of the REFLEX-DXL galaxy clusters.
- (9) Finoguenov, A., Henriksen, M. J., Miniati, F. Briel, U. G., Jones, C. A Puzzling Merger in A3266: the Hydrodynamic Picture from XMM-Newton, ApJ, subm.
- (10) Henry, J. P., Finoguenov, A., Briel, U. G. 2004, ApJ, 615, 181-195 Wide-Field X-Ray Temperature, Pressure, and Entropy Maps of A754
- (11) Jansen, F., Lumb, D., Altieri, B., et al. 2001, A&A, 365, L1-L6 XMM-Newton observatory. I. The spacecraft and operations
- (12) Kaiser, N. 1986, MNRAS, 222, 323-345 Evolution and clustering of rich clusters
- (13) Kaiser, N. 1991, ApJ, 383, 104-111 Evolution of clusters of galaxies
- (14) Mazzotta, P., Rasia, E., Moscardini, L., & Tormen, G. 2004, MNRAS, 354, 10-24 Comparing the temperatures of galaxy clusters from hydrodynamical N-body simulations to Chandra and XMM-Newton observations
- (15) Mulchaey, J. S., Davis, D. S., Mushotzky, R. F., Burstein, D. 2003, ApJS, 145, 39-64 An X-Ray Atlas of Groups of Galaxies
- (16) Osmond, J. P. F. & Ponman, T. J. 2004, MNRAS, 350, 1511-1535 The GEMS project: X-ray analysis and statistical properties of the group sample
- (17) Ponman, T. J., Sanderson, A. J. R., Finoguenov, A. 2003, MNRAS, 343, 331-342 The Birmingham-CfA cluster scaling project–III. Entropy and similarity in galaxy systems
- Pratt & Arnaud (2003) Pratt, G. W. & Arnaud, M. Entropy scaling in galaxy clusters: Insights from an XMM-Newton observation of the poor cluster A1983. A&A 408, 1-16, 2003.
- (19) Rossetti, M., Molendi, S., Ghizzardi, S., Finoguenov, A. A&A, in prep. The XMM/Chandra view of A3558.
- (20) Sanderson, A. J. R., Finoguenov, A., Mohr, J.J. 2004, ApJ, subm. (astro-ph/0412316) AGN shock heating in the cool core galaxy cluster Abell 478.
- (21) Schuecker, P., Caldwell, R. R., Böhringer, H., Collins, C. A., Guzzo, L., & Weinberg, N. N. 2003, A&A, 402, 53-63 Observational constraints on general relativistic energy conditions, cosmic matter density and dark energy from X-ray clusters of galaxies and type-Ia supernovae
- (22) Tozzi, P. & Norman, C. 2001, ApJ, 546, 63-84 The Evolution of X-Ray Clusters and the Entropy of the Intracluster Medium
- (23) Voit, G. M., Balogh, M. L., Bower, R. G., Lacey, C. G., & Bryan, G. L. 2003, ApJ, 593, 272-290 On the Origin of Intracluster Entropy
- (24) Voit, G. M. & Ponman, T. J. 2003, ApJL, 594, L75-L78 Signatures of Galaxy Formation in the Intracluster Medium
- Voit (2004) Voit, M.G. Tracing cosmic evolution with clusters of galaxies. Rev. Mod. Phys. (in press), astro-ph/0410173, 2004.
- (26) Zhang, Y.-Y., Finoguenov, A., Böhringer, H., et al. 2004, A&A, 413, 49-63 Temperature gradients in XMM-Newton observed REFLEX-DXL galaxy clusters at