Spectroscopic Confirmation of Multiple Red Galaxy-Galaxy Mergers in MS 1054–03 ()1,2,3
Abstract
We present follow-up spectroscopy of the galaxy cluster MS 1054–03 () confirming that at least six of the nine merging galaxy pairs identified by van Dokkum et al. (1999) are indeed bound systems: they have projected separations of kpc and relative line-of sight velocities of km s-1. For the remaining three pairs, we were unable to obtain redshifts of both constituent galaxies. To identify a more objective sample of merging systems, we select bound red galaxy pairs ( kpc, km s-1) from our sample of 121 confirmed cluster members: galaxies in bound red pairs make up % of the cluster population. The color-magnitude diagram shows that the pair galaxies are as red as the E/S0 members and have a homogeneous stellar population. The red pair galaxies span a large range in luminosity and internal velocity dispersion to include some of the brightest, most massive members (, km s-1); these bound galaxy pairs must evolve into E/S0 members by . These results combined with MS1054’s high merger fraction and reservoir of likely future mergers indicates that most, if not all, of its early-type members evolved from (passive) galaxy-galaxy mergers at .
1 Introduction
Whether galaxy-galaxy merging plays a prominent role in the formation of early-type galaxies in clusters remains an open question. The expected merger rate in rich, virialized clusters is low because the relative velocities of members are too high ( Makino & Hut 1997). Observational studies are consistent with this idea as the fraction of galaxies in merging systems is low in clusters at ( Dressler 1980; Couch et al. 1998). In this context, the discovery by van Dokkum et al. (1999, hereafter vD99) that 17% of the galaxies in the rich cluster MS 1054–03 () are in merging systems was a surprise. vD99 argue that because MS1054 has not yet virialized, the high merger rate in this cluster is “permitted.”
The main uncertainty in the vD99 study is that the merging systems were identified by eye, and identifying bound galaxy pairs in a more objective manner is needed to isolate a representative sample of merging systems. Such a sample provides better constraints on the end-product of the mergers and how galaxy-galaxy merging changes the global cluster population. For example, significant amounts of merging between red members will alter the cluster’s stellar mass function. The most robust approach for selecting these “future” mergers is via a combination of projected galaxy separation and relative line-of-sight velocity, but it does require a great deal of spectroscopy.
Motivated by these issues, we revisit the issue of galaxy-galaxy merging in MS1054 using an expanded sample of spectroscopically confirmed cluster members. In this paper, we use of ; at , this gives a physical scale of kpc per arcsecond.
2 Summary of Observations
2.1 Optical and Near-Infrared Imaging
MS1054 was part of a large program carried out by our group to study galaxy clusters at intermediate redshift. As part of our observing campaign, we obtained wide-field ( Mpc), high resolution imaging of MS1054 with HST/WFPC2 in F606W and F814W. Details of the image reduction and morphological classification are in van Dokkum et al. (2000a).
In addition, deep wide-field ground-based imaging of MS1054 in and was taken on the VLT with FORS1 and ISAAC, respectively. Details of the image reduction and photometry can be found in Förster Schreiber et al. (2005). To summarize, all of the images were convolved to a common spatial resolution of FWHM. Objects then were detected using SExtracter v2.2.2 (Bertin & Arnouts 1996) and colors measured using custom isophotal apertures.
2.2 Keck/LRIS Spectroscopy
To determine cluster membership, we observed MS1054 using LRIS (Oke et al. 1995) on the Keck Telescope from February 1997 to June 2001. During 6 observing runs, 21 multi-slit masks were used to measure redshifts and internal velocity dispersions for -selected targets; one mask (June 2001) specifically targeted classified mergers. Details on how the spectra were reduced, redshifts determined, and spectral indices measured ([OII], H, & H) are in Tran et al. (1999, 2003). The typical error associated with the redshifts is km s-1.
Considering only galaxies that fall on the HST/WFPC2 mosaic, we have 121 confirmed cluster members that span a range in luminosity (); for these galaxies, we have measured structural parameters, colors, and morphologies. Our analysis also includes measured internal velocity dispersions () for 26 members (Kelson et al. 2001; Wuyts et al. 2004).
3 Visually Identified Galaxy Mergers
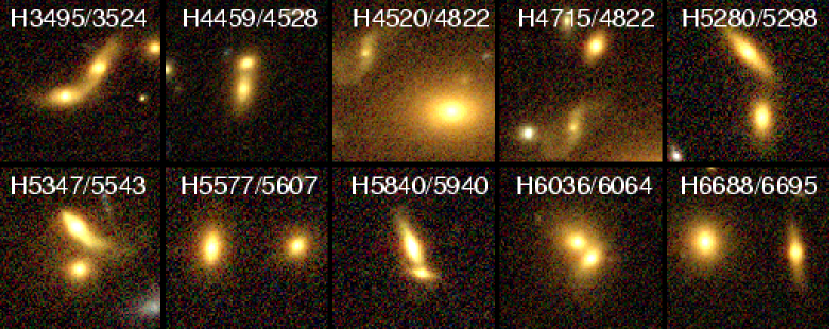
We have obtained follow-up spectroscopy for the original 13 mergers reported by vD99 to determine if they are truly bound systems. To clarify, WFPC2 imaging showed that these mergers were made of 9 close pairs and 4 (single) morphologically irregular galaxies; we refer to Postman et al. (2005, Fig. 8) for higher resolution imaging from the Advanced Camera for Surveys (ACS) of the same systems. We focus here on the 9 close pairs.
Redshifts of the constituent galaxies for 6 of the 9 close pairs confirms that these are bound systems: they have projected separations of kpc and relative velocities of km s-1. To confirm that their relative velocities are not due to chance projections between members, we compare their to that of a random (normalized) cluster sample where the latter is generated by drawing galaxy pairs from the full redshift sample of cluster members (Fig. 1, left). A Kolmogorov-Smirnov test shows the two distributions differ at the % level.
For the remaining 3 close pairs, we were unable to obtain redshifts for the companion galaxies: one companion was not targeted, and the spectra of the other 2 were too faint to measure a redshift. However, we stress that all 6 of the close pairs for which we have measured relative velocities confirm that they are merging systems. Although we were unable to obtain relative velocities for the remaining 3 close pairs from vD99, it is very likely that they too are bound systems.
4 Objectively Identified Galaxy Pairs
4.1 Counting Close Galaxy Pairs
As a quantitative measure of the excess of close pairs in MS1054, we follow van Dokkum et al. (2000b) and examine the distribution of galaxy-galaxy separations in the WFPC2 photometric catalog. For each galaxy, we count the number of objects that lie at a given distance and then weight by the surface area to obtain the surface density. By summing over all galaxies for a given galaxy-galaxy separation, we then have the relative galaxy density as a function of . For simplicity, we bin the sample into rings defined by and where is the average of these two values. Thus for a given ring, we have:
| (1) |
where is the total number of galaxies. If the galaxies are distributed uniformly, the distribution of as a function of will be flat.
Because we are primarily interested in the red cluster members, we consider only the 142 galaxies from the WFPC2 catalog with and mags; for reference, the brightest cluster galaxy (BCG) has and mags. Our color and magnitude selection are effective at isolating red cluster members: we have measured redshifts for 91 of these red galaxies and 89 (98%) are confirmed cluster members.
Figure 1 (middle) shows the relative galaxy density as a function of increasing for these red galaxies. Since the high galaxy density in the cluster core can increase for small separations, we exclude the inner kpc region. The distribution is essentially flat except for a strong peak at kpc.
To further investigate the issue of projected versus bound pairs, we consider the 5 red pairs with kpc and 7 red pairs with kpc at kpc. From the average relative density of pairs with kpc, we estimate that 4/5 and 3/7 are bound pairs with the remainder being chance projections. We test this result with our spectroscopy. We find that all 5 red galaxy pairs with kpc are bound; note that all 5 also were identified by vD99 as mergers. Spectroscopy for 5 of the 7 red pairs with kpc shows that only 1 pair is bound.
4.2 Defining a Sample of Bound Red Galaxy Pairs
As demonstrated above, spectroscopy is critical for determining whether photometric pairs ( kpc) are bound systems. With this in mind, we now define a spectroscopically confirmed sample of bound red galaxy pairs. First we take the 142 red galaxies and make each one into a pair with every other red galaxy. We then consider only the red pairs that are made of confirmed cluster members and measure their relative velocities and projected separations (Fig. 1, right).
Guided by studies on merging pairs (Patton et al. 2000; Lin et al. 2004), we select bound pairs as members with projected separations of kpc and relative velocities of km s-1: there are 10 such systems (Fig. 2). Thus the fraction of red merging galaxies in MS1054 is % (19/121). With this definition, a single galaxy can contribute to two separate bound pairs; there is one such triplet system in our pair sample. Note that this differs from vD99 where merging pairs were defined to be a single system. We also verified that our spectroscopic sample is not biased towards red galaxies with small projected separations: to mags, the spectroscopic sample is % complete compared to % complete for red galaxies with a neighbor within kpc.
As with all observational studies on galaxy pairs, we cannot say with absolute certainty that our 10 bound red pairs will merge into a single system by . However, detailed simulations of major mergers find that the constituent galaxies merge in Gyr (e.g. Barnes 1988; Mihos & Hernquist 1994; Springel 2000; Jonsson et al. 2005). In addition, Patton et al. (2000) showed that the typical merging timescale for galaxy pairs with kpc and km s-1 is 0.5 Gyr: given our bound pairs have even smaller projected separations and relative velocities ( kpc, km s-1), it is very likely they will merge by .
5 Discussion
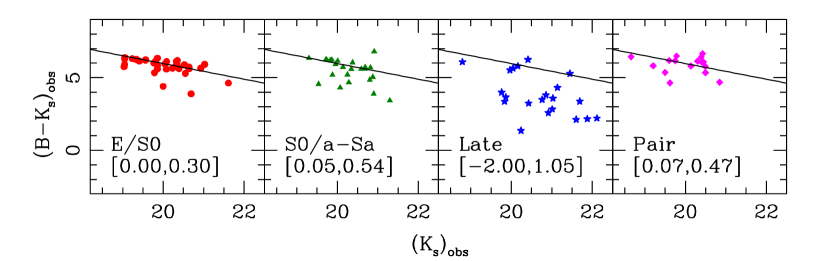
The physical properties of the galaxies making up MS1054’s bound red pairs indicate that the pairs can evolve into massive E/S0 members by . The color-magnitude diagram (Fig. 3) shows that 1) the pair galaxies span the range in luminosity and include the brightest cluster members; 2) they are as red (old) as the E/S0 population; and 3) their scatter in color is only times that of the E/S0’s. Their relatively small scatter compared to, MS1054’s late-types, indicates that the pair galaxies have homogeneous stellar populations; assuming these systems evolve passively, their fractional age differences will decrease and their scatter reduce accordingly. Their co-added spectrum confirms that the pair galaxies are dominated by old stellar populations (Fig. 4). The pair galaxies also include very massive members: 9 have internal velocity dispersions km s-1 (Wuyts et al. 2004).
Can the number of E/S0 members formed via late-time merging between red members significantly alter MS1054’s stellar mass function? From their study covering a wide range in environment, Bell et al. (2004) claim that the stellar mass function for red galaxies increases by a factor of two between and now. If true, adopting the simplest scenario implies that every present-day cluster early-type undergoes a merger at . Assuming a typical merger timescale of 0.5 Gyr and Gyr, this requires that at a given time, only % of the galaxies need be in a merging system. The merger fraction in MS1054 is more than twice this value (%), and MS1054 has a rather astonishing merger rate of Gyr-1.
Although MS1054’s current merger rate is certainly high, the key question is how long can it be sustained? To increase the stellar mass function of red galaxies by the quoted factor of two, MS1054 would need to retain a merger fraction of % over the next Gyr (assuming Gyr) and have all of these mergers evolve into early-type members. MS1054 does have a reservoir of possible “future” mergers: there are six red galaxy pairs with kpc and km s-1 (Fig. 1, right) that can provide at least one more generation of merging pairs.
Accretion of galaxy groups also can be a source of future mergers: the group environment is conducive to galaxy-galaxy merging, and Press-Schechter theory (Press & Schechter 1974) predicts MS1054 will more than double its mass by (M. Santos, private communication) via accretion of, groups (Gonzalez et al. 2005). MS1054’s high merger rate is very likely linked to its ongoing accretion of galaxy groups (Hoekstra et al. 2000); if so, this implies that an elevated merger rate is associated with this special phase in cluster evolution. MS1054’s merger rate will drop as it virializes (Makino & Hut 1997), a result consistent with the low merger fractions found in lower redshift clusters ( Couch et al. 1998).
Thus in the case of MS1054, it is quite feasible that all of the early-type members evolved from (passive) galaxy-galaxy mergers at , assuming the cluster does not virialize immediately after the epoch of observation.
References
- Barnes (1988) Barnes, J. E. 1988, ApJ, 331, 699
- Bell et al. (2004) Bell, E. F., Wolf, C., Meisenheimer, K., Rix, H., Borch, A., Dye, S., Kleinheinrich, M., Wisotzki, L., & McIntosh, D. H. 2004, ApJ, 608, 752
- Bertin & Arnouts (1996) Bertin, E. & Arnouts, S. 1996, A&A, 117, 393
- Couch et al. (1998) Couch, W. J., Barger, A. J., Smail, I., Ellis, R. S., & Sharples, R. M. 1998, ApJ, 497, 188
- Dressler (1980) Dressler, A. 1980, ApJ, 236, 351
- Förster Schreiber et al. (2005) Förster Schreiber, N. M., van Dokkum, P. G., Franx, M., Labbé, I., Rudnick, G., & Daddi, E. 2005, AJ, submitted
- Gonzalez et al. (2005) Gonzalez, A. H., Tran, K. H., Conbere, M. N., & Zaritsky, D. 2005, ApJ, 624, L73
- Hoekstra et al. (2000) Hoekstra, H., Franx, M., & Kuijken, K. 2000, ApJ, 532, 88
- Jonsson et al. (2005) Jonsson, P., Cox, T., Primack, J., & Somerville, R. 2005, ApJ
- Kelson et al. (2001) Kelson, D. D., Illingworth, G. D., Franx, M., & van Dokkum, P. G. 2001, ApJ, 552, L17
- Lin et al. (2004) Lin, L., Koo, D. C., Willmer, C. N. A., Patton, D. R., Conselice, C. J., Yan, R., Coil, A. L., Cooper, M. C., Davis, M., Faber, S. M., Gerke, B. F., Guhathakurta, P., & Newman, J. A. 2004, ApJ, 617, L9
- Makino & Hut (1997) Makino, J. & Hut, P. 1997, ApJ, 481, 83
- Mihos & Hernquist (1994) Mihos, J. C. & Hernquist, L. 1994, ApJ, 431, L9
- Oke et al. (1995) Oke, J. B., Cohen, J. G., Carr, M., Cromer, J., Dingizian, A., Harris, F. H., Labrecque, S., Luciano, R., Schaal, W., Epps, H., & Miller, J. 1995, PASP, 107, 375
- Patton et al. (2000) Patton, D. R., Carlberg, R. G., Marzke, R. O., Pritchet, C. J., da Costa, L. N., & Pellegrini, P. S. 2000, ApJ, 536, 153
- Postman et al. (2005) Postman, M., Franx, M., Cross, N., Holden, B., & Ford, H. 2005, ApJ, in press
- Press & Schechter (1974) Press, W. H. & Schechter, P. 1974, ApJ, 187, 425
- Springel (2000) Springel, V. 2000, MNRAS, 312, 859
- Tran et al. (2003) Tran, K. H., Franx, M., Illingworth, G., Kelson, D. D., & van Dokkum, P. 2003, ApJ, 599, 865
- Tran et al. (1999) Tran, K. H., Kelson, D. D., van Dokkum, P., Franx, M., Illingworth, G. D., & Magee, D. 1999, ApJ, 522
- van Dokkum et al. (2000a) van Dokkum, P. G., Franx, M., Fabricant, D., Illingworth, G. D., & Kelson, D. D. 2000a, ApJ, 541, 95
- van Dokkum et al. (1999) van Dokkum, P. G., Franx, M., Fabricant, D., Kelson, D. D., & Illingworth, G. D. 1999, ApJ, 520, L95
- van Dokkum et al. (2000b) van Dokkum, P. G., Franx, M., Kelson, D. D., Illingworth, G. D., & Fabricant, D. 2000b, astro-ph/0012090, 541
- Wuyts et al. (2004) Wuyts, S., van Dokkum, P. G., Kelson, D. D., Franx, M., & Illingworth, G. D. 2004, ApJ, 605, 677