The Filamentary Large Scale Structure around the Radio Galaxy PKS 1138-262
Abstract
PKS 1138-262 is a massive radio galaxy at surrounded by overdensities of Ly emitters, H emitters, EROs and X-ray emitters. Numerous lines of evidence exist that it is located in a forming cluster. We report on Keck spectroscopy of candidate members of this protocluster, including nine of the 18 X-ray sources detected by Pentericci et al. (2002) in this field. Two of these X-ray sources (not counting PKS 1138-262 itself) were previously confirmed to be members of the protocluster; we have discovered that an additional two (both AGN) are members of a filamentary structure, at least Mpc in projection, aligned with the radio jet axis, the 150 kpc-sized emission-line halo, and the extended X-ray emission around the radio galaxy. Three of the nine X-ray sources observed are lower redshift AGN, and three are M-dwarf stars.
1 Introduction
PKS 1138-262 is a massive forming radio galaxy at (Pentericci et al., 1998), which is surrounded by overdensities of Ly emitters (Pentericci et al., 2000), H emitters (Kurk et al., 2004b), EROs (Kurk et al., 2004a) and X-ray emitters (Pentericci et al., 2002), several of which are spectroscopically confirmed to be close to the radio galaxy redshift. These overdensities appear to be spatially aligned with each other, and with the radio axis of PKS 1138-262 (§ 5).
At least half a dozen high redshift radio galaxies, with , are now known to be located in such overdense regions (protoclusters; Venemans et al., 2002). Candidate members of such protoclusters may be found using color selection, line emission in a narrow band targeted at the redshift of interest, or X-ray emission – as noted above, when applied to the field of PKS 1138-262, these methods all revealed overdensities. Protoclusters have also been found using Lyman Break techniques (e. g. , Steidel et al., 1998) and deep millimeter and sub-mm observations (e. g. Ivison et al., 2000; Smail et al., 2003), and confirmed with spectroscopic follow-up. Due to the atmospheric cutoff, is the lowest redshift at which the Ly selection technique will work using ground-based optical instruments, but the technique has been successfully used to detect clumps and filamentary large scale structure even at (e. g. , Ouchi et al., 2005, and references therein).
Recent simulations suggest that the colors of massive galaxies in the local Universe can only be explained if AGN feedback quenches star formation in the host galaxy (Springel et al., 2005). The link between supermassive black hole and galaxy formation (Haehnelt & Kauffmann, 2000) may depend critically on AGN feedback, via coupling of the mechanical power (via winds or jets) of AGN to the baryonic component of forming galaxies (Rawlings, 2003). The mergers, galaxy harassment, and other process invoked in AGN triggering, are common in clusters, and become increasingly important as redshift increases (Moore et al., 1998). High redshift clusters are dynamic regions at the nodes of the Large Scale Structure, where huge amounts of gravitational energy involved in structure formation may be dissipated. In order to understand the link between AGN, starburst and ULIRG galaxies (e. g. Nagar et al., 2003), and the life-cycle of a typical AGN, the study of AGN in clusters and protoclusters is important. Studies of the AGN / galaxy populations, kinematics, and substructures in protoclusters provide insight into how galaxies, AGN and clusters of galaxies form and evolve.
PKS 1138-262 is one of the first, brightest, and lowest redshift radio galaxy protoclusters discovered using Ly narrow-band selection techniques. By studying PKS 1138-262, we examine an important link between protoclusters at higher redshift, and their more evolved, virialised counterparts seen at (Ford et al., 2004), and can help constrain models of structure formation and cosmology. This, and the many X-ray emitters with unknown redshifts, motivated us to obtain further spectra of candidate members of this protocluster using slitmasks at Keck. The previous spectroscopically confirmed overdensities led us to suspect that even more of these targets, in addition to some of the candidate Ly emitters which did not yet have redshifts, would turn out to be members of the protocluster. If a large fraction of the X-ray sources turned out to be at the cluster redshift, this would suggest that the AGN activity in this cluster is unusually high, and if a large fraction of the Ly sources turn out to be protocluster members, this would tend to suggest that star formation is also enhanced.
We assume an cosmology (Spergel et al., 2003). In comparing with the analyses of Kurk et al. (2000) and Pentericci et al. (2000) note that these authors use an cosmology. However, due to a calculation error, the comoving volume in the cosmology of these papers should have been 2740 Mpc3 rather than the 3830 Mpc3 quoted in Pentericci et al. (2000). In considering the comoving volume in which the objects are located, note also that, as discussed by Kurk et al. (2004a), the latest Ly-candidate catalog is based on a re-reduction of the imaging data of Kurk et al. (2000). The area used for detection by Kurk et al. (2004a) was 38.90 arcmin2 (not, in fact, 43.6 arcmin2 as stated by those authors), 10% larger than the 35.4 arcmin2 used by Kurk et al. (2000) and Pentericci et al. (2000).
In our CDM cosmology (similar to the cosmology of Kurk et al. 2004a), the comoving area of the field used for target selection is 98 Mpc2. This yields a comoving volume of 4249 Mpc3 probed by the spectroscopic observations (in the redshift range of 2.139 – 2.170), fortuitously rather close to the 3830 Mpc3 of Pentericci et al. (2000). Using the redshift range of 2.110 – 2.164 probed by the narrow-band imaging (Kurk et al., 2000) yields a comoving volume of 7405 Mpc3. The conclusions of Kurk et al. (2004a) are essentially unchanged, i. e. , we can estimate the strength of the overdensity to be a factor , since the comoving volume density of candidate Ly emitters is 3.1 times smaller than the factor six overdensity of galaxies at discovered by Steidel et al. (2000) – see Kurk et al. (2004a) for more details. The conclusions of Pentericci et al. (2002) are also unaffected by our analysis as here the comparison to other fields is made on the basis of an areal overdensity. As noted by Pentericci et al., the strength of the overdensity (around 50% when compared to the Chandra Deep Fields) is similar to those found in galaxy clusters such as 3C 295 and RX J0030 (Cappi et al., 2001), and may, at least in part, be due to an excess of AGN in this field.
2 Keck observations
Our observations were made on 2004 January 19 – 20, using the Low Resolution Imaging Spectrometer (LRIS; Oke et al., 1995) on Keck I, with the D680 dichroic and a slit width of 1.5″. On the blue side, a 400 line / mm grism, blazed at 3400 Å was employed, giving 1.09 Å / pixel and spectral resolution 8.1 Å. On the red side, a 400 line / mm grating, blazed at 8500 Å was used, giving 1.86 Å / pixel and spectral resolution 7.3 Å. This setup gives spectral coverage of Å, although this varies somewhat from slitlet to slitlet. Two slitmasks were observed for 9000 s each. Seeing was ″ during both sets of observations.
Our primary targets were randomly selected from those X-ray emitters of Pentericci et al. (2002) and candidate Ly emitters of Kurk et al. (2004a) which did not yet have spectroscopically confirmed redshifts. Kurk et al. (2004a) select LEG (Ly-emitting galaxy) candidates from a 38.90 arcmin2 field on the basis of excess narrow versus broad band flux, from which they calculate a continuum subtracted narrow band flux, (where is the flux measured in a narrow band filter with central wavelength 3814 Å and FWHM 65 Å, and is the flux measured in Bessel -band). They also calculate a corresponding rest frame equivalent width, (assuming that the narrow band excess is due to Ly emission at ). Their values of and for our targets are shown in Table 1.
Our slitmasks were designed by attempting to maximise the number of primary targets per mask. Gaps were then filled with secondary targets: five objects confirmed as members of the protocluster by Pentericci et al. (2000). In total we observed 31 targets (Table 1). The slitmasks were designed with slitlets ranging in length from ″, in all cases adequate for good sky subtraction.
The data were reduced in the standard manner using bogus111http://astron.berkeley.edu/$∼$dan/homepage/bogus.html in iraf, and spectra extracted in a 1.3″-wide aperture.
3 Properties of the spectroscopic targets
Table 1 summarises the results for all of our spectroscopic targets. Four targets were undetected and three showed continuum but no clear emission lines. Five showed an obvious single emission line which we were unable to unambiguously identify; since continuum is seen blueward of the line in these cases it is likely to be [O II] 3727. Assuming this to be the case, we assign redshifts in Table 1 but mark these instances with a question mark. In total we obtained secure redshifts for nineteen new targets which we classify on the basis of the broadness of spectral lines; [O III] / H, [O II] / [O III] and other relevant line ratios (where these could be measured) and / or X-ray characteristics, as discussed below. Spectral lines were fit with Gaussian profiles using splot in iraf. For L968 (X3), where broad and narrow components are present, deblending was performed by fitting with multiple Gaussians. Measured parameters for the emission lines in those objects believed to be members of the PKS 1138-262 protocluster are listed in Table 2. The observed-frame equivalent width of the fitted profile, , was used to compute the rest-frame equivalent width, , which is shown in the table. In some cases our measured equivalent widths differ from the estimates of Kurk et al. (2004a); this is because it is difficult to get an accurate measure of the line flux and the faint continuum from filters which are relatively broad compared to the spectral features of interest. All lines discussed below are in emission unless otherwise noted.
L54
L522
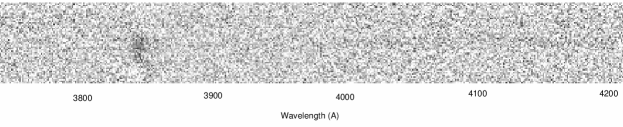
Previously confirmed at by Pentericci et al. We obtain (see Fig. 4). The Ly emission is extended (Fig. 2) over 2.7″ (23 kpc) across the slit (PA = 82°), due to the Ly halo which encompasses this object and the radio galaxy (Kurk, 2003). Indeed, in the narrow-band image, the halo is seen to be several hundred kiloparsecs in extent – this is not uncommon for such objects (e. g. , van Ojik et al., 1996), and is proposed to be due to the infall of primordial gas and galaxy “building blocks” such as Lyman Break Galaxies (Reuland et al., 2003).
L675
Previously confirmed at by Pentericci et al. (we measure ; see Fig. 4), and also detect N V 1240.
L778 (X16)
A new spectroscopic confirmation at , showing broad Ly (rest-frame deconvolved FWHM 890 km s-1), N V 1240, C IV 1549, He II 1640, C III] 1909, [C II] 2326 and Mg II 2798 (Fig. 4).
L891
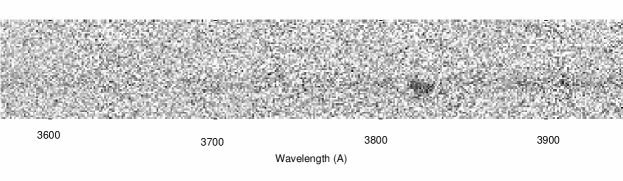
Listed as a Ly emitter by Pentericci et al., this object was observed in both of our masks, and shows continuum blueward of the supposed Ly line at 3828 Å, as well as an emission line at 7176 Å. We were unable to identify a plausible combination of emission lines arising from a single object at any redshift which could give rise to this line combination. We note, however, that in the 2D spectra (Fig. 3), the “Ly” appears offset slightly (around 0.7″) from the continuum emission. This may be a LEG at the cluster redshift (we measure ), while the continuum and 7176 Å emission line are continuum and [O II] 3727 from a foreground object at (which also shows some evidence of a continuum break in around the right place for Ca H + K).
L968 (X3)
Previously confirmed at 2.183 (with caution that Ly appears self-absorbed). We obtain , and see only slight self-absorption blueward of Ly (Fig. 4). This AGN shows broad and narrow Ly, broad and narrow C IV 1549, and broad N V. The C IV emission was fit with two Gaussian components, and the broad and narrow Ly and N V were fit with three Gaussian components.
X2, X11 & X17
H through H at are seen, along with molecular absorption bands. Comparison with the spectroscopic standards of Kirkpatrick, Henry, & McCarthy (1991) shows these three objects to be M-dwarf stars.
X5
Faint but significant Ly emission (rest-frame deconvolved FWHM 400 km s-1); a new spectroscopic confirmation at (Fig. 4). This object is also listed as an ERO (ERO 226; ) by Kurk et al. (2004a). Although it is difficult to say, based on only the observed Ly line, whether this object is a starburst or AGN, the soft X-ray to optical flux ratio (Pentericci et al., 2002), in addition to an inferred soft X-ray luminosity ( erg s-1) much too high for a starburst, provide strong evidence for the presence of an AGN.
X18
This Seyfert 2 shows strong [O II] 3727, [O III] 4959, 5007, [Ne III] 3869, [Ne V] 3426 and H lines. It is the nucleus of a galaxy undergoing a merger as seen on the VLT image.
4 Discussion
All of the nine X-ray selected targets were spectroscopically detected and classified. Six of these were AGN, three of which are members of the protocluster (including one reconfirmation). Two of these were also LEG candidates, showing again the efficacy of the narrow-band imaging selection method. Of the three lower-redshift AGN, one is at (a member of the spike discussed below).
The three remaining X-ray targets are M-dwarf stars. This is an unusually large fraction. Among the 42 objects with spectroscopic classifications in the Chandra Deep Field South catalog of Szokoly et al. (2004) only one X-ray source brighter than erg s-1 cm-2 is an M-dwarf. So the X-ray overdensity in the PKS 1138-262 field is at least in part due to an excess of M-dwarfs in the foreground. However, with five out of 18 X-ray sources (including PKS 1138-262) now confirmed to be AGN this still suggests a higher AGN fraction in the PKS 1138-262 protocluster than in local clusters (see Pentericci et al., 2002) and in the fields of other HzRGs (Overzier et al., 2005).
Of the 24 targets selected on the basis of their Ly excess, five were at the redshift of the protocluster (including four previously confirmed), seven were undetected or showed only faint continuum, and the remainder are most likely foreground galaxies. Four of these show a single emission line in the range 7927 – 8235 Å, which, if interpreted as [O II] 3727, places them at . The remaining five are at . The apparent overdensity at , which also includes L479 and X4 in addition to the four single-emission-line objects, makes it all the more necessary to obtain high quality spectra of more targets in this field to determine whether they belong to the system at , the PKS 1138-262 protocluster at , or are unassociated with either. For example, the starburst galaxy L479 at lies at the center of a 20″-long string of six EROs (Kurk et al., 2004a), suggesting that at least some of the EROs may be physically associated with the overdensity. Apparently, at this redshift, starburst galaxies with strong [O II] emission are also picked up by the Ly selection process (at quite low significance) due to bluening of their continuum by young stars.
The pure LEG-selected targets in our multislit observations did not reveal additional PKS 1138-262 protocluster members (with the exception of L778, which is also an X-ray emitter). This is unlike the high success rate (up to 70%) of spectroscopically confirmed LEGs reported by Pentericci et al. (2000). This is probably because objects with large (estimated from narrow-band photometry) are easiest to detect spectroscopically. However, these also tend to be the faintest objects in B-band (by definition) and large combined with low expected Ly flux creates a signal-to-noise problem. Indeed, we see that our four non-detections are those listed by Kurk et al. (2004a) as having large , and comparatively low Ly flux (Table 1).
To dispel any concern that our observations were less sensitive than those of Pentericci et al. (2000), note that the five of their confirmed LEGs which we observed are reconfirmed by our observations (with the possible exception of L891, as noted above — which does in any case show a line which could plausibly be Ly). In all cases except L968 (see discussion above), values of obtained are in agreement at the level. It seems therefore that our success rate in confirming Ly emitters is lower simply due to our targets being those which are intrinsically fainter and / or closer to the cutoff of the selection criteria. We note that the Ly selection technique has shown great success in other fields, particularly at higher redshift, and it is perhaps not surprising that our success rate is somewhat lower here due to redshifted Ly being towards blue optical wavelengths. Here spectroscopic efficiency begins to drop, and the measurement of broad-band fluxes below the Ly line or Lyman limit as an additional selection criterion is impossible due to the atmospheric cutoff.
5 Conclusions
There is still a good deal of evidence that PKS 1138-262 is located in a forming cluster; this conclusion is bolstered by our confirmation of two new objects at the same redshift as the radio galaxy. That one of these is also an ERO lends credence to the hypothesis that at least some of the ERO overdensity may be attributed to the protocluster. However, as noted by Steidel et al. (2000), the narrow-band (Equivalent Width) selection technique is effective but also difficult to quantify. Sensitive, wide spectral wavelength coverage is essential, the more so because there is a non-trivial chance that overdense fields at high redshifts maybe confused by other overdense fields in the foreground (van Haarlem, Frenk, & White, 1997); another example of such a superposition of unrelated overdensities is seen by Francis et al. (2004). Curiously, Francis et al. also detect an object showing two emission lines which they are unable to indentify, similar to L891 as discussed above.
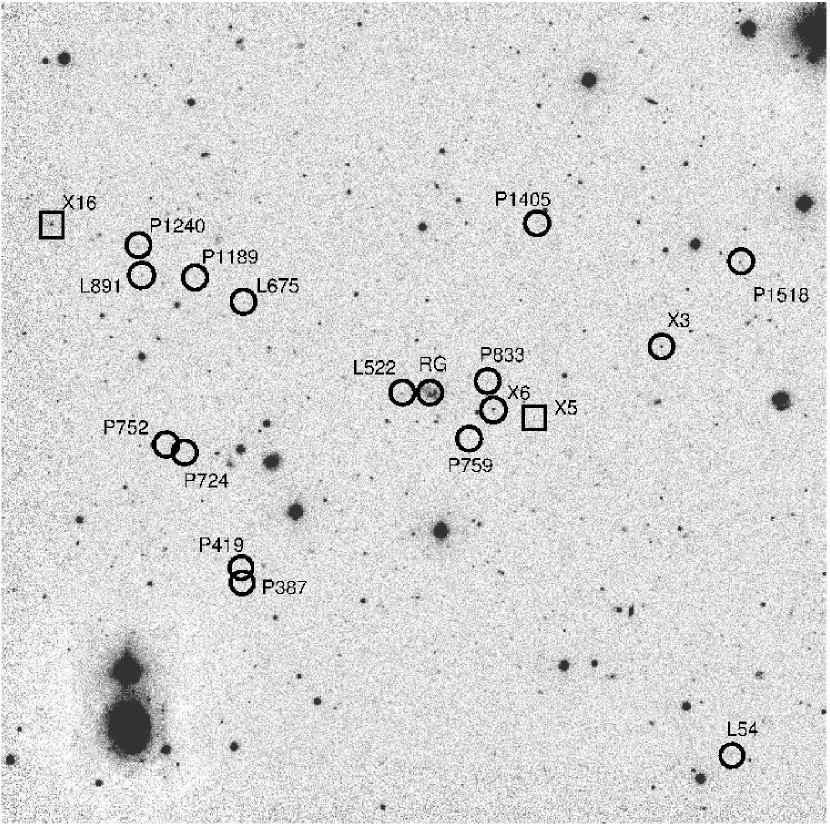
The confirmation that around one third of the X-ray sources in this field are associated with the protocluster ties in well with the conclusions of Pentericci et al. (2002) that there is a 50% excess of X-ray sources in the field of PKS 1138-262 compared to the Chandra Deep Fields. The high AGN fraction in PKS 1138-262 suggests that the AGN were probably triggered at around the same time, presumably by the ongoing formation of the protocluster. This supports models where AGN feedback is an important component of the early phases of galaxy and cluster formation. Intriguingly, our two new spectroscopic confirmations lie along the line of an apparent overdensity of spectroscopically-confirmed Ly emitters (Fig. 1), in the same direction as the overdensity of X-ray emitters, radio axis of the central galaxy, extended X-ray emission around PKS 1138-262, and the general distribution of H emitters in the cluster (Pentericci et al., 2002). This is not entirely surprising if what we are seeing is a filament of the Large Scale Structure associated with this forming galaxy cluster.
References
- Best (2000) Best, P. N. 2000, MNRAS, 317, 720
- Cappi et al. (2001) Cappi, M., et al. 2001, ApJ, 548, 624
- Carilli et al. (1998) Carilli, C. L., Harris, D. E., Pentericci, L., Rottergering, H. J. A., Miley, G. K., & Bremer, M. N. 1998, ApJ, 494, L143
- Chambers, Miley, & van Breugel (1987) Chambers, K. C., Miley, G. K., & van Breugel, W. 1987, Nature, 329, 604
- Ford et al. (2004) Ford, H., et al. 2004, in Penetrating Bars through Masks of Cosmic Dust: The Hubble Tuning Fork Strikes a New Note, ed. D. L. Block, et al. (New York: Springer); astro-ph/0408165
- Francis et al. (2004) Francis, P. J., Palunas, P., Teplitz, H. I., Williger, G. M., & Woodgate, B. E. 2004, ApJ, 614, 75
- Haehnelt & Kauffmann (2000) Haehnelt, M. G., & Kauffmann, G. 2000, MNRAS, 318, L35
- Hill & Lilly (1991) Hill, G. J. & Lilly, S. J. 1991, ApJ, 367, 1
- Ivison et al. (2000) Ivison, R. J., Dunlop, J. S., Smail, I., Dey, A., Liu, M. C., & Graham, J. R. 2000, ApJ, 542, 27
- Kirkpatrick, Henry, & McCarthy (1991) Kirkpatrick, J. D., Henry, T. J., & McCarthy, D. W. 1991, ApJS, 77, 417
- Kurk et al. (2000) Kurk, J. D., et al. 2000, A&A, 358, L1
- Kurk et al. (2004a) Kurk, J. D., Pentericci, L., Röttgering, H. J. A., & Miley, G. K. 2004, A&A, 428, 793
- Kurk et al. (2004b) Kurk, J. D., Pentericci, L., Overzier, R. A., Röttgering, H. J. A., & Miley, G. K. 2004, A&A, 428, 817
- Kurk (2003) Kurk, J. D. 2003, PhD Thesis, Leiden Observatory
- Lacey & Cole (1993) Lacey, C. & Cole, S. 1993, MNRAS, 262, 627
- Moore et al. (1998) Moore, B., Lake, G., & Katz, N. 1998, ApJ, 495, 139
- Nagar et al. (2003) Nagar, N. M., Wilson, A. S., Falcke, H., Veilleux, S., & Maiolino, R. 2003, A&A, 409, 115
- Oke et al. (1995) Oke, J. B., et al. 1995, PASP, 107, 375
- Ouchi et al. (2005) Ouchi, M., et al. 2005, ApJ, 620, L1
- Overzier et al. (2005) Overzier, R. A., Harris, D. E., Carilli, C. L., Pentericci, L., Röttgering, H. J. A., & Miley, G. K. 2005, A&A, 433, 87
- Pentericci et al. (1998) Pentericci, L., Röttgering, H. J. A., Miley, G. K., Spinrad, H., McCarthy, P. J., van Breugel, W. J. M., & Macchetto, F. 1998, ApJ, 504, 139
- Pentericci et al. (2000) Pentericci, L., et al. 2000, A&A, 361, L25
- Pentericci et al. (2002) Pentericci, L., Kurk, J. D., Carilli, C. L., Harris, D. E., Miley, G. K., & Röttgering, H. J. A. 2002, A&A, 396, 109
- Rawlings (2003) Rawlings, S. 2003, New Astronomy Review, 47, 397
- Reuland et al. (2003) Reuland, M., et al. 2003, ApJ, 592, 755
- Simpson & Rawlings (2002) Simpson, C. & Rawlings, S. 2002, MNRAS, 334, 511
- Smail et al. (2003) Smail, I., Scharf, C. A., Ivison, R. J., Stevens, J. A., Bower, R. G., & Dunlop, J. S. 2003, ApJ, 599, 86
- Spergel et al. (2003) Spergel, D. N., et al. 2003, ApJS, 148, 175
- Springel et al. (2005) Springel, V., Di Matteo, T., & Hernquist, L. 2005, ApJ, 620, L79
- Steidel et al. (1998) Steidel, C. C., Adelberger, K. L., Dickinson, M., Giavalisco, M., Pettini, M., & Kellogg, M. 1998, ApJ, 492, 428
- Steidel et al. (2000) Steidel, C. C., Adelberger, K. L., Shapley, A. E., Pettini, M., Dickinson, M., & Giavalisco, M. 2000, ApJ, 532, 170
- Szokoly et al. (2004) Szokoly, G. P., et al. 2004, ApJS, 155, 271
- Venemans et al. (2002) Venemans, B. P., et al. 2002, ApJ, 569, L11
- van Haarlem, Frenk, & White (1997) van Haarlem, M. P., Frenk, C. S., & White, S. D. M. 1997, MNRAS, 287, 817
- van Ojik et al. (1996) van Ojik, R., Roettgering, H. J. A., Carilli, C. L., Miley, G. K., Bremer, M. N., & Macchetto, F. 1996, A&A, 313, 25

| ID aaCatalog number from Kurk et al. (2004a). | RA | Dec | bbRest-frame equivalent width (in Å) estimated from the continuum-subtracted narrow-band observations of Kurk et al. (2004a), assuming that excess narrow-band emission is due entirely to Ly emission at . | ccContinuum-subtracted narrow-band flux (in 10-17 erg s-1 cm-2) measured by Kurk et al. (2004a). | Notes | |
|---|---|---|---|---|---|---|
| L46 | 31.6 | 3.4 | continuum | |||
| L54 d, ed, efootnotemark: | 2.145 | 24.2 | 7.1 | LEG P7 | ||
| L73 | 0.671 | 34.5 | 3.1 | [O III] 4959, 5007; H; starburst? | ||
| L127 | 18.9 | 2.2 | continuum | |||
| L184 | 22.5 | 4.4 | continuum | |||
| L286 | 265.0 | 2.6 | ND | |||
| L361 | 0.913 | 23.6 | 4.3 | [O II] 3727; [O III] 5007; broad H; H coincides with skyline; Seyfert 1? | ||
| L365 | 1.127? | 21.8 | 3.7 | 7927 Å emission line | ||
| L366 | 0.861 | 29.5 | 5.0 | H; C III] 1909; strong [O II] 3727; AGN? | ||
| L470 | 1.210? | 49.9 | 3.9 | 8235 Å emission line | ||
| L479 | 1.171 | 25.0 | 3.3 | [O II] 3727; weak H; starburst? | ||
| L484 | 96.6 | 1.4 | ND | |||
| L522 d, ed, efootnotemark: | 2.161 | 36.0 | 20.0 | LEG P856 | ||
| L565 | 0.496? | 28.2 | 3.9 | 5574 Å emission line | ||
| L674 | 269.4 | 2.6 | ND | |||
| L675 d, ed, efootnotemark: | 2.162 | 117.8 | 3.1 | LEG P1612 | ||
| L739 | 1.125? | 20.6 | 6.3 | 7919 Å emission line | ||
| L877 | 0.863 | 31.6 | 4.3 | [O II] 3727; narrow H; weak H + K abs; starburst? | ||
| L891 ee Listed as spectroscopically confirmed protocluster member by Pentericci et al. (2000). Note that we find that one of these objects (L891) may not in fact be at the cluster redshift. The catalog numbers in Pentericci et al. (2000) do not match those in Kurk et al. (2004a); where applicable the Pentericci et al. IDs (‘P’) are given in the Notes column. | 2.146? | 25.4 | 4.7 | P1557; see text | ||
| L941 | 0.800 | 32.0 | 3.3 | H; [O III] 4959, 5007; starburst? | ||
| L942 | 55.3 | 2.9 | ND | |||
| L980 | 1.171? | 113.1 | 4.7 | 8093 Å emission line | ||
| X2 | 0.000 | M-dwarf | ||||
| X3 L968 d, ed, efootnotemark: | 2.162 | 26.6 | 9.8 | AGN P1687 | ||
| X4 | 1.117 | [Ne IV] 2424; [O II] 3727; [Ne III] 3869; AGN | ||||
| X5 ddConfirmed cluster member. See Table 2 for properties of the observed emission lines. | 2.162 | ERO, AGN | ||||
| X9 | 1.512 | C IV 1549; He II 1640; C III] 1909; Mg II 2798; BL AGN | ||||
| X11 | 0.000 | M-dwarf | ||||
| X16 L778 ddConfirmed cluster member. See Table 2 for properties of the observed emission lines. | 2.149 | 314.2 | 67.6 | AGN | ||
| X17 | 0.000 | M-dwarf | ||||
| X18 ffHard X-ray source. All other X-ray sources in the table are soft (Pentericci et al., 2002). | 0.436 | Seyfert 2 |
Note. — Objects which were undetected in spectroscopic observations are marked “ND”. All listed lines were detected in emission. Right ascension and declination are given in hours, minutes, and seconds, and degrees, arcminutes, and arcseconds, respectively, for equinox J2000.
| ID | Line | (Å) | (Å) | FWHM (km s-1) | Flux (10-17 erg s-1 cm-2) | (Å) |
|---|---|---|---|---|---|---|
| L54 | Ly | 1216 | 3824 | |||
| L522 | Ly | 1216 | 3844 | |||
| L675 | Ly | 1216 | 3845 | aaNo continuum detected. | ||
| N V | 1240 | 3919 | aaNo continuum detected. | |||
| L891 bb Line identifications uncertain; this object may not be at the cluster redshift (see text). | Ly ? | 1216? | 3828 | ccAssuming . | ||
| [O II] ? | 3727? | 7176 | ccAssuming . | |||
| X3 L968 | Ly broad | 1216 | 3845 | |||
| Ly narrow | 1216 | 3845 | ||||
| N V | 1240 | 3923 | ||||
| C IV broad | 1549 | 4895 | ||||
| C IV narrow | 1549 | 4884 | ||||
| X5 | Ly | 1216 | 3845 | aaNo continuum detected. | ||
| X16 L778 | Ly | 1216 | 3829 | |||
| N V | 1240 | 3901 | ||||
| C IV | 1549 | 4873 | ||||
| He II | 1640 | 5157 | ||||
| C III] | 1909 | 6012 | ||||
| [C II] | 2326 | 7334 | ||||
| Mg II | 2798 | 8822 |
Note. — In contrast to Table 1, the values in this table are those measured from our Keck spectra.