A helium spread among the main sequence stars in NGC 2808
Abstract
We have made a detailed study of the color distribution of the main sequence of the Globular Cluster NGC 2808, based on new deep HST-WFPC2 photometry of a field in the uncrowded outskirts of the cluster. The observed color distribution of main sequence stars is not gaussian and is wider than expected for a single stellar population, given our (carefully determined) measurement errors. About 20% of the sample stars are much bluer than expected and are most plausibly explained as a population having a much larger helium abundance than the bulk of the main sequence. Using synthetic CM diagrams based on new stellar models we estimate that the helium mass fraction of these stars is . The newly found anomaly on the main sequence gives credit to the idea that GCs like NGC 2808 have suffered self–enrichment, and that different stellar populations were born from the ejecta of the intermediate mass asymptotic giant branch (AGB) stars of the first generation.
Enhancement and spread of helium among the stars in NGC 2808 have been recently suggested as a simple way to explain the very peculiar morphology of its horizontal branch. We find that if in addition to the stars, roughly 30% of the stars have distributed between 0.26–0.29 while 50% have primordial , this leads to a horizontal branch morphology similar to that observed. In this framework, three main stages of star formation are identified, the first with primordial helium content , the second one born from the winds of the most massive AGBs of the first stellar generation (), having , and a third one born from the matter ejected from less massive AGBs () with . There could have been a long hiatus (several 107yr), between the second and third generation, in which no star formed in the protocluster. We suggest that, during this period, star formation has been inhibited by the explosion of late Supernovae II deriving from binary evolution.
1 Introduction
Chemical inhomogeneities in globular cluster (GC) stars are giving new evidence on the formation and evolution of these most ancient stellar systems. Self– enrichment mechanisms are being examined as some of the possible—and most plausible—causes of the abundance spreads seen in many GCs. In these clusters, light elements that are susceptible to abundance changes from proton- capture reactions, such as the pp, CN, ON, NeNa, and MgAl cycles, exhibit star- to-star abundance variations, far in excess of the modest variations seen in halo field stars—see, e.g., Sneden (1999, 2000); Gratton, Sneden & Carretta (2004). In some cases these abundance spreads are seen in stars near the turnoff and along the subgiant branch (e.g., Gratton et al., 2001), suggesting that these anomalies arise from some process of self-enrichment occurring at the first stages of cluster life. This is generally attributed to pollution from the winds of the massive AGBs (e.g. Cottrell & Da Costa, 1981; D’Antona, Gratton, & Chieffi, 1983; D’Antona, 2003), whose convective envelopes are subject to hot bottom burning (HBB) (e.g. Ventura et al., 2001; Ventura, D’Antona, & Mazzitelli, 2002). So these envelopes are an ideal environment to manufacture elements through nuclear reactions in which proton captures are involved.
While problems persist in obtaining a quantitative reproduction of the observed abundance spreads (Denissenkov & Herwig, 2003; Ventura et al., 2004; Fenner et al., 2004; Ventura & D’Antona, 2005a), a high helium abundance in the ejected matter is a robust prediction of the models (Ventura et al., 2001; Ventura, D’Antona, & Mazzitelli, 2002). D’Antona et al. (2002) have shown that the hypothesis that GC stars were formed in two different star formation events can explain the presence of long blue tails in the horizontal branches (HB) in GCs with large abundance anomalies (Catelan & de Freitas Pacheco, 1995). In their scenario the bluer HB stars are born from the helium rich stellar population. In addition, D’Antona & Caloi (2004) have shown that the peculiar bimodal distribution of stars in the cluster NGC 2808 can be explained in the same way, by assuming that the cluster contains today about half stars belonging to the first stellar generation, and about a half born from the AGB winds, whose initial helium abundance is larger than and extends up to .
The suggestion that helium is a possible second parameter for globular cluster stars (see Rood, 1973; Rood & Crocker, 1989; Fusi Pecci & Bellazzini, 1997, for a general overview) has been reinforced by the discovery that the complex object Cen has at least two different components of the main sequence (MS) and multiple turnoffs, (Bedin et al., 2004; Ferraro et al., 2004) and that the bluer MS can be explained by a metal enriched and helium enriched population (Norris, 2004).
In contrast to Cen, NGC 2808 does not show a metallicity spread (Carretta, Bragaglia & Cacciari, 2004). The comparison of isochrones differing in helium for the turnoff (TO) and MS in D’Antona & Caloi (2004) showed that it is not easy to dismiss the hypothesis of differences in helium content among NGC 2808 stars. Indeed they predicted that one could observe a color bifurcation in the MS and/or in the subgiant branch, if there are at least two homogeneous groups of stars with different helium abundance. To investigate this possibility we have used HST/WFPC2 photometry of a field in the outskirts of NGC 2808 to obtain a deep, high precison Color-Magnitude diagram of the main sequence. Since we were searching for a spread in the sequences we also performed an extensive error analysis.
We find that % of the MS stars of the cluster lie to the blue of the bulk of the MS. The blue outliers must be due to an intrinsic difference between the stars (Sect. 2). In Sect. 3 and 4 we suggest an interpretation of these anomalous MS stars and of the HB morphology of the cluster within the context outlined above. In Sect. 5 we discuss and summarize the results.
2 Observational results
We reduced a dataset of four s plus three s F555W images and four s plus three s F814W images, obtained with the WFPC2 on board of HST. The images were acquired adopting a dither pattern that allows a virtually total cleaning of cosmic ray hits and chip defects. The field is located at from the center of the NGC 2808 (GO06804). The field samples the outskirts of the cluster, at core radii () and half-light radii from the center (Trager, Djorgovski & King, 1993) and it appears relatively uncrowded when imaged with the superb spatial resolution of the WFPC2. This allowed us to obtain excellent photometry down to the faintest detectable stars, since sources confusion were not a concern. The pre-reduced (flat, bias) images provided by the STScI were reduced individually with HSTPHOT (Dolphin, 2000), a Point-Spread- Function fitting package specifically suited for WFPC2 images. HSTPHOT automatically provides accurately calibrated and CTE-corrected photometry. In the following we will only refer to the photometry calibrated in the Johnson-Kron-Cousin system, hence in and instead of F555W and F814W.111The results we present also hold if we maintain the flight system colors, that is, they are not an artifact of the color transformations. The adopted threshold for source detection on the frame was 3 above the background. For each filter, the four catalogs from the long-exposure images were cross-correlated and the average of the individual measures was taken as the final magnitude estimate, and the standard deviation was taken as an estimate of the photometric error. Only stars that were detected and successfully measured in at least 3 images were retained in the final catalog of average magnitudes. We proceeded in the same way for the short-exposure images, in this case the retained sources were present in at least two images. The and catalogs of the long and short exposures were then coupled and finally the long and short catalogs were merged after a careful relative photometric calibration. In the final global catalog all the sources with are from the long exposures, those with are from the short ones. Note that the results presented in the following utilize only stars with , hence extracted from the homogeneous set of the long-exposure images. Note also that the selection criteria described above ensure that the final dataset is essentially free from spurious sources, since only stars with at least three measures in and 3 measures in are included in the final catalog, for .
2.1 Color Magnitude Diagram and artificial stars experiments
The Color Magnitude Diagrams (CMD) obtained from each WFPC2 camera are shown separately in Fig. 1. The points of the overplotted ridge-lines have been obtained as 2 clipped averages in color over magnitude boxes, as described in Ferraro et al. (1999). For each of the four subsamples (PC, WF1, WF2, WF3) we derived a separate ridge-line to account for any subtle camera-to-camera systematic difference in the photometry. Such effects typically amount to mag. A ridge line for the total sample has also been derived with the same tecnique.
The CMDs are clearly dominated by the narrow and well defined cluster sequences: the Sub Giant Branch (SGB) and the base of the Red Giant Branch (RGB) for , the Turn Off (TO) point around and the Main Sequence going from to . A handful of foreground Galactic stars is visible in the CMDs of the WF cameras, a couple of magnitudes above the cluster MS. A sparse sequence running parallel to the MS, mag to the red of it, may be due to a mix of blended MS stars and real binary systems (see Bellazzini et al., 2002, and references therein).
On the other hand, there is a sizable fraction of MS stars scattered to the blue of the ridge lines. No obvious observational effect can possibly push a cluster star in this direction. It is worth noting that while HSTPHOT should be the ideal choice for the present application, we repeated the data reduction using DoPhot (Schechter, Mateo & Saha, 1993), following the prescriptions by Bellazzini et al. (2002), and Sextractor (Bertin & Arnouts, 1996): the unexpected blue stars appeared the same in the CMDs obtained with these codes, hence their anomalous color cannot be due to some subtle effect associated with the reduction process. These blue MS stars are the main subject of the following subsections.
To accurately characterize all the effects due to the observations plus data reduction processes and to have an idea of the completeness of our sample we performed an extensive set of artificial star experiments on one , and one images from the long exposure set. The artificial stars were distributed according to the observed spatial distribution and luminosity function, as described in Dolphin (2000), and were added simultaneously in the and frame at the same position, hence artificial stars have a properly defined color (as in Bellazzini et al., 2002). In several runs we accumulated a total of 91,680 artificial stars, 30,221 of which have input magnitudes and colors within mag of the cluster ridge-line (hereafter Similar Sample). We used the latter subsample to study in more detail the MS stars we are interested in. The average of and of computed in mag boxes were taken as the typical photometric errors in magnitude and color, respectively, and are plotted as error bars in the various panels of Fig. 1. The average errors derived from the artificial star experiments are in excellent agreement with the standard deviations obtained from the repeated measures described in § 2.
The completeness is larger than 80% for for all the considered subsamples. Since we limit the following analisys to , we are well within a nearly-constant completeness regime, more than one magnitude brigther than the limit at which the completeness begins to fall rapidly to zero (around ). The derived completeness function slightly overestimates the actual completeness, because of the severe selection criteria applied to the observed sample, nevertheless it gives a clear indication of the magnitude range in which the completeness is high and essentially constant with magnitude. Analogously, the photometric uncertainty as estimated from the artificial stars is in principle slightly larger than the actual values, since in the observed sample each magnitude is the average of at least three independent measures. However it provides an independent check on the photometric accuracy and very stringent constraints on the distribution of photometric errors, for instance on the symmetry between the errors that make a given star bluer or redder than it was in input (see below).
2.2 Blue Main Sequence stars
In Fig. 2 we compare the observed global CMD (stars from all the cameras) with a CMD with the same number of stars randomly extracted from the Similar Sample of artificial stars.
The synthetic CMD in the right panel of Fig. 2 was obtained as follows: (a) each extracted star was assigned the color of the cluster ridge-line at the corresponding by spline interpolation; (b) the corresponding (positive or negative) was added to the assigned color; (c) was substituted by . In this way we reproduce the effects of observations + data reduction on a parent population of stars that were exactly placed on the cluster ridge-line, as in Bellazzini et al. (2002). In both panels we also show for reference, the ridge-line of the global sample shifted by mag in .
The comparison between the observed and synthetic CMDs shows that the excess of stars to the blue and to the red of the MS described above cannot be due to observational effects but are intrinsic to the observed sources, instead. Hence, the observed population must include (1) a non-negligible fraction of real binary systems that appears as the usual parallel sequence to the red of the MS, and (2) a significant population of stars scattered blueward of the MS in the whole sample from . The origin of this anomalous blue MS population is unkown.
In order to quantify the frequency of the blue MS stars, we study, in Fig. 3, the distribution of color deviation from the cluster ridge-lines (), separately for each subsample (camera), in the range where the effect is more clearly visible (). To disentangle the various components of the MS we subtract from the observed distributions gaussian curves with equal to the typical error in color in that magnitude range. These gaussians well fit the core of the distributions as shown by the small residuals in the few central bins. The residuals of the subtractions having are divided by the total number of stars in the distribution to obtain the fraction of blue stars () and the same is done for residuals (). The population of blue MS stars clearly emerges in all the samples as a clear bump in the residuals containing % of the whole MS stars in the considered magnitude range.
It is interesting also to compare, in the same magnitude range, the symmetry properties of the observed color deviations from the ridge line with those derived from the artificial stars shown in Fig. 2. In this case we call the number of stars having negative and the number of those with positive . The total observed sample has , clearly indicating an excess of blue stars, while the deviations of the artificial stars sample are extremely symmetric, having . The difference between the two values is significant at the 4.4 level. Analogously we find for the observed sample, to compare with of the synthetic one.
2.3 A possible role of differential reddening?
The interstellar extinction toward NGC 2808 is quite large for a halo globular cluster ( mag Harris, 1996), hence we address the question of wheater small scale variations of reddening could lead to the observed difference in color among MS stars (blue vs. “normal” MS). There are two pieces of observational evidence against this hypothesis: first, Blue MS stars are evenly spread over the whole field and do not show any particular clustering property (see also Fig. 4 below: however, this is not a strong argument, as the interstellar dust is distributed in sheets and filaments, and may vary on angular scales of arcseconds); second, and more relevant, the color spread along the MS occurs just for (see Fig. 1 and Fig. 2). If differential reddening were the cause of the color spread we would observe it in any region of the CMD and, in particular, it should be very evident in the nearly vertical portion of the sequence around the Turn-Off point (–20.0). On the contrary the MS is clearly unimodal there and displays a color distribution fully compatible with what expected from the photometric errors alone (see Fig. 2).
Given the above evidence, we conclude that the anomalous population of Blue Main Sequence stars is not due to the presence of differential reddening in the (small) field considered here.
2.4 Radial distribution
While the sampled field is so small () that the contamination by any possible system other than the cluster itself should be negligible, the membership of the blue MS stars to NGC 2808 must be established. This is particularly relevant in the present case, since the cluster may be physically associated with the newly discovered Canis Major galaxy (Martin et al., 2004) and, in any case, is projected in the same area of sky of this stellar system whose optical CMD display a narrow and well defined MS, with a TO around (Bellazzini et al., 2004; Martinez-Delgado et al., 2004). The only way to assess this point with our data is to compare the radial distribution of blue MS stars with that of ordinary MS cluster stars.
If blue MS stars are cluster members they must be distributed as any other star of NGC 2808; on the contrary, if they belong to a system with a much larger size (as Canis Major or any known Galactic component) their spatial distribution should be approximately uniform over the observed field.
The results of this test are shown in Fig. 4. In the upper panel we show the adopted selection, stars to the blue and to the red of the shifted ridge-line, while the cumulative radial distributions are displayed in the lower panel. The distribution of blue MS stars is indistinguishable from that of normal MS cluster members and is strongly different from an uniform distribution over the considered field. A Kolmogorov-Smirnov test yields that the probability that the blue MS sample is drawn from a uniformly distributed population is . Hence blue MS stars must be associated to NGC 2808.
In conclusion, we have observationally established that % of genuine MS stars of NGC 2808 are intrinsically bluer than the main locus of most of the other MS stars of the cluster. In the following sections we suggest an interpretation of this unexpected and puzzling observational result.
3 The theoretical models and the simulations
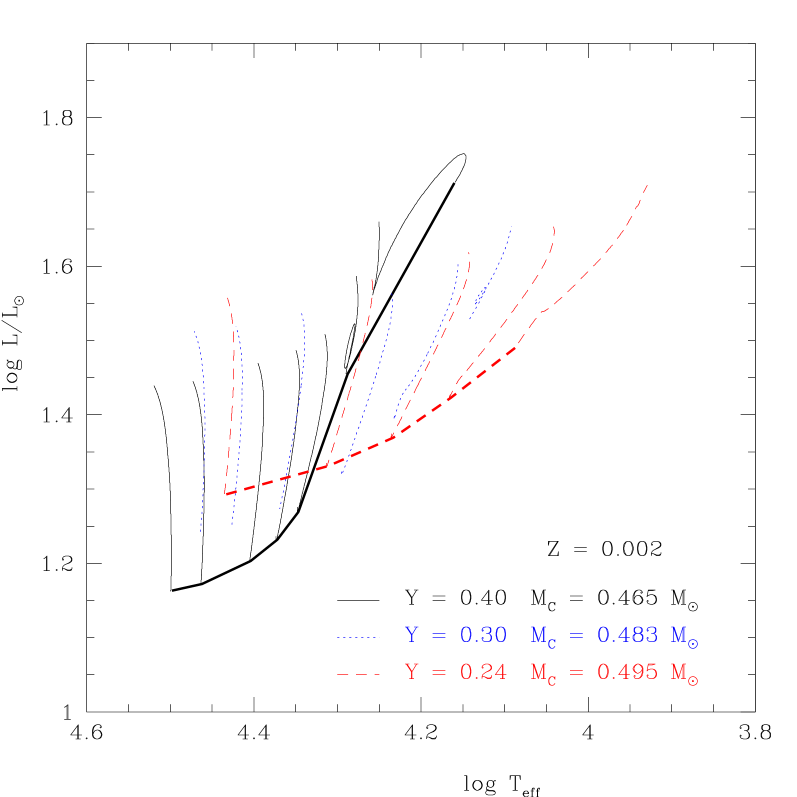
We computed new HB models, in addition to those presented in D’Antona & Caloi (2004), namely the models with . The core mass at the helium flash for GC ages (12–13 Gyr) is in this case , compared to for . Extreme HB stars in which only core helium burning is active, with the H-shell not contributing to energy generation are about 0.4 mag magnitude fainter for than for . HB stars with can extend to the faintest blue clump of the HB of NGC 2808, by assuming a H-envelope of the order of around the helium burning core of 0.465 (ZAHB luminosity , K, see Fig. 5). Synthetic models for the HB are computed following the procedure described by D’Antona & Caloi (2004).
For the MS study, we computed stellar models down to 0.3, to construct isochrones for metallicity and helium content and 0.40, and for metallicity , for and 0.40. The input physics is described in D’Antona and Caloi (2004). Models for are built by making use of a new equation of state based on Saumon, Chabrier, & van Horn (1995); Rogers (2001); Stolzmann & Blöcker (1996, 2000) computations.
Synthetic models for the cluster main sequence, turnoff and subgiant population are built by interpolating among the isochrones with various assumptions about the helium content. We fix the age of the cluster, and the stellar mass is randomly extracted from a power law mass function (results will be shown for an exponent –1.5, in the notation in which Salpeter’s index is –2.3; in any case, the choice of the mass distribution has no influence for the specific problem of this work). The number of stars for each chosen helium content is fixed a priori, and the resulting color distribution is compared with the observations, to choose the most appropriate ones. After each determination of magnitude and color, we apply an error extracted from a normal distribution with standard deviation chosen according to the observations.
In running the simulations of the MS color distribution we employed the following procedure: we first took the distribution of a sample of stars with standard helium abundance , then we added stars with increasing helium content, in order to reproduce reasonably the observed distribution in color. Our first aim is to reproduce the MS, including the blue MS stars. At the same time, we have also to worry about the observed HB morphology. Therefore, we will finally adopt helium distributions such that they are consistent both with the MS colors and with the two main features of the HB, the gap at the RR Lyrae and the distribution of stars in the EBT1 and EBT2+EBT3 blue clumps (we follow the definitions by Bedin et al. (2000)). Of course, any which reproduces the HB but not the MS colors is not allowed, and viceversa. We ran simulations for both and , finding similar results for the MS color distribution.
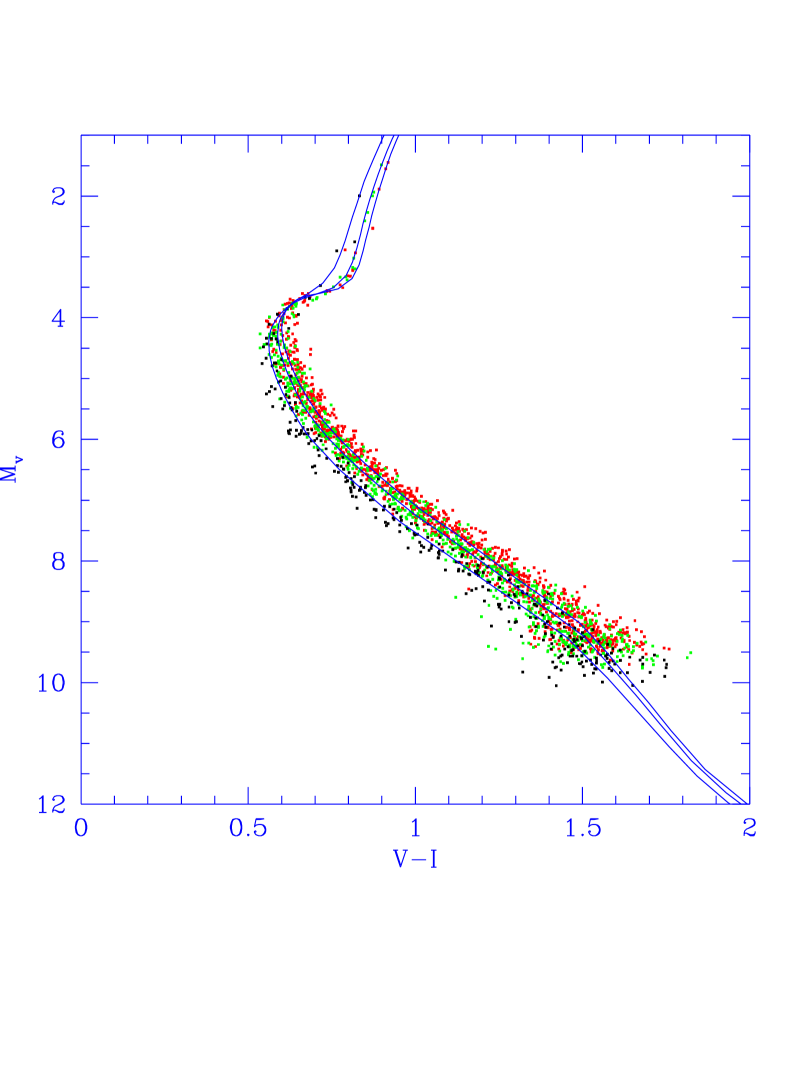
We show in Fig. 6 a simulation of the turnoff and MS, made according to the above described method, in which the N(Y) follows the distribution given in Fig. 9, which will be discussed in Sect. 3.1. We superimpose the isochrones of 13Gyr, . A look at Fig. 6 shows an important feature. The theoretical isochrones with variable helium and fixed age converge at the TO region. This implies that, if helium variations are responsible for the blue main sequence subsample, significantly bluer than the MS ridge line and fainter than the TO, the intrinsic dispersion of the data at the TO should be negligible and due just to photometric errors. Examination of Fig. 1 and Fig. 2 shows that this is indeed the case. The TO region in the CMD of NGC 2808 (V), is vertical and extremely narrow in color, and essentially no blue outlier is detectable.
3.1 The distribution in color: the MS
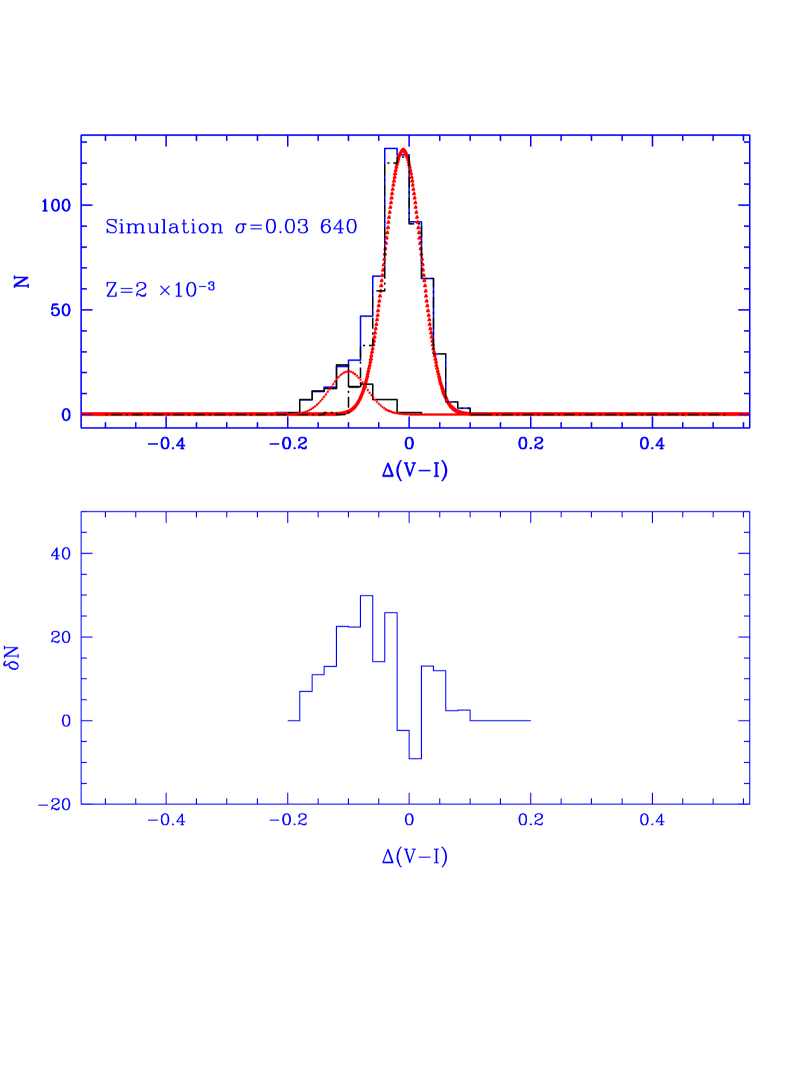
In Fig. 7 we show the color distribution corresponding to the simulation in Fig. 6, in the magnitude range . In order to reproduce the MS observations, it would suffice to consider simply two helium values: =0.24 for the vast majority of stars (–85%), and for the remaining fraction. However, in the simulation, we do not assume a unique Y=0.24 for this main fraction of stars, because of the necessity of reproducing the HB morphology, but the shown in Fig. 9 for . The small additional scatter in the MS is consistent with the observed color distribution having observed standard deviation =0.03, which means that it remains hidden within the photometric errors. This follows from the fact that, in the models,
| (1) |
Thus, the color of stars having, e.g., =0.275, is shifted, with respect to a MS with =0.24, only by –0.015mag.
According to Eq. 1, the blue MS can be reproduced only by adding a group of stars (from % to %, see Fig. 3) with . This additional group of stars is absolutely necessary: in fact, had we adopted a more or less uniform spread in helium, it would have produced too many stars at and not enough stars at . The specific value should not be taken as a precise quantitative estimate, as our models suffer from at least one important uncertainty: the color versus relationships are based on models by Bessell, Castelli, & Plez (1998), which are built with normal helium content.
3.2 The distribution in color: the HB
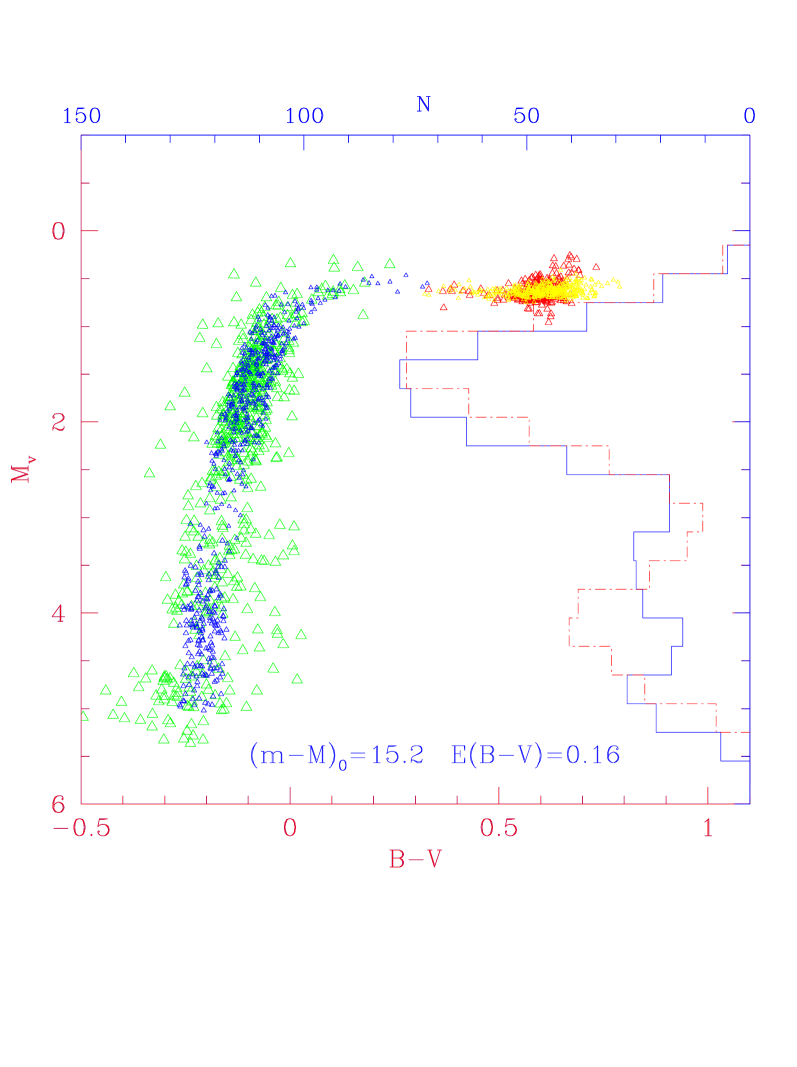
The distribution illustrated above and displayed in Fig. 9 is chosen in order to reproduce the HB morphology, at a first-order approximation. In particular it allows to obtain the observed lack of HB stars in the RR Lyrae region and the distribution of stars of the clump EBT1 Bedin et al. (2000). In summary: (1) % of the stars has ; these stars account for the blue MS population and populate the EBT2 and EBT3 clumps of the HB; (2) % of the stars have , and (3)% of the stars have in the range . The addition of the latter stars —not required by the observed MS morphology— does not significantly worsen the MS fit, as discussed above. Fig. 8 shows that it also reproduces quite satisfactorly the HB general morphology. Comparison of the full HB simulation is made with the Bedin et al. (2000) observations.
The interesting result from the global simulation is that the reproduction of the MS color distribution, coupled with a good description of the whole HB morphology, naturally leads us to the conclusion that about 15–20% of the cluster stars has a helium content , and shows up both in the MS color distribution (Figure 7, the bluest MS stars), and in the HB, where it shows up in the two blue HB tails, EBT2 and EBT3.
Notice that we can not reproduce the gap between EBT2 and EBT3, but only the total number of stars. However, it is not straightforward to obtain the correct star distribution in these two HB regions. If we interpret observations in terms of mass distribution of stars with , we find that the the population in EBT3 arises from only one mass, of about 0.466 , which evolves vertically (see Fig. 5) more or less at constant pace, covering the observed faintest blue region. A spread in mass necessarily fills up the gap between EBT3 and EBT2222Lee et al. (2005) attribute the EBT2 and EBT3 clumps to two populations differing in helium content, but they do not explain why each of these should have practically a unique evolving mass.. For the latter group of stars the situation is not very different: the bulk of it is confined between 0.48 and 0.49 . A possible interpretation is to consider EBT2 stars as deriving from red giants which develop the helium flash at the tip of the giant branch, that is, “normal” HB stars. With an evolving giant of about 0.63 , the mass loss involved is of about 0.15 and the envelope mass of about 0.015 , sufficient for a standard helium flash. Larger mass losses would give origin to early or late hot flashers, as defined and discussed by Castellani & Castellani (1993), D’Cruz et al. (1996), Brown et al. (2001), that is, stars in which the core-helium flash takes place, either at the beginning or later, along the white dwarf cooling sequence. In this respect, a fundamental piece of information comes from the observations by Brown et al. (2001) and Moehler et al. (2004). In particular, Moehler et al. (2004) obtained spectra of EBT3 members, finding evidence both of the high surface temperatures (35000 K and more) and of the large surface abundance of helium and carbon, expected as a consequence of the mixing during the late core-helium flash (Sweigart 1997). This appears to decisively settle the question as to the origin of these stars.
On the other hand, the simulation shown in Fig. 8 has a problem: we have to assume a mass loss of during the RGB evolution, in order to reproduce the red side of the HB with models and the clump EBT1, with the assumed . Then the mass loss has to be reduced to only to account for the extreme blue tails with . If the mass loss regime does not change too much with helium content, the evolving giants should leave the giant branch before reaching the conditions for the core-helium flash. On the contrary, the difference between the fraction of blue MS stars and the fraction of EBT2+EBT3 stars may amount to %, according to our and Bedin et al. (2000) observational estimates. This is just one of the many questions and problems that this exploratory investigation leaves open. If the helium content of the blue MS could be reduced to , the mass loss problem would be practically solved. We have already noticed the uncertainties in the color- transformations, which might depend on , not taken into account in the model atmospheres.
At this stage we can not pretend to explore all the details of the HB morphology of this cluster, as there is a number of parameters (mass loss included) which certainly influence it (Rood 1973, Fusi Pecci et al. 1993, Fusi Pecci and Bellazzini 1997). Nevertheless, we stress that the quantitative reproduction of the main anomalies, both of the MS (blue MS stars) and of the HB (red HB, gap at the RR Lyrae, blue HB with extreme blue tails) indicates that the proposed interpretation in terms of helium variations is one of the most promising proposed till today.
4 The star formation events in NGC 2808: a new global scenario
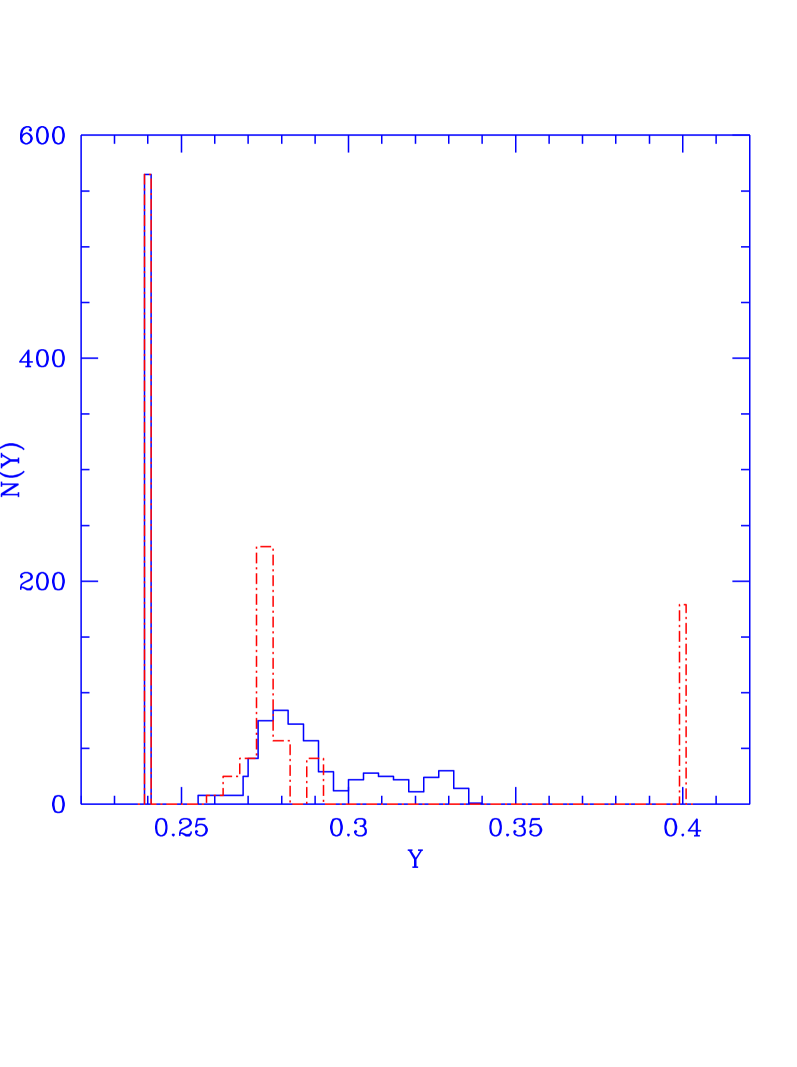
The result of this work provides a new piece of information on the early stages of formation of stars in GCs. In D’Antona & Caloi (2004) we had hypothesized a more or less continuous star formation starting after the period of supernovae II explosions. After a few yr the slow winds from massive AGB stars would begin to collect helium enriched material in the cluster core and form stars.
Fig. 9 shows the comparison between the suggested in D’Antona & Caloi (2004) and that derived in this work. The latter seems to depict a situation very different from the continuous star formation. However, it should be preferred since the MS color distribution is a much better determinant than the HB distribution for deriving . The HB distribution depends on many parameters other than so it can never yield a unique .
The HB distribution does suggest that NGC 2808 probably underwent three main stages of star formation. The first one is easily identified with the main burst of star formation, and is now probed by the low mass stars with primordial helium content (), which constitute % of the MS and populate the red HB clump. The second burst in chronological order results in the 15–20% of population at . Finally, there is a third stage of star formation producing % of the stars with helium larger than the primordial value up to about . These stars populate the HB clump EBT1.
The reason why the stars from the second burst of formation have the highest is simply that the helium content in the AGB envelopes increases with the initial stellar mass, due to the higher efficiency of the second dredge up (Ventura, D’Antona, & Mazzitelli, 2002). Ventura & D’Antona (2005b) estimate for their most massive models (6.5 ) for metallicity . This value can be considered conservative, as their models do not include any kind of overshooting, which may easily increase the helium content to the required value of . Lattanzio et al. (2004) find 0.36 from the evolution of a 6 with . In addition the episodes of third dredge up may help to increase the helium content in some models (Ventura & D’Antona, 2005a). Notice also that would reduce the problems in the reproduction of the blue tails EBT2 and EBT3 (see Sect. 3.2). Therefore we suggest to identify the population with extreme helium abundance () as the stars born from the winds of the most massive AGB stars, which evolve Myr after the first burst of star formation.
The third group of stars may be the result of star formation from the winds of somewhat smaller mass AGBs. If we rely on the AGB models by Ventura, D’Antona, & Mazzitelli (2002), the best mass range for these objects is from to , which evolve at ages –150 Myr after the first burst of star formation. Hence, the “intermediate” helium rich stars are the third stage of star formation in chronological order.
We are aware that this scenario requires an initial mass function of the first burst of star formation strongly weighted towards intermediate mass stars, in order to get the necessary amount of helium enriched ejected matter. This aspect of the problem has been extensively discussed in D’Antona & Caloi (2004).
4.1 The possible role of delayed Type II Supernovae explosions in binaries
In our scenario there are no stars formed with helium . Naively one would expect that, as the cluster ages, the mass of the AGB stars decreases as does the helium abundance in the winds and in the newly born stars. If the formation of new stars is continuous why do we not observe stars with all values between 0.29 and 0.40? We briefly consider three possible answers.
First of all our modeling of AGB stars is not so secure to exclude discontinuities in the helium content of the AGB ejecta. In fact, some of the models (Ventura, D’Antona, & Mazzitelli, 2002, Fig. 4) show a non-linear correlation between the evolving mass and the helium yield. Depending on the efficiency of star formation, on the modalities of mixing of the intracluster material ejected from the AGBs, and on the initial mass function of the AGB stars, there could be a relative rarity of stars in some helium abundance ranges.
Secondly, it is possible that external events are needed to trigger the star formation phase. In this case, after a first trigger when , the gas from the AGB ejecta goes on accumulating in the cluster central regions for a long time (several tens of million years) until the second trigger occurs when the average helium content in the gas is reduced to .
A third possibility requires a bit more of explanation. The uniform metallicity of GC stars is generally attributed to the fact that the explosion of type II supernovae do not pollute the gas from which the stars are formed, probably because they bring an end to the first burst of star formation by clearing from the gas the intracluster medium. Type II supernova continue until all single stars with (where is the maximum mass for white dwarf formation) have exploded. At that time the low velocity winds from the evolving AGB stars begin to accumulate in the core, and give origin to the second stellar generation with . This can last until there are new type II supernova explosions from evolving binaries which again expel the gas from the cluster.
Mass exchange between the components of primordial binaries can push the mass accreting component with initial mass , to a mass converting it to a Type II supernova progenitor. The timing of such supernovae is set by the time it takes the primary with mass to reach the AGB. They can continue until mass exchange is no longer capable of pushing the accreting star above . To place a limit on this time scale, we assume that all the primary mass—apart from its white dwarf remnant—is transferred to the secondary, and that the secondary initially has a mass comparable to the primary. We obtain:
| (2) |
For and , the primary mass must be larger than 4 . While a more precise estimate of this value is needed, but it is not inconsistent with our claim that we expect the winds to begin again a third star formation epoch when .
The hypothesis of late supernovae II explosions may be an important ingredient in the GC evolution. In particular, decreases for smaller metallicities: this may explain the smaller degree of chemical abundance varations in the lowest metallicity clusters, as the late Type II supernova from binary evolution will last in the cluster for a longer time (see equation 2), preventing star formation for such a long time that the conditions for producing a new stellar generation, in addition to the first burst, become more difficult.
5 Discussion and conclusions
We have presented HST observations of the MS of the GC NGC 2808, which provide important new evidence concerning the early evolution of GCs. 15–20% of the MS stars is bluer by than the bulk of the MS stars (80–85%) whose colors follow a normal distribution with standard deviation consistent with the observational errors. The blue MS are most simply interpreted as a group of stars substantially coeval with the other cluster stars (Myr), but having helium abundance . The two most obvious anomalies of the CM diagram of NGC 2808, namely i) the blue MS stars and ii) the very peculiar morphology of the HB, can be simultaneously reproduced by means of the variations of the single parameter .
This is not the first time that the helium content is proposed to play a role in the MS morphology. In Cen, the presence of a high helium MS has been suggested (Bedin et al., 2004; Norris, 2004) as one of the possible components needed to explain the complexity of this cluster, where multiple turnoffs and red giant branches have been detected (see, Lee et al., 1999; Pancino et al., 2000; Ferraro et al., 2004; Bedin et al., 2004; Sollima et al., 2005, and references therein).
Recently, on the basis of the magnitude difference between the turnoff and the red giant bump, Caloi & D’Antona (2005) have proposed a difference in the global helium content of M3 and M13, and have shown that such interpretation provides subtle and consistent differences in the turnoff morphologies. The higher helium in M13 can also account for its much bluer HB.
In NGC 2808, the evidence for a high helium population is much more compelling than in the other quoted cases, as the cluster could have been considered a standard “simple stellar population,” having no metallicity spread (in terms of Fe and alpha elements, see, Carretta, Bragaglia & Cacciari, 2004, and references therein) 333In addition to the 20 stars examined in Carretta, Bragaglia & Cacciari (2004), Carretta, Bragaglia and Gratton (private communication) have now reduced 123 high resolution spectra of red giants in NGC 2808: according to this new analysis, the maximum metallicity spread allowed by the data amounts to a few hundreths of dex ()., contrary to the Cen case. In addition, the evidence is based on relative photometric measurements of the MS, and not on comparison of different clusters CM diagrams, as in the case of M3 and M13.
The case for cluster self-enrichment from the ejecta of massive AGB stars, is strengthened by the present discovery of a high helium population (see also Carretta et al., 2003; Carretta, Bragaglia & Cacciari, 2004, and references therein, for other possible signatures of early self- enrichment). The enrichment in helium is one of the more robust predictions in the computation of the stellar yields from AGB stars and is much less model dependent than the processing of the CNO and of the other proton-capture elements (Ventura et al., 2001). The precise abundance of the high helium population depends on the color– transformations, and we urge the computation of model atmospheres with the cluster chemical abundances and taking into account helium enhancement.
While it is common knowledge that helium abundance affects many phases of GC evolution, it has generally been ignored in the studies of globular clusters in the last decades. Our results suggest that helium abundance may play a major rôle in determing differences in the populations of different clusters and within the population of a given cluster, hence its possible influence cannot be neglected.
We propose a possible scenario that simultaneously accounts for the anomalus MS and HB observed in the CMD of NGC 2808 in terms of variations of helium abundance. Our scenario suggests three main stages of star formation in NGC 2808, all of them globally lasting not more than 200 Myr: a first burst at the Big Bang abundance , a second one from the gas of the most massive AGBs at , and a third one from less massive AGBs, having from down to and a distribution peaked at . In this framework, the late binary supernova II explosions may play a major rôle in producing the postulated discontinuity in helium abundance between and .
We must be careful not to over interpret our results. The existence of the high helium () population seems robust since it is based both on the MS spread and HB morphology. The intermediate helium population is inferred only from the HB morphology. Some support is given by the fact that the reddest stars of the blue HB are slightly more luminous than the red clump stars. The different luminosities result naturally from the slight difference in the of the red clump and the red side of the blue HB (D’Antona & Caloi, 2004). However, as also our discussion shows, the interpretation of HB morphology is always intertwined with the question of mass loss. Hence, independent observational evidence is required to check the actual existence of this intermediate- population. In this respect, we consider the cluster RR Lyr variables. Recently their number has been raised from 2 to 18 (Corwin et al., 2004). The mean periods of RRab and RRc pulsators are 0.563 d and 0.30 d, respectively; the ratio is about 0.44. The latter value would favor a classification of RR Lyrs as Oosterhoff II type, while the mean periods indicate an Oosterhoff I type. The mean periods suggest for these variables a luminosity close to that in other OoI GCs like M3 and M5. Since for the stellar population in the latter clusters (at least for its bulk) there is no indication of a larger than cosmological helium abundance, the RR Lyr periods observed in NGC 2808 may be considered an indirect hint for a close to normal value of . This is not a surprise, as the RR Lyr could be the bluest extension of the red clump population, which has a normal , but unfortunately, does not provide us any further support for the existence of the intermediate population.
Our observations suggest a possible observational strategy to search for the effects of early nucleosynthesis in GCs. Why a clear main sequence bimodality has been discovered so far only in this cluster and in Cen? First of all, the signal of an extreme helium rich population is very weak, and requires deep and accurate photometry in uncrowded regions of massive globulars. Only by means of these observations we may reveal the same signature observed in NGC 2808, e.g., an anomalous blue population in the sloped part of the MS with no counterpart in the TO region. Obvious candidates may be clusters with multi-modal HB morphology as NGC 1851, NGC 6441 and NGC 6388, but the first cluster has no published HST photometry, and the test may result unfeasible for the latter two clusters, because they are significantly affected by differential reddening that may smear out a subtle signal as the one put in evidence in the present analysis (Rich et al., 1997). In any case, the spatial resolution and photometric accuracy required to identify a minor component of anomalous MS stars within a globular cluster are quite challenging and it may turn out that the interesting clusters accessible with this technique are very few. The individual history of each cluster will also affect the consistency of the extreme population: if it is as low as, say, 10% of the total, it can easily pass unnoticed. Notice that even HST main sequence photometry is useless to discriminate stars with helium contents from =0.24 to =0.28, although such a small spread corresponds to large CNO and sodium anomalies (see, e.g. the models by Ventura, D’Antona, & Mazzitelli, 2002)s.
Finally, we want to draw the attention of the readers to a few interesting facts that may be intimately related with the above results and discussion. First, it is worth noting that the extreme blue HB becomes fainter and fainter with increasing helium abundance and the ZAHB loci at various intersect each other (see Fig. 5). As a consequence the group of HB stars fainter than the “normal” ZAHB detected, e.g., in Cen and in NGC 2808 with UV observations (D’Cruz et al., 2000; Brown et al., 2001) could perhaps be intepreted as belonging to a sub-population having an helium abundance higher than those populating the “normal” ZAHB, in agreement with the suggestions put forward to explain the other main branches (Norris, 2004).
Second, Fusi Pecci et al. (1993) pointed out a correlation between the extension of blue HB tails and the integrated absolute magnitude of globular clusters, particularly evident when the sample is restricted to clusters with intermediate metallicity () where, as discussed in that paper, the sensitivity to any second parameter effect is better visibile. If self-enrichment (and multiple bursts of star formation) can increase the helium abundance of subsamples of stars, it seems quite natural to imagine that more massive (and/or more concentrated) clusters would be more effective in keeping the helium-enriched ejecta of AGB stars, and, in turn, more efficient in producing stars populating the bluest part of the HB.
Third, Burstein et al. (2004) found that there is a marked difference in nitrogen abundance for the stars in the old M31 GCs relative to those in the oldest Galactic GCs. As they noted, the M31 GCs for which very strong NH absorption has been detected have absolute luminosities ranging from to , i.e., are very bright and massive. Therefore, it can be conceived that this peculiar enhancement is indicative of a corresponding higher helium abundance as, within the framework described here, nitrogen and helium enhancements could result from the self-pollution occuring during the first stages of cluster life.
In conclusion, while we are not claiming that the whole variety of not- fully-understood phaenomena encountered in Galactic globular clusters can be explained in terms of variations in helium abundance, the case of NGC 2808 strongly indicates that such variations do occur in real clusters and early AGB nucleosynthesis may play a significant rôle in the evolution of, at least, some of them.
References
- Bedin et al. (2000) Bedin, L. R., Piotto, G., Zoccali, M., Stetson, P. B., Saviane, I., Cassisi, S., & Bono, G. 2000, A&A, 363, 159
- Bedin et al. (2004) Bedin, L. R., Piotto, G., Anderson, J., Cassisi, S., King, I. R., Momany, Y., Carraro, G. 2004, ApJ, 605, L125
- Bellazzini et al. (2002) Bellazzini, M., Fusi Pecci, F., Messineo, M., Monaco, L., Rood, R.T., 2002, AJ, 123, 1509
- Bellazzini et al. (2004) Bellazzini, M., Ibata, R., Monaco, L., Martin, N., Irwin, M.J., Lewis, G.F., 2004, MNRAS, 354, 1263
- Bertin & Arnouts (1996) Bertin, E., Arnouts, S., 1996, A&AS, 117, 393
- Bessell, Castelli, & Plez (1998) Bessell, M. S., Castelli, F., & Plez, B. 1998, A&A, 333, 231
- Brown et al. (2001) Brown, T. M., Sweigart, A. V., Lanz, T., Landsman, W. B., & Hubeny, I. 2001, ApJ, 562, 368
- Burstein et al. (2004) Burstein, D., et al., 2004, ApJ, 614, 158
- Caloi & D’Antona (2005) Caloi, V. & D’Antona, F. 2005, A&A, in press
- Carretta et al. (2003) Carretta, E., Bragaglia, A., Cacciari, C., & Rossetti, E. 2003, A&A, 410, 143
- Carretta, Bragaglia & Cacciari (2004) Carretta, E., Bragaglia, A., Cacciari, C., ApJ, 610, L28
- Castellani & Castellani (1993) Castellani M., & Castellani V. 1993, ApJ, 407, 649
- Corwin et al. (2004) Corwin, T. M., Catelan, M., Borissova, J., & Smith, H. A. 2004, A&A, 421, 667
- Catelan & de Freitas Pacheco (1995) Catelan, M. & de Freitas Pacheco, J. A. 1995, A&A, 297, 345.
- Cottrell & Da Costa (1981) Cottrell, P. L. & Da Costa, G. S. 1981, ApJ, 245, L79
- D’Antona (2003) D’Antona, F. 2003, Societa Astronomica Italiana Memorie Supplement, 3, 64
- D’Antona, Gratton, & Chieffi (1983) D’Antona, F., Gratton, R., & Chieffi, A. 1983, Memorie della Societa Astronomica Italiana, 54, 173
- D’Antona et al. (2002) D’Antona, F., Caloi, V., Montalbán, J., Ventura, P., & Gratton, R. 2002, A&A, 395, 69
- D’Antona & Caloi (2004) D’Antona, F. & Caloi, V. 2004, ApJ, 611, 871
- D’Cruz et al. (1996) D’Cruz N.L., Dorman B., Rood R.T., & O’Connell R.W. 1996, ApJ, 466, 359
- D’Cruz et al. (2000) D’Cruz N.L., O’Connell R.W., Rood R.T., Whitney, J.H. et al. 2000, ApJ, 530, 352
- Denissenkov & Herwig (2003) Denissenkov, P. A. & Herwig, F. 2003, ApJ, 590, L99
- Dolphin (2000) Dolphin, A.E., 2000, PASP, 112, 1383
- Fenner et al. (2004) Fenner,Y., Campbell, S., Karakas, A.I., Lattanzio, J.C. & Gibson, B.K. 2004, MNRAS, 353, 789
- Ferraro et al. (1999) Ferraro, F.R., Messineo, M., Fusi Pecci, F., De Palo M.A., Straniero, O., Chieffi, A., Limongi, M., 1999, AJ, 118, 1738
- Ferraro et al. (2004) Ferraro, F.R., et al., 2004, ApJ, 603, L81
- Fusi Pecci & Bellazzini (1997) Fusi Pecci, F., & Bellazzini, M., 1997, in The third Conference on Faint Blue Stars, A.G.D. Philips, J. Liebert, R. Saffer and D. S. Hayes Eds., Schenectady, L. Davis Press, p. 255
- Fusi Pecci et al. (1993) Fusi Pecci, F., Ferraro, F-,R., Bellazzini, M., Djorgovski, S.G., Piotto, G., & Buonanno, R. 1993, AJ, 105, 1145
- Gratton et al. (2001) Gratton, R. G. et al. 2001, A&A, 369, 87
- Gratton, Sneden & Carretta (2004) Gratton, G., Sneden, C., & Carretta, E. 2004, ARA&A, 42, 385
- Harris (1996) Harris, W.E., 1996, AJ, 112, 1487
- Lattanzio et al. (2004) Lattanzio, J., Karakas, A., Campbell, S., Elliott, L., & Chieffi, A. 2004, Memorie della Societa Astronomica Italiana, 75, 322
- Lee et al. (1999) Lee, Y.,-W., et al., 1999, Nature, 402, 55
- Lee et al. (2005) Lee, Y., et al. 2005, ArXiv Astrophysics e-prints, astro-ph/0501500
- Martin et al. (2004) Martin, N., Ibata, R., Bellazzini, M., Irwin, M.J., Lewis, G.F., Dehnen, W., 2004, MNRAS, 348, 12
- Martinez-Delgado et al. (2004) Martinez-Delgado, D., Butler, D.J., Rix, H.-W., Franco, Y.I., Penarrubia, J., 2004, ApJLetters, submitted (astro-ph/0410611)
- Moeler et al. (2004) Moehler S., Sweigart A.V., Landsman W.B., Hammer N.J., & Dreizler S. 2004, A&A, 415, 313
- Norris (2004) Norris, J. E. 2004, ApJ, 612, L25
- Pancino et al. (2000) Pancino, E., Ferraro, F.R, Bellazzini, M., Piotto, G., Zoccali, M., 2000, ApJ, 534, L83
- Rogers (2001) Rogers, F. J., Contributions to Plasma Physics, V.41 (N2-3) p. 179
- Rood (1973) Rood, R. T., 1973, ApJ, 184, 815
- Rood & Crocker (1989) Rood, R.T., Crocker, D.A., 1989, in The use of pulsating stars in fundamental problems of astronomy, Cambridge, Cambridge Un. Press, IAU Coll. n. 11, p. 103
- Rich et al. (1997) Rich, M.R., et al., 1997, ApJ, 484, L25
- Sollima et al. (2005) Sollima, A., Ferraro, F.R., Pancino, E., Bellazzini, M., 2005, MNRAS, 357, 265
- Smith (1987) Smith G. H. 1987, PASP, 99, 67
- Smith et al. (2000) Smith, V. V., Suntzeff, N. B., Cunha, K., Gallino, R., Busso, M., Lambert, D. L., & Straniero, O. 2000, AJ, 119, 1239
- Sneden (1999) Sneden C. 1999, Ap&SS, 265, 145
- Sneden (2000) Sneden C. 2000, in 35th Liege International Astrophysics Colloquium: The Galactic Halo, from Globular Clusters to Field Stars, ed. A. Noels, P. Magain, D. Caro, E. Jehin, G. Parmentier, and A. Thoul (Liège Belgium: Institut d’Astrophysique et de Géophysique), p. 159
- Saumon, Chabrier, & van Horn (1995) Saumon, D., Chabrier, G., & van Horn, H. M. 1995, ApJS, 99, 713
- Schechter, Mateo & Saha (1993) Schechter, P., Mateo, M., Saha, A. 1993, PASP, 105, 1342
- Stolzmann & Blöcker (1996) Stolzmann, W. & Bloecker, T. 1996, A&A, 314, 1024
- Stolzmann & Blöcker (2000) Stolzmann, W. & Blöcker, T. 2000, A&A, 361, 1152
- Sweigart (1997) Sweigart, A. V. 1997, Third Conference on Faint Blue Stars, ed. A. G. D. Philip, J. Liebert, R. Saffer and D.S. Hayes, (Schenectady, L. Davis Press), p.3
- Trager, Djorgovski & King (1993) Trager, S.C., Djorgovski, S.G., King, I.R., 1993 in Structure and Dynamics of Globular Clusters, S. Djorgovski and G. Meylan Eds., (S. Francisco, ASP), ASP Conf. Series, 50, 347
- Ventura et al. (2001) Ventura, P., D’Antona, F., Mazzitelli, I., & Gratton, R. 2001, ApJ, 550, L65
- Ventura, D’Antona, & Mazzitelli (2002) Ventura, P., D’Antona, F., & Mazzitelli, I. 2002, A&A, 393, 215
- Ventura & D’Antona (2005a) Ventura, P., D’Antona, F. 2005a, A&A, in press
- Ventura & D’Antona (2005b) Ventura, P., D’Antona, F. 2005b, A&A, submitted
- Ventura et al. (2004) Ventura, P., Mazzitelli, I. & D’Antona, F. 2004, Proceedings of the Joint Discussion 04 of the XXIV IAU General Assembly, Sydney, Astrophysical Impact of Abundances in Globular Cluster Stars, eds. F.D’Antona and G. Da Costa, Mem.S.A.It. 75, n. 2, in presse
- Zinn & West (1984) Zinn R., & West M.J. 1984, ApJS, 55, 45