RAPTOR observations of the early optical afterglow from GRB 050319
Abstract
The RAPid Telescopes for Optical Response (RAPTOR) system at Los Alamos National Laboratory observed GRB 050319 starting 25.4 seconds after -ray emission triggered the Burst Alert Telescope (BAT) on-board the Swift satellite. Our well sampled light curve of the early optical afterglow is composed of 32 points (derived from 70 exposures) that measure the flux decay during the first hour after the GRB. The GRB 050319 light curve measured by RAPTOR can be described as a relatively gradual flux decline (power-law index ) with a transition, at about s after the GRB, to a faster flux decay (). The addition of other available measurements to the RAPTOR light curve suggests that another emission component emerged after s. We hypothesize that the early afterglow emission is powered by extended energy injection or delayed reverse shock emission followed by the emergence of forward shock emission.
Subject headings:
gamma rays: bursts – cosmology: observations – shock waves1. Introduction
Recent years have brought interesting developments in the domain of observations of the early optical emission from Gamma-Ray Bursts (GRBs). Several groups now have the routine capability to respond to GRB triggers in real time using rapidly slewing robotic instruments (e.g. Akerlof et al. 2003; Bloom 2004; Boer, M. 2004; Covino et al. 2004; Perez-Ramirez, Park, & Williams 2004; Vestrand et al. 2002). Despite much effort in this area, so far only a handful of GRBs have been detected within the first minutes after the onset of the -ray emission, namely GRBs 990123, 021004, 021211, 030418, 041219a, 050319 and 050401 (e.g. Akerlof et al. 1999; Fox et al. 2003b; Woźniak et al. 2002; Li et al. 2003; Rykoff et al. 2004; Vestrand et al. 2005; Rykoff et al. 2005a,b). Even fewer events have good S/N and coverage.
The discovery of the near infra-red transient from GRB 041219a (Blake & Bloom 2004; Blake et al. 2005) and its parallel detection in the optical band (Wren et al. 2004) expanded the list of known GRB properties. The RAPTOR (Rapid Telescopes for Optical Response; Vestrand et al. 2002) optical light curve of GRB 041219a (Vestrand et al. 2005) overlaps with the -ray emission by an unprecedented minutes. Vestrand et al. (2005) discovered a qualitatively new component of the early optical emission from GRBs, and presented evidence for internal shocks (Meszaros & Rees 1999) as the emission mechanism. The presence of the new component was established on purely empirical basis by its distinct close correlation with strongly time-varying -ray flux.
The updated taxonomy for GRB-related optical transient (OT) emission proposed by Vestrand et al. (2005) comprises: (1) Prompt optical emission contemporaneous with and consistent with a constant flux ratio to -rays (the ratio is in GRB 041219a (Vestrand et al. 2005)); (2) Early afterglow emission that may start during the -ray emission and lasts for several seconds to minutes (uncorrelated with -rays and typically brighter than the prompt component; e.g. GRBs 990123 and 021211); and (3) Late afterglow emission that emerges after the fading early afterglow and can persist for hours to many days (e.g. Fox et al. 2003a). The current theoretical framework offers, correspondingly, internal shocks (Meszaros & Rees 1999), the reverse shock (Sari & Piran 1999; Panaitescu & Kumar 2004) and the external shock (Meszaros & Rees 1997; Sari, Piran & Narayan 1998) phenomena for a possible explanation of the observed properties.
In this letter we present a comprehensive light curve of the early optical afterglow emission from GRB 050319 starting at 35 s after the GRB trigger.
2. Observations
On 2005, March 19, 09:31:18.4 UT (trigger time; hereafter ), the Burst Alert Telescope (BAT) instrument of the Swift satellite (Gehrels et al. 2004) detected GRB 050319, a single-peak event with fast raise and exponential decay lasting s (Krimm et al. 2005a, b). The 15–350 keV fluence, the peak flux and the photon index of the time-averaged spectrum were subsequently measured to be, respectively, erg cm-2, 1.7 ph cm-2 s-1 and 2.20.2 (Krimm et al. 2005b). The on-board location (Krimm et al. 2005a) was distributed in near-real time through the GRB Coordinates Network (GCN) at 09:31:36.0 UT, s.
Both the RAPTOR-S telescope and the RAPTOR-AB array responded to the alert. RAPTOR-S is a fully autonomous robotic telescope with 0.4-m aperture and typical operating focal ratio f/5. It is equipped with a 1k 1k pixel CCD camera employing a back-illuminated Marconi CCD47-10 chip with 13 pixels. For technical details on RAPTOR-A and B see Vestrand et al. (2002).
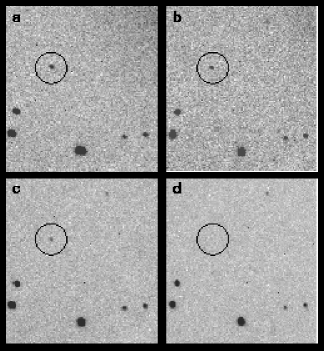
RAPTOR-S was on target at 09:31:53.7 UT, s. The rapid response sequence for RAPTOR-S consists of ten 10-second images followed by sixty 30-second images, a total of minutes of coverage (including the 15-second intervals between exposures used primarily for readout). A candidate OT at =10:16:47.9, =+43:32:54.5 (J2000) was rapidly identified by Rykoff et al. (2005a) within a half hour. The OT was later confirmed by Yoshioka et al. (2005), and the absorption red-shift was reported by Fynbo et al. (2005). Initial analysis of the RAPTOR-S images (Fig. 1) showed that the OT was detected at high S/N in early exposures and gradually faded below the magnitude limit. Unfortunately, the observing conditions at the RAPTOR-S site during response were variable and clouds obscured the field of view between and 2440 s.
RAPTOR-B instrument responded slightly faster. Although none of those images is a detection, including the first 10-second frame starting at s, the corresponding magnitude limit for OT is of some value (§ 4). RAPTOR-B and S are separated by about 37 km and have independent weather.
3. Photometry
After standard corrections for bias, dark current and flat field responses, all frames underwent a 22 pixel binning. The binning was applied in order to bring the sampling of the stellar images to about the critical Nyquist value. Additionally, it increased S/N per pixel and made the point-spread function (PSF) nearly circular.
We rejected 29 images taken between and 2440 s, when transparency was very poor due to passing clouds. In even later images the OT detections are marginal. We decided, therefore, to form two mean averages of 5 and 6 frames out of 11 images taken after s. A high S/N reference image was prepared by mean stacking twenty 30-second frames. All object centroids (including OT) were determined using the reference image. For the purpose of averaging and photometric analysis, all frames were resampled to a common pixel grid using a bi-cubic spline interpolator and a linear coordinate transformation with the 0.08 pixel accuracy (r.m.s.) based on the positions high S/N field stars. For image processing we used a custom Difference Image Analysis software (Woźniak 2000).
PSF-weighted photometry within a 4-pixel radius was performed assuming a fixed centroid (from reference image) and without variance weighting. This general technique, used in Sloan Digital Sky Survey (Lupton 2005, in preparation), hedges against a secondary nonlinearity between the bright and faint ends of the flux scale. It ensures that the much flatter variance profile of the background dominated objects cannot propagate the systematic uncertainties from the PSF shape to the photometric offsets. We assumed a Gaussian PSF with FWHM = 6″ (2.44 pixel, binned). The flux scale with about 3.8% internal consistency was established using 11 high S/N stars in the vicinity of the OT. The calibration to standard magnitudes was based on measurements of 22 USNO-A2.0 stars in the magnitude range = 12.5–18.5. Residuals with respect to the best constant magnitude offset were random over the full flux range (good linearity) with r.m.s. scatter of 0.09 mag outside the photon noise dominated region. Our unfiltered optical band has an effective wavelength close to that of the standard band, but it has a larger width. For lack of the instrumental color information, we assumed that all objects have the color of a mean comparison star, i.e. = 1.25 and = 0.73, according to USNO-A2.0 catalog. The fact that colors of the early GRB afterglows and their temporal evolution remain poorly constrained is a source of major uncertainty in transformations of broad band photometry (compare § 4).
The early RAPTOR-B frame was analyzed using the same techniques as applied to RAPTOR-S data. The actual limit was calculated by performing a fixed centroid PSF photometry at numerous random locations near the nominal OT position, taking the r.m.s. of the measured flux and converting to magnitudes.
4. Results
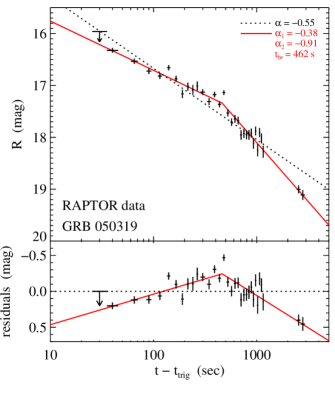
The final RAPTOR photometry of the early optical afterglow of GRB 050319 expressed on the -band scale is given in Table 1. Fig. 2 plots the light curve along with our model fits. Quimby et al. (2005) found an acceptable fit to an unfiltered optical light curve from ROTSE-IIIb telescope using a single power-law model with . For the RAPTOR data the best fitting single power-law model has index , however it yields an unacceptable . A visual inspection of the RAPTOR measurements suggests a shallow flux decay at early times and significant steepening after s. In fact, the residuals with respect to the best fitting single power-law model are systematic and indicate a steepening trend. To test that hypothesis we fitted a broken power-law model and obtained a reasonably good fit (/d.o.f. = 2.91) with , and the break time s. It should be noted that instantaneous scale breaking in this direction may be hard to explain physically. Nevertheless, we find the model useful for investigating possible changes in the light curve slope.
The residuals with respect to the best fitting broken power-law model appear flat, however the reduced (81.42/28 d.o.f.) is still formally unacceptable. For some measurements the deviations from the best fit model are well in excess of the error estimates, in particular there are several strong outliers right near the fitted time of the break. There are also a few points with fluxes significantly larger than the model prediction right before passing clouds covered the field of view. The additional photometric scatter could be related to variable observing conditions and is discussed in more detail in § 5.
To establish the significance of the break, we fitted a series of broken power-law models with a range of fixed break times. We found that the minimum of the surface is not very well constrained and the actual 68% confidence interval for the break time may be closer to 100 s than to the formal parabolic error bar. Our conclusion is that the RAPTOR data indicate a significant steepening in the flux decay of GRB 050319 within the first hour after the -ray trigger. However, despite the appearance of sharp break in the light curve near s, our data are fully consistent with a gradual increase of the slope, possibly with additional small scale photometric variations.
| (s) | (s) | (s) | (mag) | (mag) |
|---|---|---|---|---|
| 25.4 | 35.4 | 10 | 15.960 | |
| 35.3 | 45.3 | 10 | 16.323 | 0.046 |
| 60.3 | 70.3 | 10 | 16.532 | 0.050 |
| 85.3 | 95.3 | 10 | 16.722 | 0.056 |
| 110.3 | 120.3 | 10 | 16.818 | 0.055 |
| 135.3 | 145.3 | 10 | 16.656 | 0.050 |
| 160.3 | 170.3 | 10 | 16.870 | 0.059 |
| 185.5 | 195.5 | 10 | 17.160 | 0.080 |
| 210.3 | 220.3 | 10 | 17.021 | 0.077 |
| 235.3 | 245.3 | 10 | 17.084 | 0.096 |
| 260.5 | 270.5 | 10 | 17.007 | 0.087 |
| 285.3 | 315.3 | 30 | 17.127 | 0.056 |
| 330.3 | 360.3 | 30 | 17.309 | 0.068 |
| 375.3 | 405.3 | 30 | 17.175 | 0.053 |
| 420.5 | 450.5 | 30 | 17.364 | 0.057 |
| 465.2 | 495.2 | 30 | 17.138 | 0.047 |
| 510.2 | 540.2 | 30 | 17.529 | 0.065 |
| 555.2 | 585.2 | 30 | 17.705 | 0.072 |
| 600.2 | 630.2 | 30 | 17.642 | 0.074 |
| 645.2 | 675.2 | 30 | 17.675 | 0.074 |
| 690.2 | 720.2 | 30 | 17.951 | 0.091 |
| 735.4 | 765.4 | 30 | 17.920 | 0.089 |
| 780.2 | 810.2 | 30 | 17.948 | 0.087 |
| 825.2 | 855.2 | 30 | 17.949 | 0.093 |
| 870.2 | 900.2 | 30 | 17.912 | 0.085 |
| 915.2 | 945.2 | 30 | 18.110 | 0.104 |
| 960.4 | 990.4 | 30 | 17.874 | 0.085 |
| 1005.2 | 1035.2 | 30 | 18.241 | 0.120 |
| 1050.2 | 1080.2 | 30 | 17.903 | 0.089 |
| 1095.2 | 1125.2 | 30 | 18.016 | 0.094 |
| 1140.4 | 1170.4 | 30 | 18.272 | 0.118 |
| 2445.0 | 2654.9 | 150 | 19.001 | 0.076 |
| 2669.9 | 2924.9 | 180 | 19.109 | 0.096 |
5. Discussion
To test the robustness of the results of § 4 we reanalyzed the data using three other photometric tools to extract object fluxes: (1) traditional aperture photometry; (2) kernel matched difference image photometry (Woźniak 2000); (3) a standard PSF package DoPHOT (Schechter, Mateo & Saha 1993), and obtained essentially identical light curves. While the steepening of the light curve and most wiggles were always present, the precise origin of photometric outliers in Fig. 2 still escapes explanation. Some comparison stars also show the wiggles and some are fully consistent with the photon noise estimate. Li et al. (2003) noticed similar discrepancies in their light curve of GRB 021211 and suggested that color induced systematics could be the cause. The intrinsic variability of the OT color or even a stationary color difference between the OT and comparison stars may generate systematic offsets in photometry. Given that the unfiltered spectral band is subject to a red atmospheric cutoff and weather variations during RAPTOR response, it is entirely possible that the outliers come from a systematic effect yet to be found. This experience underscores the importance of simultaneous color measurements of the early GRB afterglows using standard filters.
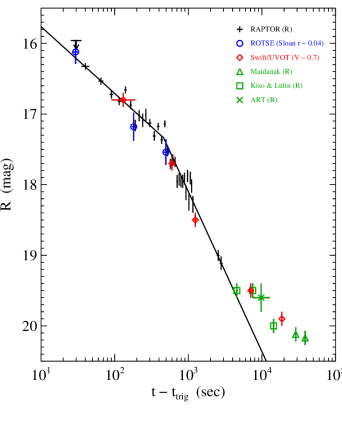
In Fig. 3 we plot other OT measurements available at this time for comparisons with the RAPTOR light curve. The three points from ROTSE collaboration (Quimby et al. 2005) were shifted by mag to reflect the median difference between SDSS and USNO-A2.0 magnitudes for our comparison stars. The -band points from Swift/UVOT (Boyd et al. 2005) are plotted 0.7 mag brighter than actual values. All measurements reported in standard band were taken at face value, since any finer issues with calibration to different catalogs should wait until the final revised photometry is available.
Measurements by other experiments agree with the shape of the RAPTOR light curve. While more sparsely sampled, the -band light curve observed by the Swift/UVOT (Boyd et al. 2005) also shows a faster flux decay after s. Further, the measurement at hours by Yoshioka et al. (2005) is consistent with the extrapolated value predicted by the RAPTOR measurements. At times beyond hours, the published data from UVOT and other instruments show a transition back to a more gradual flux decay rate. The two breaks in the flux decay rate are visible in both the -band and the -band light curves. The close tracking between the light curves in both filters implies a constant color during the first day of the flux evolution. The zero point for the UVOT measurements is still not well established (Boyd et al. 2005), but taken at face value the reported measurements yield a color for the OT counterpart of GRB 050319.
While the sample size is still small, one can already start to explore the morphology of GRB early afterglow light curves. The early afterglow behaviors of GRBs 990123 (Akerlof et al. 1999) and 021211 (Li et al. 2003) were very similar, with both OTs showing a steeper initial decline (power-law index ) and the emergence of a shallower component () after 10 minutes. On the other hand, GRBs 021004 (Fox et al. 2003b) and 030418 (Rykoff et al. 2004) showed shallower initial decline (or even rise) with and then gradual steepening (to about ) on time-scales of s or longer. The measurements we reported here for GRB 050319, starting from and evolving to after s, place its early afterglow properties in the latter group.
In the context of the standard fireball model, the shape of the optical afterglow light curve is determined by the nature of the interaction between the relativistic ejecta and the external medium. The relative importance and timing of the reversed and forward shock components, which depend on properties like the density profile in the external medium and the strength of the magnetic field of the fire-ball, are reflected in the rates of flux evolution and the break times in the predicted light curve (e.g. Sari & Piran 1999; Meszaros 2002; Zhang et al. 2004). The morphology of the GRB 990123 and 021211 light curves, with the break to shallower decay, is usually attributed to the transition from the dominance of the reverse shock generated emission to forward shock generated emission (e.g. Li et al. 2003). For the more gradually decaying early afterglows, the interpretation is less clear. The gradually declining component could be associated with delayed reverse shock emission (Vestrand et al. 2005) or an energy injection that continues well beyond the duration of the initial explosion (Fox et al. 2003b). The emergence of the additional component after s in GRB 050319 could then be understood as the emergence of the forward shock emission. The prompt Swift localizations and rapid robotic followup are just starting to reveal the richness and complexity of the GRB afterglow phenomenology and, when combined with the models, will help to constrain the basic physical parameters of these cataclysmic explosions.
References
- Akerlof et al. (1999) Akerlof, C., et al. 1999, Nature, 398, 400
- Akerlof et al. (2003) Akerlof, C., et al. 2003, PASP, 115, 132
- Blake et al. (2005) Blake, C., et al. 2005, Nature, in press, preprint (astro-ph/0503508)
- Blake & Bloom (2004) Blake, C. & Bloom, J. S. 2004, GCN Circ., 2870
- Bloom (2004) Bloom, J. S. 2004, GCN Circ., 2854
- Boyd et al. (2005) Boyd, P. et al. 2005, GCN Circ., 3129
- Boer, M. (2004) Boer, M. 2004, Astron. Nachrichten, 322, 343
- Covino et al. (2004) Covino, S., et al. 2004, in Proc. of the SPIE, “UV and Gamma-Ray Space Telescope Systems”, eds. G. Hasinger, M. J. L. Turner, 5492, 1613
- Fox et al. (2003a) Fox, D. et al. 2003a, ApJ, 586, L5
- Fox et al. (2003b) Fox, D., et al. 2003b, Nature, 422, 284
- Fynbo et al. (2005) Fynbo, J. P. U., Hjorth, J., Jensen, B. L., Jakobsson, P., Moller, P., & Naranen, J. 2005, GCN Circ., 3136
- Gehrels et al. (2004) Gehrels, N., et al. 2004, ApJ, 611, 1005
- Krimm et al. (2005a) Krimm, H. et al. 2005, GCN Circ., 3117
- Krimm et al. (2005b) Krimm, H. et al. 2005, GCN Circ., 3119
- Li et al. (2003) Li, W., Filippenko, A., Chornock, R. & Jha, Saurabh 2003, ApJ, 586, L9
- Meszaros (2002) Meszaros, P. 2002, ARA&A, 40, 137
- Meszaros & Rees (1997) Meszaros, P. & Rees, M. 1997, ApJ, 476, 232
- Meszaros & Rees (1999) Meszaros, P. & Rees, M. 1999, MNRAS, 306, L39
- Panaitescu & Kumar (2004) Panaitescu, A. & Kumar, P. 2004, MNRAS, 353, 511
- Perez-Ramirez, Park, & Williams (2004) Perez-Ramirez, D., Park, H. S., Williams, G. G. 2004, Astron. Nachrichten, 325, 667
- Quimby et al. (2005) Quimby, R. M., Rykoff, E. S., Schaefer, B. E., McKay, R., & Yost, S. A. 2005, GCN Circ., 3135 Rykoff, E. S., Schaefer, B., Quimby, R. 2005a, GCN Circ., 3116
- Rykoff et al. (2004) Rykoff, E. S., et al. 2004, ApJ, 601, 1013
- Rykoff et al. (2005a) Rykoff, E. S., Schaefer, B., Quimby, R. 2005a, GCN Circ., 3116
- Rykoff et al. (2005b) Rykoff, E. S., Yost, S. A., & Smith, D. A. 2005b, GCN Circ., 3165
- Sari & Piran (1999) Sari, R. & Piran, T. 1999, ApJ, 520, 641
- Sari, Piran & Narayan (1998) Sari, R., Piran, T. & Narayan, R. 1998, ApJ, 497, L17
- Schlegel, Finkbeiner & Davis (1998) Schlegel, D.J., Finkbeiner, D.P. & Davis, M. 1998, ApJ, 500, 525
- Sharpov et al. (2005) Sharapov, D., Ibrahimov, M., Karimov, R., Kahharov, B., Pozanenko, A., Rumyantsev, V., Beskin, G. 2005, GCN Circ., 3124
- Schechter, Mateo & Saha (1993) Schechter, L., Mateo, M., & Saha, A. 1993, PASP, 105, 1342
- Torii (2005) Torii, K. 2005, GCN Circ., 3121
- Vestrand et al. (2002) Vestrand, W. T., et al. 2002, in Proc. SPIE, “The RAPTOR experiment: a system for monitoring the optical sky in real time.”, 4845, 126
- Vestrand et al. (2004) Vestrand, W. T., et al. 2004, Astronom. Nachrichten, 325, 549
- Vestrand et al. (2005) Vestrand, W. T., et al. 2005, Nature, in press, preprint (astro-ph/0503521)
- Woźniak (2000) Woźniak, P. R. 2000, Acta Astron., 50, 421
- Woźniak et al. (2002) Woźniak, P. R., et al. 2002, GCN Circ., 1757
- Wren et al. (2004) Wren, J., Vestrand, W. T., Evans, S., White, R., & Wozniak, P. 2004, GCN Circ., 2889
- Yoshioka et al. (2005) Yoshioka, T., et al. 2005, GCN Circ., 3120
- Zhang et al. (2004) Zhang, B., Kobayashi, S., Meszaros, P., Lloyd-Ronning, N. M., & Dai, X. 2004, in IAP Conf. Proc., 727, “Gamma-Ray Bursts: 30 Years of Discovery”, ed. E. E. Fenimore & M. Galassi, (Melville NY: AIP), 208