The Century Survey Galactic Halo Project II: Global Properties and the Luminosity Function of Field Blue Horizontal Branch Stars
Abstract
We discuss a 175 deg2 spectroscopic survey for blue horizontal branch (BHB) stars in the Galactic halo. We use the Two Micron All Sky Survey (2MASS) and the Sloan Digital Sky Survey (SDSS) to select BHB candidates, and find that the 2MASS and SDSS color-selection is 38% and 50% efficient, respectively, for BHB stars. Our samples include one likely run-away B7 star 6 kpc below the Galactic plane. The global properties of the BHB samples are consistent with membership in the halo population: the median metallicity is [Fe/H]=, the velocity dispersion is 108 km s-1, and the mean Galactic rotation of the BHB stars kpc is km s-1. We discuss the theoretical basis of the Preston, Shectman & Beers -color relation for BHB stars, and conclude that intrinsic shape of the BHB -color relation results from the physics of stars on the horizontal branch. We calculate the luminosity function for the field BHB star samples using the Efstathiou, Ellis, & Peterson maximum-likelihood method which is unbiased by density variations. The field BHB luminosity function exhibits a steep rise at bright luminosities, a peak between , and a tail at faint luminosities. We compare the field BHB luminosity functions with the luminosity functions derived from sixteen different globular cluster BHBs. Kolmogorov-Smirnov tests suggest that field BHB stars and BHB stars in globular clusters share a common distribution of luminosities, with the exception of globular clusters with extended BHBs.
Subject headings:
stars: horizontal-branch — Galaxy: stellar content — Galaxy: halo1. INTRODUCTION
Mapping the stellar halo requires objects that are sufficiently luminous to observe at large distances, yet common enough to sample the halo densely. In Brown et al. (2003), hereafter Paper I, we introduced the Century Survey Galactic Halo Project, a photometric and spectroscopic survey from which we selected blue horizontal branch (BHB) stars as probes of the Milky Way halo. BHB stars meet our criteria for tracer samples: they are intrinsically luminous and are quite numerous, with a number density in the halo that exceeds that of RR Lyraes by roughly a factor of ten (Preston, Shectman, & Beers, 1991). The spectral types of BHB stars are typically around A0, bluer than most competing stellar populations. As a result, candidate BHB stars in the halo are relatively easy to select by broadband colors alone.
In Paper I we described the detailed stellar spectral analysis techniques developed for the Century Survey Galactic Halo Project. In this paper we investigate the mean Galactic rotation, metallicity, and luminosity function of the halo BHB stars in the context of a complementary 175 deg2 spectroscopic survey. This new survey extends the work of the original Century Survey Galactic Halo Project by making use of two large-area, multi-passband imaging surveys: (1) the Two Micron All Sky Survey (2MASS; Cutri et al., 2003) and (2) the Sloan Digital Sky Survey (SDSS; York et al., 2000).
Previous spectroscopic surveys of field BHB stars have identified BHB stars over large (several 103 deg2) areas of sky to shallower depths (Pier, 1983; Wilhelm et al., 1999b), or over small (102 deg2) areas of sky to greater depths (Sommer-Larsen et al., 1989; Arnold & Gilmore, 1992; Kinman et al., 1994; Clewley et al., 2004; Kinman et al., 2004) than the Century Survey Galactic Halo Project. The exception is the recently published sample of 1170 BHB stars observed by the SDSS as mis-identified quasars or as filler objects in low density regions (Sirko et al., 2004a, b). In comparison, our spectroscopic survey of BHB stars is cleanly selected and 100% complete within our color and magnitude selection limits. Combined with the original Century Survey sample, we have 157 spectroscopically-identified BHB stars over 239 deg2 of sky.
In §2 we describe the sample selection and spectroscopic observations of the new 175 deg2 region and discuss selection efficiencies for BHB stars. In §3 we discuss the basis of BHB luminosity-color-metallicity relations, and analyze the global kinematic and abundance properties of our BHB samples. In §4 we calculate the luminosity functions for our field BHB star samples, and compare them with luminosity functions derived from globular cluster data. We summarize our results and conclude in §5.
2. SAMPLE SELECTION
2.1. Selection Region
The original Century Survey Galactic Halo Project contains BHB stars selected by or colors. Here we make use only of the sample selected with , the “Century Survey” sample (Brown et al., 2003). The original Century Survey sample covers a slice located and contains 39 spectroscopically-confirmed BHB stars in the magnitude range mag.

Here we select BHB candidate stars from the 2MASS and SDSS surveys in a complementary region located along the celestial equator , . Fig. 1 is a plot of this region in Galactic coordinates. The survey is located predominantly at , in a region that cleanly samples the halo in the Brown et al. (2004) BHB-candidate maps.
2.2. 2MASS Selection
The 2MASS catalog provides uniform photometry over the entire sky. In Brown et al. (2004), we matched the original Century Survey sample to 2MASS and showed that 2MASS colors select A-type stars with 80% efficiency. The A-type stars are all good BHB candidates in our high Galactic latitude survey region.
We have selected 90 BHB candidates from the 2MASS catalog in the magnitude range ; BHB candidates have colors in the ranges and , following Brown et al. (2004). Our upper color limits result in a high selection efficiency but a reduced completeness for BHB stars. Comparison with the original Century Survey sample shows that our color selection samples 65% of the BHB population (Brown et al., 2004).

It is important to note that we have selected objects using de-reddened colors and magnitudes, using extinctions from Schlegel, Finkbeiner, & Davis (1998). The surface density of the 2MASS-selected BHB candidates is 0.5 deg-2.
We have matched up our 2MASS-selected BHB candidates with the publicly available SDSS data: SDSS photometry presently exists for 65 of the 90 objects. Approximately half of the matched objects have SDSS colors consistent with early A-type stars; the remainder follow the stellar locus to F-type stars (see Fig. 2).
2.3. SDSS Selection
The SDSS has released five passband photometry for limited areas of the sky that can be used to select A-type stars efficiently. We selected 194 BHB candidates in the magnitude range from the SDSS Early Data Release (Stoughton et al., 2002) and Data Release 1 (Abazajian et al., 2003). We follow Yanny et al. (2000) and select BHB candidates with and . BHB candidates that fall outside the selection box in Fig. 3 were objects originally selected by “model” magnitudes from the Early Data Release; here we plot Data Release 1 Petrosian magnitudes that we find are better behaved at bright magnitudes. The surface density of the SDSS-selected BHB candidates is 1 deg-2. There is no overlap of these objects with the 2MASS-selected sample, even though both samples cover the same region of sky.

We looked up available 2MASS photometry for the SDSS-selected BHB candidates and found matches for 188 of the 194 objects. A handful of SDSS stars satisfy the 2MASS-selection in and but are rejected by . Thus the lack of overlap between the 2MASS- and SDSS-selected samples is likely due to the extreme uncertainties in 2MASS colors for the fainter 16th and 17th magnitude SDSS stars (see Fig. 3). Interestingly, errant G-type stars found in the SDSS sample are cleanly identified by 2MASS photometry as bright and red stars. This comparison suggests that some bright (15th to 16th magnitude) SDSS stars are likely saturated, and thus have erroneous reported magnitudes. The on-line documentation for the SDSS data archive now describes a series of flags that can be used to avoid such saturated objects.
To understand our completeness for BHB stars requires a better understanding of the SDSS saturation problem. We start by selecting all stars with A-type colors along the celestial equator in SDSS Data Release 2 (Abazajian et al., 2004). We find that saturated objects have discrepant colors for A-type stars. The solid line in Fig. 4 shows the fraction of objects with discrepant . We then re-select all A-colored stars, but this time using the photometry flags to select objects only with clean photometry. The dashed line in Fig. 4 shows the fraction of objects with clean photometry.

Figure 4 shows that half of all A-colored stars with have erroneous photometry and are not A stars at all. For these objects to have A-type colors in and but not in suggests that the band is saturated. This result also suggests that half of the real A-colored stars may be missing in this magnitude range. Selecting for clean photometry removes the erroneous objects, but may also reduce the completeness of the sample. The fraction of discrepant A-colored stars drops to 10% at (see Fig. 4), and the clean photometry selection maintains this level of apparent incompleteness to .
2.4. Spectroscopic Observations
During the fall 2003 observing season we obtained a spectrum for each BHB candidate in the 2MASS- and SDSS-selected samples. Spectroscopic observations were obtained with the FAST spectrograph (Fabricant et al., 1998) on the Whipple 1.5 m Tillinghast telescope. We used a 600 line mm-1 grating and a 2 arcsec slit to obtain a resolution of 2.3 Å and a spectral coverage from 3400 to 5400 Å. Typical signal-to-noise () ratios were 30/1 in the continuum for objects brighter than 16th magnitude, decreasing to =15/1 for the 17th magnitude objects. This is adequate to measure the Balmer lines and the Balmer jump – the primary surface-gravity indicators we employ for BHB stars. Paper I contains details of the data reduction. We measure spectral types and radial velocities, and derive metallicities, effective temperatures, and surface gravities, from the spectra of the total sample of 284 objects.
2.5. BHB Classification
The major difficulty in using BHB stars as probes of Galactic structure is the need to distinguish reliably between low surface-gravity BHB stars and higher surface-gravity A-type dwarfs and blue stragglers. Although investigators once thought blue stragglers were a minor component of the halo population, recent studies (Norris & Hawkins, 1991; Preston, Beers, & Shectman, 1994; Wilhelm et al., 1999b; Brown et al., 2003; Clewley et al., 2004) demonstrate that a surprisingly large fraction of faint stars in the color range associated with BHB stars are indeed high-gravity stars, many of which are blue stragglers (Preston & Sneden, 2000; Carney et al., 2005).

Our classification of BHB stars is identical to the approach described in Paper I. In brief, we apply the techniques of Kinman et al. (1994), Wilhelm, Beers, & Gray (1999a), and Clewley et al. (2002) to identify low surface-gravity BHB stars. We identify objects that satisfy three or more of the four classification techniques as BHB stars (see Fig. 5). We find a total of 118 BHB stars across our 175 deg2 survey region.
2.6. Sample Selection Efficiencies
| Sample | BHB | other A | B | F | |
|---|---|---|---|---|---|
| 2MASS | 90 | 38% | 40% | 7% | 15% |
| SDSS | 167 | 50% | 42% | 4% | 4% |
Table 1 summarizes sample selection efficiencies. The 2MASS-selected sample contains 34 BHB stars (out of 90 candidates) for a net selection efficiency of 38%. The total number of A-type stars is about twice the number of BHB stars, or 78% of the 2MASS-selected sample. Of the remaining non A-type objects, 7% of the stars in the 2MASS-selected sample are B-type stars; 15% of the stars in this sample are F-type stars.
The SDSS-selected sample contains 84 BHB stars (out of 167 candidates) for a net selection efficiency of 50%. We ignore the 27 G-type stars in this calculation as these stars can presumably be rejected by saturation flags. The total number of A-type stars is about twice the number of BHB stars, or 92% of the SDSS-selected sample (excluding the G-types). Of the remaining non A-type objects, 4% of the stars in the SDSS-selected sample are B-type stars; 4% of the stars in this sample are F-type stars.
Sirko et al. (2004a) have recently published a “stringent” color selection for BHB stars. Applying the stringent color cut to our full SDSS-selected sample would yield 55 BHB stars selected from 81 candidates for a net selection efficiency of 68%, but a completeness of only 65% compared to the full SDSS-selected sample.
2.7. Unusual Objects
In Paper I we identified a number of unusual objects, including white dwarfs, subdwarfs, and B-type stars, within our survey of blue stars in the halo. The 2MASS- and SDSS-selected samples, by comparison, contain a handful of B stars, but do not include any white dwarfs or subdwarfs. The lack of white dwarfs may be explained by the more restrictive color selection we used for the 2MASS- and SDSS-selected samples. Moreover, the B-type stars in the 2MASS- and SDSS-selected samples are almost entirely late B8 and B9 stars. These late B-types are potentially all hot horizontal-branch stars, but are very difficult to classify because the horizontal branch crosses the main sequence at this location in the H-R diagram.
The earliest B-type star in our samples is CHSS 1645, classified as B7. As the earliest B-type star in our samples, CHSS 1645 is the most likely object to be a true B star rather than a hot horizontal-branch star. Assuming CHSS 1645 has solar metallicity, with (Cox, 2000) and (Kenyon & Hartmann, 1995), we estimate that it is located 6 kpc below the Galactic plane. This places CHSS 1645 among the class of stars known as “run-away B-type” stars. The star CHSS 1645 is located at , hence its +73 km s-1 radial velocity points predominantly in the negative direction perpendicular to the plane of the Galaxy. If its radial velocity is the majority of its full space motion, it takes 108 years for CHSS 1645 to travel 6 kpc from the Galactic plane. A B7 star has 4 (Cox, 2000) and a lifetime 2 yr (Bowers & Deeming, 1984). Thus CHSS 1645, a likely run-away B7 star, has a lifetime consistent with its travel time from the disk.
3. GLOBAL PROPERTIES
To map the Galactic halo requires knowing the intrinsic luminosities of BHB stars. BHB stars are standard candles with luminosities that depend on effective temperature (color) as well as metallicity. We begin by discussing the physical basis of the BHB luminosity dependence on color (Section 3.1). We then present the observed distribution of metallicities derived from our spectra (Section 3.2). Using our colors and metallicities, we compute intrinsic luminosities for our field BHB stars and investigate their spatial distribution (Section 3.3). Finally, we investigate the mean Galactic rotation of our halo samples (Section 3.4).
3.1. BHB Luminosity-Color Dependence
BHB stars share a common physical origin. They are stars that have evolved off the red giant branch and are burning helium in their cores with a hydrogen burning shell. The bolometric luminosity of a BHB star depends on the core mass, the stellar mass, and the metallicity (e.g. Demarque et al., 2000). More massive BHB stars have larger hydrogen-rich envelopes and are cooler than less massive BHB stars. The variation of effective temperature with stellar mass yields a robust relation between optical luminosity and B-V color: bluer BHB stars are fainter than red BHB stars.

Preston, Shectman, & Beers (1991), hereafter PSB, provide an empirical BHB luminosity-color relation from a fit to fifteen globular cluster BHBs. Fig. 6 shows the PSB -color relation as a solid line. The relation is normalized to [Fe/H]= using the -metallicity relation described below. Globular clusters exhibit a wide range of BHB morphologies, evident in the 0.25 mag scatter of the points in PSB’s Fig. 5. Because the large scatter may result from the physics of globular clusters rather than from the physics of BHB stars, we next consider a theoretical -color relation. The theoretical -color relation provides a physical basis for the empirical PSB relation.
To construct a theoretical -color relation, we use the horizontal branch evolutionary tracks from Demarque et al. (2000). For models with (equivalent to [Fe/H]) we adopt the luminosity at time zero and derive colors and bolometric temperatures from published tables (Kenyon & Hartmann, 1995; Green & Demarque, 1996; Lejeune et al., 1998). The resulting -color relation for is the dashed line in Fig. 6. The theoretical -color relation is remarkably similar in shape to the empirical PSB relation in the (B V) region covered by our BHB star samples.
As a consistency check, we plot a third line in Fig. 6 that is simply the bolometric correction for a star with constant luminosity. We use the bolometric corrections for main sequence stars from Kenyon & Hartmann (1995), and add 0.5 mag to match the bolometric correction to the empirical and theoretical -color relations at the red end. Interestingly, the shape of the Kenyon & Hartmann (1995) bolometric corrections is similar to both the empirical and theoretical BHB -color relations, except that the slope of the bolometric correction curve is too shallow at the blue end. We expect this systematic difference because blue BHB stars are intrinsically less luminous than red BHB stars; we have assumed a constant luminosity star. Bolometric corrections from Green & Demarque (1996) and Lejeune et al. (1998) yield similar results, with a typical scatter of 0.1 - 0.2 mag. This toy model shows that the primary ingredient in the BHB -color relation is the bolometric correction for BHB stars.
Thus the physics common to all BHB stars leads to a general BHB -color relation, albeit with an intrinsic spread resulting from age and metallicity. The -color relation depends on age because the luminosity and effective temperature of a BHB star evolve with time. The -color relation has a well known dependence on metallicity, but Demarque et al. (2000) argue for an additional spread in at a given metallicity due to BHB morphology. The morphology effect is strongest for a metal poor [Fe/H] BHB with blue morphology (HB type index=+1). According to Demarque et al. (2000), a metal poor, blue BHB is actually 0.1 mag brighter than the standard luminosity-metallicity relation predicts. We conclude that the BHB -color relation has an intrinsic shape due to the physics of the horizontal branch, with an intrinsic spread of 0.1 - 0.2 mag. For purposes of discussion, we use the empirical PSB -color relation to estimate BHB luminosities in the rest of this section.
3.2. Metallicities
We measure metallicities for BHB stars as described in Paper I. We use three different techniques: the line indices of Beers et al. (1999), the equivalent width of Ca ii K plus a chi-square comparison between metallic-line regions in synthetic and observed spectra (Wilhelm, Beers, & Gray, 1999a), and an optimization method that fits the entire spectrum (Allende Prieto, 2003). The three techniques are in good agreement with 0.25 dex uncertainty (Brown et al., 2003). The final metallicity is the average of the three techniques; we adopt 0.25 dex as the error in the final metallicity.

Figure 7 plots the observed distribution of metallicities we measure in the original Century Survey sample, the 2MASS-selected sample, and the SDSS-selected sample. The median [Fe/H] of the BHB samples are indicated by the dashed lines in Fig. 7 and range from [Fe/H]= to . Our metallicity-measuring techniques are limited to the range [Fe/H], and so peaks in Fig. 7 at [Fe/H]= and 0 are likely stars with lower/higher metallicities piling up at the limits. We caution that the distributions in Fig. 7 are the observed and not the intrinsic distributions: because BHB luminosities have a mild dependence on metallicity, stars of different [Fe/H] are sampled from different volumes of space (see below). However, it is clear that our BHB samples are predominantly metal-poor and therefore consistent with a halo population.
A Kolmogorov-Smirnov (K-S) two-sample test provides a simple way to evaluate whether the different BHB samples are drawn from a common parent distribution of [Fe/H]. The K-S two-sample test works by sorting an observed quantity, such as metallicity, and then comparing the cumulative distributions of two different samples with one another. The likelihood is calculated for the null hypothesis that the two distributions are drawn from the same parent distribution. We test the metallicity distributions in Fig. 7 in a pairwise fashion, and find likelihood values ranging from 14% to 60%. Thus our BHB samples are consistent with the null hypothesis that the metallicity distributions come from the same (halo) population.
3.3. Spatial Distribution
We calculate luminosities for our field BHB stars using the relation from Clewley et al. (2004). This relation assumes the Hipparcos-derived zero point, at [Fe/H] = (Gould & Popowski, 1998), a -metallicity slope based on RR Lyrae stars in the Large Magellanic Cloud (Clementini et al., 2003), and the PSB cubic relation in (B V)0 to provide the temperature correction. Although the PSB -color relation was derived for globular cluster BHB stars, the shape of the relation reflects the physics common to all BHB stars, as explained above. Note that we do not measure (B V)0 directly. For the SDSS sample, we are able to make accurate estimates of (B V)0 from SDSS colors. For the 2MASS sample, we use 2MASS photometry and Balmer line strengths to estimate (B V)0 as described in Paper I. We refer to these (B V)0 estimates as . From the derived luminosities we compute distances. We expect the relative distances of our BHB stars have a precision of 6%.

Because the luminosity of a BHB star is dependent on metallicity, the depths reached by our flux-limited samples are dependent on metallicity. Fig. 8 shows the distribution of [Fe/H] for the 2MASS- and SDSS-selected samples as a function of , the distance above or below the Galactic plane. The dotted lines represent the magnitude limits for a BHB star at the median Galactic latitude and at the median color of our samples. Metal-rich BHB stars are intrinsically fainter than metal-poor BHB stars. Fig. 8 shows that we sample BHB stars with [Fe/H] to 82% the depth of BHB stars with [Fe/H].

The BHB luminosity dependence on color is stronger than the dependence on metallicity. Thus there is a strong selection bias with stellar color. In Fig. 9 we plot the distribution of color for the 2MASS- and SDSS-selected samples as a function of . The dotted lines represent the magnitude limits for a BHB star at the median Galactic latitude and at the median metallicity [Fe/H] of our samples. Fig. 9 shows that we sample BHB stars with to only 64% of the depth that we detect BHB stars with . The intrinsically faintest BHB stars are the bluest BHB stars hooking down off the horizontal branch in an H-R diagram. These faint BHB stars are sampled in a smaller volume than the more luminous BHB stars in our samples.

We now plot the spatial distribution of the original Century Survey, the 2MASS-selected, and the SDSS-selected BHB samples (Fig. 10). Spatial distribution is traditionally displayed in a wedge plot for survey slices like ours. However, a wedge plot is inappropriate in the context of the Galaxy, where a slice in celestial coordinates cuts across varying Galactic latitudes. The density of halo and disk populations is a strong function of both , the distance along the Galactic plane, and (e.g. Siegel et al., 2002). Thus in Fig. 10 we plot the distribution of BHB stars as a function of and . Indeed, the observed distribution of BHB stars clearly depends on both and .
The 2MASS- and SDSS-selected BHB candidates sample complementary ranges of distances, but the overlap is unfortunately minimal. The 2MASS and SDSS catalogs formally overlap between 15 and 15.5 magnitude. However, in this magnitude range, the 2MASS BHB selection suffers from incompleteness due to large color errors and the SDSS BHB selection likely suffers from incompleteness due to saturation problems.
3.4. Mean Galactic Rotation
There is wide disagreement in the literature on whether the stellar halo rotates significantly. Previous surveys have found evidence for (1) no halo rotation (Layden et al., 1996; Gould & Popowski, 1998; Martin & Morrison, 1998; Gilmore et al., 2002; Sirko et al., 2004b), (2) a small prograde rotation (Chiba & Beers, 2000), and (3) retrograde rotation (Majewski, 1992; Majewski et al., 1996; Spagna et al., 2003; Kinman et al., 2004). Interestingly, all the measurements of retrograde rotation come from surveys of the north Galactic pole. By comparison, the measurements of no rotation come from surveys covering many directions in the sky.
Our BHB samples cover a wide range of Galactic latitude and longitude, and so provide us with a “fair” sample of the halo. Although high Galactic latitude stars are not ideal for measuring the rotation of the stellar halo, the 2MASS- and SDSS-selected samples include a number of stars near that are sensitive to a systematic rotation of the halo.

Figure 11 shows the mean rotation velocity of the 2MASS- and SDSS-selected BHB stars as a function of . Each bin includes 25 BHB stars that are first corrected to the local standard of rest (Dehnen & Binney, 1998) and then evaluated by the methodology of Frenk & White (1980). We assume a solar rotation of 220 km s-1. We expect some contamination from the thick disk in the nearest BHB stars, and indeed there is a hint of prograde rotation in the kpc bin. The mean rotation velocities of the kpc stars are, however, consistent with no rotation. The rotation velocity of the combined sample of 2MASS- and SDSS-selected BHB stars is km s-1. The velocity dispersion of the BHB stars is 108 km s-1, also consistent with a halo population.
The BHB stars from the original Century Survey sample cover a similar range of . However, the Century Survey BHB stars are located towards the Galactic anti-center and towards the north Galactic pole . Thus the Century Survey stars provide very little leverage on halo rotation. When we include the Century Survey stars in the mean rotation velocity calculation, we find they add km s-1 of retrograde rotation to the bins. We conclude the mean rotation velocities remain fully consistent with no halo rotation within their errors.
4. THE LUMINOSITY FUNCTION OF BHB STARS
Knowledge of the intrinsic distribution of luminosities of field BHB stars is important for interpreting maps of the Galactic halo. Knowledge of the luminosity function is also important for understanding the intrinsic properties of field BHB stars that cover a broad range of observed magnitude, color, and metallicity. The luminosity function describes the number of stars per unit volume in the luminosity interval to . We describe the method we use to calculate the BHB luminosity function (Section 4.1), and discuss the role of the -color relation in our result (Section 4.2). We compare the luminosity function we determine for our field BHB stars (Section 4.3) with luminosity functions derived from globular clusters with BHBs (Section 4.4).
4.1. Calculating the Luminosity Function
We calculate the luminosity function of our field BHB stars using the non-parametric maximum-likelihood method of Efstathiou et al. (1988). The Efstathiou et al. (1988) maximum-likelihood method is commonly used to calculate the luminosity function of galaxies in galaxy redshift surveys. We now apply this method to our survey of BHB stars in the Galactic halo. The method does not simply count the numbers of stars at different luminosities, but weights the contribution of each star by the relative volume in which it can be observed in a flux-limited sample. Specifically, the probability of a star at distance falling into the luminosity range is equal to the luminosity function at divided by the number density of stars one expects to see in a flux-limited survey at distance . The maximum-likelihood method works by maximizing the sum of these probabilities and solving for the best-fitting luminosity function.
The density terms drop out in the maximum-likelihood formalism with two notable consequences. First, the maximum-likelihood method is unbiased by systematic density variations. The maximum-likelihood method does not require knowledge of the halo density distribution ; it only requires that the luminosity function is independent of position in the sampled volume. Secondly, the absolute normalization of the luminosity function is lost and requires a separate computation. Because stellar density varies with position in the Milky Way and because our samples are too sparse to fit the density profile directly, we compute only the form of the luminosity function, and arbitrarily normalize the luminosity functions to unity.
4.2. The Role of the -color Relation
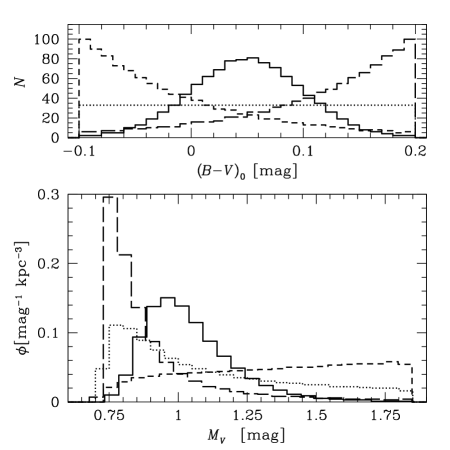
The -color relations (Fig. 6) specify only how a particular color maps to a particular . The distribution of colors is not at all specified by the -color relation. The distribution of colors is the crucial element of the luminosity function. To illustrate this point, Fig. 12 plots luminosity functions calculated for the following four intrinsic color distributions: (1) an uniform color distribution, (2) a Gaussian color distribution centered at (B V)0=0.05 with mag, and (3) exponential color distributions with scale length 0.1 mag peaking in the red and (4) the blue. Each model color distribution contains 1000 objects. For purposes of this calculation, we derive the intrinsic BHB luminosities using the PSB -color relation, though our results are nearly identical for the other -color relations in Fig. 6. The bottom panel of Fig. 12 shows the luminosity functions resulting from the four color distributions.
It is clear from Fig. 12 that the BHB luminosity function depends dramatically on the distribution of BHB colors. Each simulated luminosity function in Fig. 12 has a different shape, some with narrow distributions, others with long tails extending to faint luminosities. Moreover, the characteristic peaks of the luminosity functions vary in luminosity and total number of stars.
Even though colors are the primary indicator of BHB luminosity, we cannot compare raw distributions of colors because our field BHB stars have different luminosities and thus sample different volumes of space. To derive intrinsic properties requires knowing the luminosity function of our field BHB stars.
4.3. The Field BHB Luminosity Function


Figure 13 shows the luminosity function of the original Century Survey, the 2MASS-selected, and the SDSS-selected samples, determined from the observations of color, metallicity, and apparent magnitude. We use 0.2 magnitude wide bins to encompass any uncertainties in the derivation. Luminosities are derived with the previously stated Clewley et al. (2004) relation that uses the PSB -color relation. All three luminosity functions display the same general shape: a steep rise at bright luminosities, a peak between , and a tail at faint luminosities.
We perform K-S tests to measure the likelihood that our field BHB luminosity functions are drawn from the same parent population. The K-S test applies to unbinned distributions; we thus multiply the luminosity functions (Fig. 13) by the number of objects in the samples and distribute the ’s uniformly across each bin. The resulting likelihoods range from 37% to 57%, suggesting that our BHB samples share a common parent population. These likelihoods also mean that the bimodal distribution of luminosities in the Century Survey sample (Fig. 13a) is not statistically significant. Interestingly, all three samples share the same median mag. This agreement is rather remarkable, given the independent photometry of the three samples, and suggests that the Century Survey, 2MASS, and SDSS have consistent photometry.
Because the K-S tests suggest our three BHB samples are drawn from the same halo population, we average the three BHB samples to obtain a more robust measure of the field BHB luminosity function. We multiply each luminosity function in Fig. 13 by the total number of BHB stars in each sample, sum the luminosity functions, and then divide the result by the grand total of BHB stars. The result is plotted as the solid histogram in Fig. 14.
We re-compute the luminosity functions using the -color relations derived from (1) Demarque et al. (2000) and (2) Kenyon & Hartmann (1995). We show the results as (1) dashed and (2) dotted histograms in Fig. 14. Because we are interested in the shape of the luminosity function, we adjust the zero-points of the -color relations derived from Demarque et al. (2000) and Kenyon & Hartmann (1995) to match the zero-point of the PSB relation. Interestingly, the theoretical Demarque et al. (2000) and empirical PSB curves have very similar shape: a K-S test gives a 99% likelihood for the two samples to share a common distribution. Thus the shapes of the theoretical and empirical -color relations are similar enough to have no apparent effect on the shape of the final BHB luminosity function.
Knowledge of the BHB luminosity function allows us, in theory, to solve for the BHB density distribution. In practice, our relatively sparse samples do not provide an adequate constraint (see Fig. 15). We note that the halo power laws and scale lengths published in Siegel et al. (2002) yield reduced and so appear consistent with the distribution of our field BHB stars.
To check of the veracity of our average BHB luminosity function, we use the luminosity function in Fig. 14 (solid histogram) to calculate the expected apparent magnitude distributions of our BHB samples. Fig. 15 plots the observed number of BHB stars in the original Century Survey, the 2MASS-selected, and the SDSS-selected samples versus extinction-corrected apparent magnitude. The errorbars indicate uncertainties. The solid lines in Fig. 15 are the number of BHB stars predicted by the BHB luminosity function, assuming a power-law density profile (Siegel et al., 2002). To set the normalization, we scale the predictions to the observed number of stars in each sample. There is good agreement in the predicted shape of the magnitude distribution and the observations. The one exception is the final 2MASS bin with . We attribute the observed under-density to larger photometric errors at faint magnitudes (see Fig. 3) that scatter BHB stars out of the narrow 2MASS color-selection box, thereby reducing our completeness.
4.4. Comparison with Globular Clusters
An additional insight into our field BHB luminosity function is provided by comparison with globular cluster data. The purpose of this comparison is not to suggest that the halo is made of disrupted globular clusters. Rather, because all BHB stars share a common physical basis, we inquire whether they exhibit a common parent distribution of luminosities. Globular cluster BHB morphologies are known to vary widely because of differences in metallicity, main sequence turn-off mass, and “second-parameter” effects. We expect that our wide area surveys of the halo will sample BHB stars from the full range of BHB morphologies. We now test whether field and globular cluster BHB stars share a similar or different distribution of luminosities by comparing the shapes and median ’s of the BHB luminosity functions.

In a brief example of the virtual observatory in action, we used the NASA ADS system (Kurtz et al., 2000) to locate suitable globular cluster data for comparison with our field BHB samples. We used the query “globular cluster color magnitude diagram” and required that there be on-line data associated with the paper. The first (most recent) paper which met all our requirements is the study by Hargis et al. (2004) of M12 (NGC 6218). We followed the data link to the CDS/VIZIER system (Ochsenbein et al., 2000), from which the photometry data table was easily downloaded. Fig. 16 shows the extinction-corrected color-magnitude diagram for M12 (top left). Stars on the BHB, marked as bold points in Fig. 16, were selected by eye. M12 is relatively metal-poor [Fe/H] , similar to our halo star samples with median [Fe/H].
The inset in Fig. 16 shows the luminosity function of BHB stars in M12. There is considerable uncertainty in the distance modulus and the metallicity of M12, with values ranging from for [Fe/H] to for [Fe/H]. We calculate absolute magnitudes using the distance modulus appropriate for [Fe/H] (Hargis et al., 2004) and extinction . The median extinction to our halo BHB stars, by comparison, is mag. The M12 BHB luminosity function has median , a quarter of a magnitude brighter than our field BHB samples. The disagreement in median is significant only at the level, however, since the M12 distance modulus, the M12 extinction correction , and the zero-point are all uncertain to mag.
The shape of the M12 BHB luminosity function is nearly identical to the shape of our field BHB luminosity functions. We use a K-S test as before and calculate the likelihood that the M12 and our field BHB luminosity functions are drawn from the same distribution. Because our goal is to compare the shapes of the luminosity functions, we match the median of the observed and M12 samples when performing the K-S test. We find likelihoods ranging from 24% to 44% for our field BHB samples, indicating that they likely share the same distribution of BHB luminosities as the M12 BHB sample.
Piotto et al. (2002) provide on-line data for 74 additional globular clusters that we use for further comparison. The data come from Hubble Space Telescope and imaging from which Piotto et al. (2002) derive de-reddened and magnitudes. Because Hubble Space Telescope targeted the centers of the globular clusters, not all of the color-magnitude diagrams are as well sampled as the Hargis et al. (2004) M12 data. One third of the Piotto et al. (2002) globular clusters have horizontal branches that are non-existent or too sparsely populated to provide a meaningful comparison with our BHB samples. Of the remaining 51 globular clusters, we select the 15 with to minimize uncertainties in extinction. These 15 globular clusters span the range of metallicity [Fe/H] .
Figure 16 shows the extinction-corrected color-magnitude diagrams for the 15 globular clusters from Piotto et al. (2002). We calculate absolute magnitudes using the distance moduli and extinction values given by Piotto et al. (2002). Interestingly, each of the 15 globular clusters has a different median BHB than our BHB samples. There is no correlation with globular cluster metallicity. The average globular cluster median BHB luminosity is . Although a 0.3 mag difference from our BHB samples is not formally significant, we expected better agreement when averaging over this set of globular clusters. In Paper I, we noticed a similar 0.3 magnitude discrepancy between our absolute magnitudes and the theoretical calculations for the zero age horizontal branch. For example, the Demarque et al. (2000) model discussed here (Fig. 6) is 0.1 mag brighter than the PSB relation. If the zero-point of our relation is in error by 0.3 mag, then our BHB stars are 14% more distant than our current estimates. Given the strong dependence of BHB luminosity on color, it may be worth re-visiting the PSB analysis and their zero point.
The shape of the Piotto et al. (2002) globular cluster BHB luminosity functions are in good agreement with our field BHB luminosity functions. The globular cluster BHB stars are marked as bold points in Fig. 16. We select BHB stars by color/magnitude cuts, imposing the same limits and as for our samples. The insets in Fig. 16 show the luminosity functions of globular cluster BHB stars. We perform K-S tests on the shapes of the luminosity functions as before, first matching the median of the globular cluster BHB stars to our BHB samples. The likelihoods that the BHB stars are drawn from the same distribution range from 20% to 80%, with the exception of two globular clusters. NGC 6229 and NGC 7078 (M15) have significant extended horizontal branches and thus a much broader distribution of BHB luminosities than our field BHB samples. The K-S test yields a 10% likelihood for NGC 6229, which would only allow a very marginal rejection of the null hypothesis of a common parent distribution. A 1% likelihood is obtained for NGC 7078, indicating that its luminosity distribution is not consistent with our field BHB samples. We note that the metallicities of NGC 6229 and NGC 7078 are [Fe/H]= and , respectively.
Of the sixteen globular clusters displayed in Fig. 16, fourteen (88%) have luminosity functions consistent in shape with our field BHB luminosity functions. Thus, under the assumption that the -color relation is intrinsic to stars on the BHB, we find that field BHB stars in the halo and BHB stars in globular clusters with BHBs appear to share a common distribution of luminosities. The exception to this conclusion are globular clusters with significant extended BHBs; we do not see large numbers of extended BHB stars with (B V) in our samples. In the future, it would be useful to compare our field BHB luminosity function with dwarf spheroidals and open clusters.
5. CONCLUSIONS
We extend the Century Survey Galactic Halo Project based on a new 175 deg2 spectroscopic survey for BHB stars. We make use of the 2MASS and SDSS photometric catalogs, and show that the 2MASS and SDSS color-selection is 38% and 50% efficient, respectively, for BHB stars. The 2MASS selection for BHB stars is 65% complete (Brown et al., 2004), but is likely to be worse in the magnitude range because of large photometric errors scattering BHB stars out of the narrow color selection range. The SDSS completeness for BHB stars is also magnitude dependent and appears to drop to 50% in the magnitude range because of saturation problems.
We analyze the global properties of the original Century Survey, the 2MASS-selected, and SDSS-selected BHB stars, and find them consistent with a predominantly halo population. The median metallicity of the BHB stars is [Fe/H]=. K-S tests indicates that the BHB samples share a common metallicity distribution. The velocity dispersion of the BHB stars is 108 km s-1. The mean Galactic rotation of the BHB stars kpc is km s-1. Our samples also include a likely run-away B7 star 6 kpc below the Galactic plane.
The luminosity of a BHB star is primarily temperature (color) dependent. The shape of the -color relation is due to the physics of BHB stars. We show that the shape of the Preston, Shectman, & Beers (1991) observationally-derived -color relation corresponds to the Demarque et al. (2000) theoretical BHB models and to the Kenyon & Hartmann (1995) bolometric corrections. We derive luminosities to our field BHB stars under the assumption that the -color relation is instrinsic to stars on the BHB.
The -color and -metallicity relations impose selection biases on a flux-limited survey. A flux-limited survey samples hot BHB stars with (B V) to 64% of the depth for BHB stars with (B V). Similarly, flux-limited survey samples metal-rich BHB stars with [Fe/H] to 82% of the depth for metal-poor BHB stars with [Fe/H].
We calculate the luminosity function for our field BHB star samples using the maximum-likelihood method of Efstathiou et al. (1988), a technique that is non-parametric and unbiased by density inhomogeneities. The luminosity function for field BHB stars is characterized by a steep rise at bright luminosities, a peak between , and a tail at faint luminosities. We show that the luminosity function is not determined by the shape of the -color relation, but rather the way this relation is populated. We compare our luminosity functions with the BHB luminosity functions derived from sixteen different globular clusters. K-S tests indicate that globular clusters with BHBs, but not globular clusters with significant extended BHBs, have similar distributions of BHB star luminosities as our field BHB star samples.
We plan to analyze our samples of BHB stars for velocity and spatial sub-structure. Knowing the global properties and luminosity function of the BHB stars is an important step in this analysis. Furthermore, knowing the 2MASS and SDSS color-selection efficiencies and completenesses for BHB stars are guides our continuing observations. The eventual goal of our Galactic Halo Project is to identify star streams in the halo and thus to test the hierarchical picture for galaxy formation.
Appendix A DATA TABLES
Tables 2 and 3 list the photometric and spectroscopic measurements for the 2MASS-selected and SDSS-selected samples. The tables contain 257 entries and include every 2MASS- and SDSS-selected object except for the 27 G-type stars in the SDSS-selected sample. The SDSS-selected G-types have erroneous photometry, likely due to saturation problems in the SDSS. Tables 2 and 3 are presented in their entirety in the electronic edition of the Astronomical Journal. A portion of the tables are shown here for guidance regarding their format and content.
| ID | (mag) | (mag) | (mag) | (mag) | BHB | ||
|---|---|---|---|---|---|---|---|
| (1) | (2) | (3) | (4) | (5) | (6) | (7) | (8) |
| CHSS 1598 | 3:41:13.2 | 0:48:37 | 0.09 | 0 | |||
| CHSS 1599 | 3:43:57.6 | 0:08:57 | 0.09 | 0 | |||
| CHSS 1600 | 23:00:20.9 | -0:17:10 | 0.05 | 0 | |||
| CHSS 1601 | 23:02:10.7 | -1:01:10 | 0.05 | 1 | |||
| CHSS 1602 | 23:03:58.3 | -1:08:12 | 0.04 | 1 |
Note. — Table 2 is presented in its entirety in the electronic edition of the Astronomical Journal. A portion is shown here for guidance and content.
| Dist | ||||||||||
|---|---|---|---|---|---|---|---|---|---|---|
| ID | KP | HP2 | GP | (km s-1) | Type | (K) | (cm s-2) | [Fe/H] | (kpc) | (mag) |
| (1) | (2) | (3) | (4) | (5) | (6) | (7) | (8) | (9) | (10) | (11) |
| CHSS 1598 | 1.97 | 11.00 | 0.89 | 8413 | 4.99 | |||||
| CHSS 1599 | 1.72 | 10.11 | 1.38 | 8243 | 4.99 | |||||
| CHSS 1600 | 1.90 | 10.07 | 0.81 | 8208 | 4.99 | |||||
| CHSS 1601 | 0.47 | 10.91 | 0.05 | 9111 | 3.50 | |||||
| CHSS 1602 | 0.31 | 10.91 | 0.27 | 9095 | 3.50 |
Note. — Table 3 is presented in its entirety in the electronic edition of the Astronomical Journal. A portion is shown here for guidance and content.
Table 2 summarizes the photometry. Column (1) is our identifier. The designation CHSS stands for Century Halo Star Survey and is chosen to be unique from previous surveys. Column (2) is the J2000 right ascension in hours, minutes, and seconds. Column (3) is the J2000 declination in degrees, arcminutes, and arcseconds. Column (4) is the 2MASS extinction-corrected magnitude for the 2MASS-selected stars. Column (5) is the SDSS extinction-corrected magnitude for the SDSS-selected stars. Column (6) is the reddening value from Schlegel, Finkbeiner, & Davis (1998). Column (7) is the color predicted from 2MASS or SDSS photometry and Balmer line strengths (Brown et al., 2003). Column (8) is the BHB classification: 1 if the star is BHB, 0 if it is not.
Table 3 summarizes the spectroscopic and stellar parameters. Column (1) is our identifier. Column (2) is the KP (Ca II) index. Column (3) is the HP2 (H) index. Column (4) is the GP (G-band) index. Column (5) is the heliocentric radial velocity in km s-1. Column (6) is the spectral type, where B0=10, A0=20, F0=30, and so forth. Column (7) is the effective temperature in K. Column (8) is the log base 10 of the surface gravity in cm s-2. Column (9) is the metallicity given as the logarithmic [Fe/H] ratio relative to the Sun. Column (10) is the estimated distance in kpc. Column (11) is the absolute magnitude corrected for reddening, given the estimated distance.
References
- Abazajian et al. (2003) Abazajian, K. et al. 2003, AJ, 126, 2081
- Abazajian et al. (2004) —. 2004, AJ, 128, 502
- Allende Prieto (2003) Allende Prieto, C. 2003, MNRAS, 339, 1111
- Arnold & Gilmore (1992) Arnold, R. & Gilmore, G. 1992, MNRAS, 257, 225
- Beers et al. (1999) Beers, T. C., Rossi, S., Norris, J. E., Ryan, S. G., & Shefler, T. 1999, AJ, 117, 981
- Bowers & Deeming (1984) Bowers, R. L. & Deeming, T. 1984, Astrophysics: Stars, Vol. 1 (Boston: Jones and Bartlett Publishers, Inc.)
- Brown et al. (2003) Brown, W. R., Allende Prieto, C., Beers, T. C., Wilhelm, R., Geller, M. J., Kenyon, S. J., & Kurtz, M. J. 2003, AJ, 126, 1362, Paper I
- Brown et al. (2004) Brown, W. R., Geller, M. J., Kenyon, S. J., Beers, T. C., Kurtz, M. J., & Roll, J. B. 2004, AJ, 127, 1555
- Carney et al. (2005) Carney, B. W., Latham, D. W., & Laird, J. B. 2005, AJ, 129, 466
- Chiba & Beers (2000) Chiba, M. & Beers, T. C. 2000, AJ, 119, 2843
- Clementini et al. (2003) Clementini, G., Gratton, R., Bragaglia, A., Carretta, E., Di Fabrizio, L., & Maio, M. 2003, AJ, 125, 1309
- Clewley et al. (2004) Clewley, L., Warren, S. J., Hewett, P. C., Norris, J. E., & Evans, N. W. 2004, MNRAS, 352, 285
- Clewley et al. (2002) Clewley, L., Warren, S. J., Hewett, P. C., Norris, J. E., Peterson, R. C., & Evans, N. W. 2002, MNRAS, 337, 87
- Cox (2000) Cox, A. N. 2000, Allen’s Astrophysical Quantities (4th ed.; New York: Springer)
- Cutri et al. (2003) Cutri, R. M. et al. 2003, VizieR Online Data Catalog, 2246
- Dehnen & Binney (1998) Dehnen, W. & Binney, J. J. 1998, MNRAS, 298, 387
- Demarque et al. (2000) Demarque, P., Zinn, R., Lee, Y., & Yi, S. 2000, AJ, 119, 1398
- Efstathiou et al. (1988) Efstathiou, G., Ellis, R. S., & Peterson, B. A. 1988, MNRAS, 232, 431
- Fabricant et al. (1998) Fabricant, D., Cheimets, P., Caldwell, N., & Geary, J. 1998, PASP, 110, 79
- Frenk & White (1980) Frenk, C. S. & White, S. D. M. 1980, MNRAS, 193, 295
- Gilmore et al. (2002) Gilmore, G., Wyse, R. F. G., & Norris, J. E. 2002, ApJ, 574, L39
- Gould & Popowski (1998) Gould, A. & Popowski, P. 1998, ApJ, 508, 844
- Green & Demarque (1996) Green, E. M. & Demarque, P. 1996, VizieR Online Data Catalog, 6040, 0
- Hargis et al. (2004) Hargis, J. R., Sandquist, E. L., & Bolte, M. 2004, ApJ, 608, 243
- Kenyon & Hartmann (1995) Kenyon, S. J. & Hartmann, L. 1995, ApJS, 101, 117
- Kinman et al. (2004) Kinman, T. D., Bragaglia, A., Cacciari, C., Buzzoni, A., & Spagna, A. 2004, astro-ph/0410736
- Kinman et al. (1994) Kinman, T. D., Suntzeff, N. B., & Kraft, R. P. 1994, AJ, 108, 1722
- Kurtz et al. (2000) Kurtz, M. J., Eichhorn, G., Accomazzi, A., Grant, C. S., Murray, S. S., & Watson, J. M. 2000, A&AS, 143, 41
- Layden et al. (1996) Layden, A. C., Hanson, R. B., Hawley, S. L., Klemola, A. R., & Hanley, C. J. 1996, AJ, 112, 2110
- Lejeune et al. (1998) Lejeune, T., Cuisinier, F., & Buser, R. 1998, VizieR Online Data Catalog, 413, 65
- Majewski (1992) Majewski, S. R. 1992, ApJS, 78, 87
- Majewski et al. (1996) Majewski, S. R., Munn, J. A., & Hawley, S. L. 1996, ApJ, 459, L73
- Martin & Morrison (1998) Martin, J. C. & Morrison, H. L. 1998, AJ, 116, 1724
- Norris & Hawkins (1991) Norris, J. E. & Hawkins, M. R. S. 1991, ApJ, 380, 104
- Ochsenbein et al. (2000) Ochsenbein, F., Bauer, P., & Marcout, J. 2000, A&AS, 143, 23
- Pier (1983) Pier, J. R. 1983, ApJS, 53, 791
- Piotto et al. (2002) Piotto, G. et al. 2002, A&A, 391, 945
- Preston, Beers, & Shectman (1994) Preston, G. W., Beers, T. C., & Shectman, S. A. 1994, AJ, 108, 538
- Preston, Shectman, & Beers (1991) Preston, G. W., Shectman, S. A., & Beers, T. C. 1991, ApJ, 375, 121
- Preston & Sneden (2000) Preston, G. W. & Sneden, C. 2000, AJ, 120, 1014
- Schlegel, Finkbeiner, & Davis (1998) Schlegel, D. J., Finkbeiner, D. P., & Davis, M. 1998, ApJ, 500, 525
- Siegel et al. (2002) Siegel, M. H., Majewski, S. R., Reid, I. N., & Thompson, I. B. 2002, ApJ, 578, 151
- Sirko et al. (2004a) Sirko, E. et al. 2004a, AJ, 127, 899
- Sirko et al. (2004b) —. 2004b, AJ, 127, 914
- Sommer-Larsen et al. (1989) Sommer-Larsen, J., Christensen, P. R., & Carter, D. 1989, MNRAS, 238, 225
- Spagna et al. (2003) Spagna, A., Cacciari, C., Drimmel, R., Kinman, T., Lattanzi, M. G., & Smart, R. L. 2003, in ASP Conf. Ser. Vol. 298, 137
- Stoughton et al. (2002) Stoughton, C. et al. 2002, AJ, 123, 485
- Wilhelm, Beers, & Gray (1999a) Wilhelm, R., Beers, T. C., & Gray, R. O. 1999a, AJ, 117, 2308
- Wilhelm et al. (1999b) Wilhelm, R., Beers, T. C., Sommer-Larsen, J., Pier, J. R., Layden, A. C., Flynn, C., Rossi, S., & Christensen, P. R. 1999b, AJ, 117, 2329
- Yanny et al. (2000) Yanny, B. et al. 2000, ApJ, 540, 825
- York et al. (2000) York, D. G. et al. 2000, AJ, 120, 1579