11email: matteo.chieregato@uninsubria.it 22institutetext: Istitut für Theoretische Physik der Universität Zürich, Winterthurerstrasse 190, CH-8057, Zürich, Switzerland 33institutetext: Osservatorio Astronomico di Brera, Via Bianchi 46, I-23807 Merate (LC), Italy 44institutetext: European Southern Observatory, Karl-Schwartzschild Strasse 2, D-85740 Garching, Germany
Blank Field Sources in the ROSAT HRI Brera Multiscale Wavelet catalog
The search for Blank Field Sources (BFS), i.e. X-ray sources without optical counterparts, paves the way to the identification of unusual objects in the X-ray sky. Here we present four BFS detected in the Brera Multiscale Wavelet catalog of ROSAT HRI observations. This sample has been selected on the basis of source brightness, distance from possible counterparts at other wavelengths, point-like shape and good estimate of the X-ray flux (). The observed and the limiting magnitude of the optical catalogs fix a lower limit for our BFS on 40. This value puts them well beyond 90 threshold for usual source classes once HRI energy band and proper spectral shape are taken into account, leaving room for speculation on their nature. Three BFS show also evidence of a transient behaviour.
Key Words.:
X-rays: general, Stars: neutron, X-rays: galaxies: clusters, BL Lacertae objects: general, Quasars: general1 Introduction
It is well known that one can discriminate among classes of X-ray sources evaluating the ratio between their fluxes in X-ray and optical bands (e.g. Maccacaro et al. macca1988 (1988); Motch et al. motch1998 (1998); Zickgraf et al. zick2003 (2003)), especially if some spectral information is supplemented. Blank Field Sources (BFS), i.e. X-ray sources with no optical counterparts, stand somehow apart from the bulk of X-ray zoology in that they represent rarer, less studied objects (e.g. Cagnoni et al. ila2002 (2002)). In particular, known X-ray sources concentrate at not too high values of , e.g., stars have 1, galaxies and AGN reach of a few tens. At larger values of , peculiar populations start to show up: some examples are isolated neutron stars, type 2 quasars, extreme BL Lacs or high-redshift clusters of galaxies.
The search of BFS aims at objects with high : the observed X-ray flux and the upper limit from the absence of an optical detection establish a lower limit on the . A careful selection of bright BFS is therefore a powerful tool for finding population leftovers from usual source classes. The status of BFS is somehow a transitory condition that expresses our lack of knowledge on the real nature of these sources. New X-ray observations can provide temporal and spectral information on BFS, while deeper optical/near IR pointings can either reveal the counterpart or establish a much stronger lower limit on the . With the aid of these information, BFS can be identified and classified properly.
In this paper we present a sample of luminous BFS from the ROSAT HRI Brera Multiscale Wavelet catalog (BMW-HRI: Panzera et al. panz2003 (2003); Campana et al. camp1999 (1999); Lazzati et al. lazz1999 (1999)), with 111Actually this value is , see Section 2., along with archival X-ray spectral data from other observations (when available). This is the first study to exploit all ROSAT HRI data for BFS search (see Musso et al. musso1998 (1998) for the first search on a much smaller dataset). A key factor in the identification process is the uncertainty of the X-ray position (see Cagnoni et al. ila2002 (2002); Rutledge et al. rut2003 (2003)); on this respect, the use of HRI rather than ROSAT PSPC images for searching BFS is much superior.
The paper is organized as follows: in Section 2 we briefly describe the BMW-HRI catalog and its cross-identification program with optical, infrared and radio catalogs, in Section 3 we introduce the method of sample selection, while the final sample of BFS is presented in Section 4. In Section 5 we discuss the possible nature of BFS and future search plans are mentioned in Section 6.
2 The BMW-HRI catalog
2.1 Catalog description
The BMW-HRI catalog (Panzera et al. panz2003 (2003)) is derived from an analysis of the ROSAT HRI data set with a source detection algorithm based on the wavelet transform (Lazzati et al. lazz1999 (1999); Campana et al. camp1999 (1999)).
The up-to-date version of the catalog contains 28998 entries, down to a count rate of cts s-1. The total sky coverage is 732 deg2 ( 1.8 of the sky). For each entry name, position, count rate, extension and relative errors are provided, along with derived parameters like flux and Galactic column density and ancillary information about the pointing. Furthermore, results of cross-correlations with GSC2, 2MASS, IRAS, and FIRST catalogs are reported (see Section 2.2 and Table 1). In the following, some of the basic characteristics of the catalog are discussed in order to permit an understanding of the BFS selection method. Further details can be found in Panzera et al. (panz2003 (2003)).
Extension. The wavelet transform is particularly powerful in dealing with extended sources. In practice, each detected source is characterized by its extension, alongside with the more usual parameters (count rate and position). Extended sources, especially when observed at large off-axis angles, are often broken in various point-like sources by other detection algorithms. This risk is minimized by the wavelet transform.
Detection threshold and spurious sources. Each BMW-HRI source is characterized also by a detection probability value (peak significance). This value is the probability, in units of Gaussian , that the source is not spurious (i.e. a background fluctuation). This probability is the result of numerical simulations of random fields (without sources), repeated for different wavelet transform scales; it takes into account the number of background peaks mismatched as sources by the detection algorithm, for a given signal to noise ratio threshold in wavelet space. The mean number of spurious sources expected over an image is kept constant (0.4 spurious detections per field), varying the detection threshold. That is, the detection threshold depends on the mean background counts value on the image and on the scale at which the search is performed (see Lazzati et al. lazz1999 (1999)). The mean threshold value in the overall catalog is .
Errors. In principle, the error for each parameter found with the wavelet transform algorithm can be estimated from the covariance matrix. In practice, such errors are reliable only when the number of source and background counts are sufficiently high ( counts per pixel). Otherwise, the distribution of the wavelet transform coefficients becomes Poissonian rather than Gaussian (in the lowest scales). If this is the case, a better estimate of the errors can be given by means of basic statistics (such as the error on the number of counts is , for more details see Lazzati et al. lazz1999 (1999)). The errors reported here and in the catalog are the maximum between the covariance matrix and the statistical estimates by Lazzati et al. (lazz1999 (1999)).
Boresight correction uncertainty. There is an additional source of errors on the absolute position determination of HRI sources, the uncertainty on the boresight correction. If the alignment between the node and the telescope optical axis is perfect, on-axis images are exactly in the center of the instrument. However, in the real situation there is always a finite misalignment that needs to be corrected. Unfortunately, uncertainties in the aspect solution (that describes the orientation of the telescope as a function of time) and errors in the alignment between the star trackers and the ROSAT X-ray Telescope introduce uncertainties in the boresight correction, of variable size for each observation. In practice, the systematic offset between accurately known optical positions and X-ray positions can be used to evaluate the extent of boresight correction uncertainties. For the ROSAT HRI, the offset can be as large as , even if in most cases it will be much less (David et al. david1998 (1998)). The value is conservatively assumed as a fiducial value for the boresight offset. Usually, the statistical errors on the position from the detection algorithm, calculated as in the previous section, are much less than and therefore can be neglected in a first approximation.
Multiple detections. As each pointing is treated separately, not all of the catalog entries correspond to independent sources. An estimate of the overall number of independent sources can be given compressing the catalog in a radius (again, the fiducial error value indicated by the boresight uncertainty). This procedure selects only a source for each cone radius, on the basis of an autocorrelation of the position. With this procedure, 20433 sources are left. Obviously, the compression brings to the loss of sources truly close to each other.
2.2 Multiwavelength catalog cross correlations
In the following, we will largely use the term off-band to indicate a wavelength passband different from X-rays. The limiting flux of a given catalog in a given band will be generically denominated . For each of the BMW-HRI entries, cross correlations with GSC2 (McLean et al. mclean2005 (2005)), 2MASS Second Data Release (Kleinmann et al. klein1994 (1994)), IRAS Point Source Catalog (Beichman et al. beich1988 (1988)) and FIRST Survey Catalog (White et al. white1997 (1997)) were performed by Panzera et al. (panz2003 (2003)). Off-band catalog properties are summarized in Table 1. The adopted radius for the cross-correlation is (see Section 2.1), assumed as positional X-ray uncertainty. In fact, the positional uncertainties for GSC2, 2MASS SDR and FIRST catalogs are (, McLean et al. mclean2005 (2005)), (, see the 2MASS documentation for an extensive discussion), (, McMahon et al. mcmahon2001 (2001)) respectively, so that they can be safely neglected for cross-identification purposes. An exception is the case of IRAS PSC, for which the positional accuracy varies with source size, brightness and spectral shape and it is different in different directions, but it is usually better than (see Beichman et al. beich1988 (1988)), so this last value has been used as cross-correlation radius with this catalog. Note that: a) when two or more entries in the correlating catalog are found, only the brightest source parameters are reported (but in any case the number of found sources is given), b) the sky coverage of the off-band catalogs is usually not complete (see again Table 1). In particular, the preliminary, unpublished version of the GSC2 (GSC2.3) catalog used in Panzera et al. (panz2003 (2003)) lacks coverage of the zones where a bright source caused an overexposure of the Schmidt plates. For the 2MASS and FIRST, more complete catalogs are now available (2MASS All Sky Data Release, FIRST Survey Catalog 03Apr11 Version). Our final list has been checked with them.
| Catalog | Survey | Band | Coverage | Depth |
| GSC2 | POSSII | BJ | Dec: | 22.5 |
| (prel.) | “ | R | Dec: | 20.8 |
| “ | I | Dec: ∗ | 19.5 | |
| SERC | BJ | Dec: | 23 | |
| “ +AAO | R | Dec: | 22 | |
| “ | I | Dec: ∗ | 19.5 | |
| 2MASS SDR | 2MASS | J | 50 sky | 15.8 |
| (2000) | H | 50 sky | 15.1 | |
| K | 50 sky | 14.3 | ||
| IRAS PSC | IRAS | 12 m | 98 sky | 0.4 Jy |
| (1989) | 25 m | 98 sky | 0.5 Jy | |
| 60 m | 98 sky | 0.6 Jy | ||
| 100 m | 98 sky | 1.0 Jy | ||
| FIRST SC | FIRST | 1.4 GHz | 20 sky | 1 mJy |
| (2001) |
∗ work in progress.
3 Sample selection
3.1 Catalog mask
The first sample selection was made on the basis of the following criteria:
-
a.
blank field sources, i.e. without any cross identification in the other databases (see Section 2.2 and Table 1): 6061 catalog entries;
-
b.
point-like sources (significance of the extension=0): 4955 catalog entries;
-
c.
bright sources, i.e. with erg s-1 cm-2: 275 catalog entries.
The reported numbers are catalog entries, i.e. no compression was applied to eliminate multiple detections (see Section 3.2 below). The we used is computed from the observed source counts, in the 0.5-2 keV range, considering only channels 2-9 (e.g. David et al. david1998 (1998)). The assumed spectral shape is a power law with photon index =2 (i.e. the same of the Crab pulsar and nebula) and column density atoms cm-2 (parameter 48 in the BMW-HRI catalog). The chosen model for the count rate-flux conversion uses constant negligible column density, instead of the integrated Galactic one in the source direction. While the latter is commonly adopted in extragalactic surveys, it would introduce a larger error on low-latitude galactic BFS, which are expected to be low-luminosity, nearby objects (see Section 5). Furthermore, the chosen derived with this choice is lower than the one with Galactic NH, so the obtained limit is lower. We chose to select sources on the basis of and not of, for example, . This brings naturally to different ratios for sources in different parts of the sky, due to the variable depths of the surveys available to us. However, in such a way the selection is based on a directly observed quantity, the number of counts, not on the basis of a non-detection, and it provides a more homogeneous sample for future observations. We carefully evaluated the keeping into account the different depths and photometric band used in the different catalogs. The obtained lower limit for the from the GSC2 catalog are (Northern sky), (Southern sky), (Northern sky), (Southern sky). A detailed description of method and used values can be found in Chieregato (chie2005 (2005)).
In conclusion, at odds with the majority of similar studies, our sources are blank at various wavelengths (see again Table 1). We note also that, although we selected point-like sources, we cannot exclude that the real nature of some source is extended (i.e. only the brightest peak has been detected with HRI).
3.2 Multiple detections removal
The removal of multiple detections from the sample could be done, in principle, using automatic compression criteria (position based), like in Section 2.1. However, given the limited entity of our sample of BFS candidates (275 elements), we preferred to remove multiple detections by hand to avoid, when possible, the loss of sources truly close to each other.
We used positional coincidence as the main criterion for identifying multiple detections. Another useful piece of information was the flux level. Unfortunately, positional coincidence can be weakened by the boresight uncertainty, while obviously the flux criterion is not fulfilled for highly variable sources. In practice multiple detections were reasonably identified in most of the cases. After multiple detections removal, we are left with 226 catalog entries.
3.3 Total counts cut
We made a further screening on the number of total counts, rejecting sources with less than 25 photons (on the original detection, i.e. before applying vignetting and Point Spread Function loss corrections). This has been done in order to strengthen the derived source parameters (obviously, due to the statistics increase). After the total counts cut, we are left with 201 sources.
3.4 Are the BFS sources real?
We re-evaluated the number of spurious sources expected in this 201 subsample, again on the basis of simulations of random fields with the above masks. In particular, the flux cut is very effective in the removal of spurious sources. In fact, the expected number of spurious source is in the 201 subsample (see Moretti et al. moretti2004 (2004)). Our BFS are therefore likely not to be fake detections.
3.5 Visual inspection: when a blank is not a blank
We inspected Digitized Sky Survey 2 (DSS2; McLean et al. mclean2000 (2000)), Super Cosmos Sky (SSS; Hambly et al. hambly2001 (2001)), 2MASS, FIRST, Sydney University Molonglo Sky Survey (SUMSS; Bock et al. bock1999 (1999)), NRAO VLA Sky Survey (NVSS; Condon et al. condon1998 (1998)) and Westerbork Norther Sky Survey (WENSS; Rengelink et al. rengelink1997 (1997)) images for each of the 201 sources left. Furthermore, we cross-checked source positions with Simbad, NED and with the VIZIER catalogs (in particular the USNO-B1 catalog, Monet et al. monet2003 (2003)). We excluded from the sample sources and fields already known and well studied or too complex (e.g. Magellanic Clouds, M31, Orion Nebula). We excluded also sources positionally coincident with bright stars (holes in the GSC2 coverage), or at the periphery of optically extended emission (more than from the centroid and so escaped the automatic cross-identification). We found, and excluded, some cases in which our X-ray sources coincided with reliable USNOB1.0 entries (the criteria for the GSC2 detection are somewhat more conservative), or with counterparts at other wavelengths (IRAS Faint Sources Catalog, Moshir et al. moshir1990 (1990)). We prefer not to be too severe at this stage, deferring strict cuts after the boresight correction. 72 sources survived this phase.
3.6 Cheshire cat: elimination of fluctuations
We put aside from the primary sample sources which have not been detected in a longer HRI or ROSAT PSPC pointing (the PSPC had the same passband but a substantially larger effective area than the HRI). These could be variable sources detected at peak flux, but they are also candidates for false detections. No source has been inserted in this subclass on a non-detection basis with other instruments, because of the different passband, i.e., given the absence of spectral information on our sources, the non-detection could be ought to a peculiar spectral shape. For some sources the suspicion of a false detection is strengthened by the number of non-detections or by the respective length of the pointings. However, there are cases for which source parameters like detection probability and number of counts seem to indicate a real source. Furthermore, as discussed in Section 3.4, we expected only spurious detection in 201 sources. Of the 72 sources, 16 were placed in this transient candidate sub-sample, while for the other 56 there was no evidence of a transient nature.
3.7 Pin-pointing the sources to the sky: boresight correction
We performed some astrometry on the remaining fields (including those of transient candidates), in order to get rid of the fiducial boresight uncertainty and therefore to fully exploit the HRI angular resolution capability. Furthermore, the error given by the detection algorithm (see Section 2.1), while not being entirely statistical, can be as a first approximation treated as random, so that the usual Gaussian relations can be used. In contrast, the offset given by the boresight uncertainty varies in a random way in the ensemble of all the pointings, but is systematic in nature for all the sources in the single pointing, weakening the rejection of distant optical associations to BFS.
For each pointing, we matched X-ray sources to optical counterparts (optical positions of known X-ray emitters), if any, or to optical catalog sources distant less than . We excluded X-ray extended sources and sources with no optical catalog entry in . Ambiguous cases, i.e. with two or more optical sources present, were treated individually using the distance and the optical luminosity as criteria for the identification and then checked a posteriori. Even if only another X-ray source was present, the shift for this source has been applied to the pointing, although obviously in these cases the corrected positions and uncertainties have to be taken cum grano salis. Generally, the new error is less than ; even if it remains around , the new position should be free from systematic boresight uncertainty. Note that performing the boresight correction only after the selection of Section 3.1 can bring to the loss of BFS. However, this allows us to deal with a limited number of sources and boresight corrections.
4 The data
The elimination of sources with an off-band counterpart in a radius from the boresight corrected position left us with our final sample of four sources (three of them transient candidates). This limit assures us that starting with 1340 sources (i.e. sources outside the inner in the BMW-HRI catalog and obeying to the cuts above unless th lack of counterparts), only 0.08 of them would lie outside the error region by chance.
In summary, our final BMW-HRI Blank Fields Sources are:
-
•
Blank: no counterpart at other wavelengths in a radius from the boresight corrected position.
-
•
Bright: erg s-1 cm-2. Note that from the GSC2 magnitude limit, this is equivalent to respectively 37 and 59 for Northern and Southern sources.
-
•
Point-like: extension significance is 0.
-
•
Well detected: total (uncorrected) counts 25.
After this selection we end up with one persistent BFS plus three transient BFS. We report the new positions and error radii (as obtained from the boresight correction procedure), the flux, the detection probability (i.e. the probability to detect a background fluctuation as a source), the total number of counts, the Galactic coordinates, the integrated Galactic column density, the distance from the nearest off-band association (in terms of error radii), the lower limit on the and the upper limit on the radio emission (see Table 2). Note that, though with different depth, all but one (1BMW200739.8-484819) of the sources have a radio flux upper limit.
| Name | R.A. | Dec | bII | Err. rad. | Flux | Prob. | Cts | NH | Close ass. | |
|---|---|---|---|---|---|---|---|---|---|---|
| J2000 | J2000 | ′′ | erg cm-2 s-1 | cm-2 | (sigma) | |||||
| 1BMW042142.4-571541 | 04 21 42.6 | -57 15 39 | -42.54 | 2.9 | 6.5 | 14.0 | 742 | 1.8 | 5.3 | |
| 1BMW135703.0+181122 | 13 57 02.9 | +18 11 21 | 72.45 | 7.1 | 3.5 | 4.2 | 112 | 2.1 | 6.3 | |
| 1BMW200739.8-484819 | 20 07 39.8 | -48 48 19 | -32.31 | 5.8 | 3.0 | 4.3 | 55 | 5.1 | 5.2 | |
| 1BMW043306.8+155307 | 04 33 06.8 | +15 53 07 | -21.16 | 6.5 | 2.9 | 4.2 | 34 | 17.0 | 4.9 |
4.1 Properties of BFS
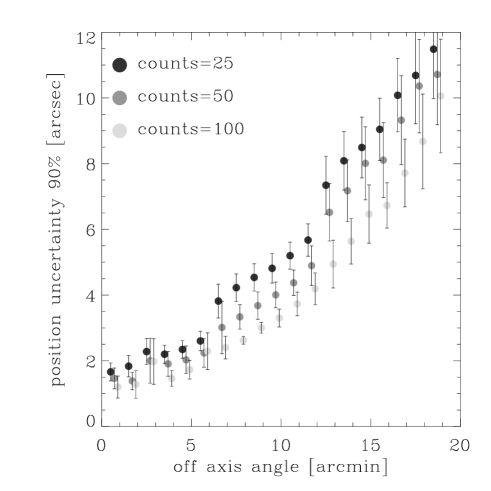
The final error radius estimate for our sources is quite different from case to case, ranging from to ; the latter large error is due to the large off-axis angle and to the low number of counts (see Fig. 1). In fact, all our sources are quite offset from the center of the pointing (). This depends from the used selection procedure and needs some comments. First, we concentrate on the consequences of the requirement of absence of offband counterparts in a radius. This affects strongly the overall distribution in detector coordinates. In fact, the fiducial radius for the initial correlation, chosen to match the worst case boresight error, is huge in comparison to the statistical positional error for the innermost sources, but it corresponds to the intrinsic error for the outermost sources (see Fig. 1). Sources in the innermost part are preferentially associated with optical counterparts which may not be the true ones, since they have been searched for over a region much larger than their error boxes. The overall effect is to deplete the distribution from inner sources, enhancing the proportion of outer sources. This bias is present independently of the real size of the boresight correction error. Second, there is a trend in overestimating outer source counts (especially at low values), since it is favorable to detect them on top of a positive background fluctuation (an effect known as Eddington bias, see Hasinger et al. hasinger1993 (1993); Moretti et al. moretti2002 (2002)). This again adds on the enhancement of outer sources. The first bias leads to the loss of BFS, but it does not affect our selected sources. The effect of the second bias on the estimated flux can be evaluated a posteriori from the duration of the pointings and the number of counts. Very conservative assumptions give a factor of as the maximum overestimate.
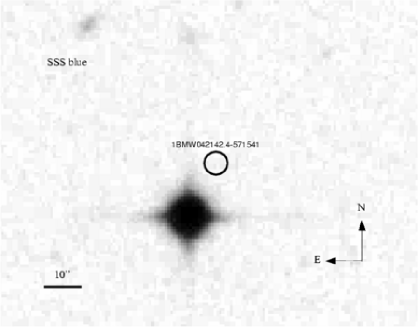
4.2 1BMW042142.4-571541
This source is the brightest of our sample and the one with the highest number of detected photons. The good statistics involves a small detection algorithm error radius, so the position determination is quite accurate (see Fig. 2). The boresight correction was performed with the known position of the quasar HE 0419-5657 and the nucleus of NGC 1547 as well as with other eleven sources matched to optical catalogs. The source is close ( but actually more than 5 ) to a bright star (BJ=13.31, F=11.61 in the GSC2.2); this makes less reliable the lower limit on the , in particular in the red band. There are two fake USNO B1.0 sources along the saturation spikes of the bright star (see Fig. 2). The source was observed with Einstein (1E 0420.7-5723) and with the ROSAT PSPC (1WGAJ0421.7-5716) and was also detected as a RASS Bright Source (1RXS J042144.0-571601). The WGA computed flux is erg cm-2 s-1, consistent with the RASS count rate. Taking into account the caveats on the count rate to flux conversion, this could mean that there is no evidence for long term flux variations.
We re-extracted the archival PSPC observation of this source (sequence rp700034n00). The source was very close to the PSPC rib; despite this, we attempted a rough spectral analysis. We extracted source photons from a circle of radius centered on source position. We used as background region a circle of radius , centered in an empty region south of the source. The collected counts were 321. We rebinned channels by a variable factor in order to have at least 20 photons in each bin. Channels 1-11 and 136-256 were ignored. Figure 3 shows the resulting spectrum, which we then fitted with XSPEC (v.11.2). Due to the poor statistics, we considered a limited number of models, as shown in Table 3. The spectrum is definitely soft, without evidence of absorption excess. The best fit absorbed blackbody model tends to null absorption, with a upper limit on column density of atoms cm-2. The power law fit gives a relatively better reduced (1.3 versus 1.4). Furthermore, the best column density value is quite close to the integrated Galactic value of atoms cm-2 (see Fig. 3). Freezing absorption at the Galactic value, the reduced does not change appreciably. The bremsstrahlung fit gives the best reduced (1.3) and the column density is atoms cm-2.
| Model | NH | kT / | Flux(0.1-2 keV) | |
| cm-2 | keV | cgs | ||
| B.body | 5.6 | 1.4 | ||
| B.body | 1.8(frozen) | 6.9 | 1.9 | |
| Pow.-law | 6.5 | 1.3 | ||
| Pow.-law | 1.8(frozen) | 6.5 | 1.2 | |
| Bremss. | 6.2 | 1.3 | ||
| Bremms. | 1.8(frozen) | 6.2 | 1.2 |

4.3 Transient BFS
In this section are presented three sources (see Table 2) that, while fulfilling all the others criteria for BFS, show additional strong evidence of a transient behaviour. In fact, despite their brightness in the BMW-HRI catalog ( erg s-1 cm-2), for each of them there is at least another ROSAT HRI or PSPC pointing where they have not been detected (deeper than the HRI exposure that revealed them).
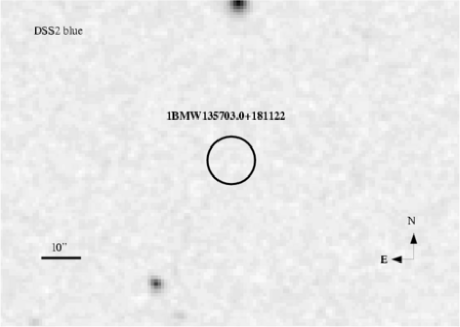
1BMW135703.0+181121. 1BMW135703.0+181121 has been detected in a 5.5 ks HRI pointing in Jan. 1998; we included it in the possible transient sub-sample since it has not been detected in three longer PSPC pointings (11.4 ks, Jan. 1992; 8 ks, Jul. 1990; 5.6 ks, Jul. 1992; also it was not seen in a shorter 1.1 ks HRI pointing in Jan. 1992). The high number of counts detected points toward a real, transient source. The boresight corrected position has been obtained with three sources. There are no counterpart at other wavelength in a 45′′ radius (, see Fig. 4).
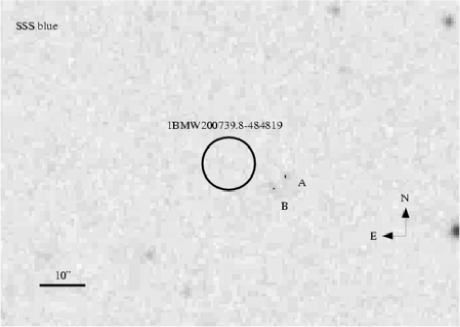
1BMW200739.8-484819. This source has been detected in a 3.2 ks pointing in Oct. 1996, while no corresponding source was observed in four other pointings of comparable length (2.6-3.6 ks) at distance of days, nor in two 11 ks ROSAT PSPC pointings in Nov. and Apr. 1992. The closest optical catalog source is at more than 30′′ (see Fig. 5) from the boresight corrected X-ray position (the boresight correction has been performed with the other two X-ray sources detected in the Oct. 1996 HRI pointing). Two objects, A and B in Fig. 5, are clearly visible in the blue SSS image, respectively at () and (). Object B (BJ=22) is reported to be extended, object A (BJ=22.3) is possibly extended too. Oddly, while nothing is apparent at that position in the red SSS image, a source can be seen both in the shallower ESOI RED image and in the SSS I image, at a position almost coincident with object B, with RF=20.2 (more than 2 mag brighter than in the Schmidt plate limit) and IN=19.0. An obvious hypothesis could be the presence of an optically variable source, that perhaps could be identified with 1BMW200739.8-484819.
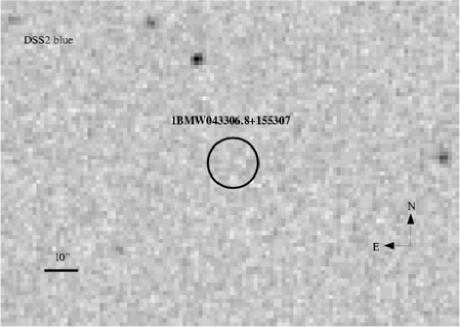
1BMW043306.8+155307. The observation in which this source was detected (2 ks in Feb. 1998) is part of the Hyades ROSAT campaign. The source is included among transients due to its non-detection in four PSPC pointings (of 2.4 ks, Feb. 1991; 1.9 ks, Mar. 1991; 16.6 ks, Sep. 1992; 19.6 ks, Aug. 1993). In all the four PSPC pointings the source was at much larger off-axis angle than in the HRI one ( versus ). The boresight correction was done with three sources. There are no possible counterparts in a () radius from the source position, where there is a source detected only in the APM North Catalog (E=19.8), not visible in the DSS2 digitized sky images. The other closest source is at (, see Fig. 6).
5 Discussion: nature of the blank fields
In order to proceed further with hypotheses on BFS nature we need to compare the limits of BFS with existing classification schemes. We chose as a reference scheme the one of the RASS-Hamburg optical identification program (Zickgraf et al. zick2003 (2003)), which uses similar X-ray (0.1-2.4 keV) and optical (Johnson B) bands. We converted the RASS-Hamburg limits (see Table 6 of Zickgraf et al. zick2003 (2003)) to BMW-HRI and GSC2 (the deepest GSC2 band), keeping into account the different X-ray energy band and spectral shape used for flux evaluation, and the different optical band. The resulting classification scheme is shown in Table 4 (see Chieregato chie2005 (2005) for details about the conversion). The lower limits of BFS, 37 in the Northern sky and 59 and in the Southern sky (due to different GSC2 depth, see Table 1), are a factor of and 3 beyond the limits of our reference values for different classes, respectively. This points out the possibility that BFS are unusual objects, left outside from classifications, or at least very peculiar members of the more ordinary categories.
| Class | Lower limit | Upper limit | B-V |
|---|---|---|---|
| Stars | 1.3 | 0.6 | -0.52 |
| White Dwarfs | 1.2 | 9.3 | -0.31.5 |
| Cat. var. | 1.8 | 4.6 | -0.11 |
| Galaxies | 3.1 | 11.1 | 0.41.5 |
| Gal. clusters | 0.2 | 16.9 | 1.01.5 |
| AGN (w. BLLacs) | 0.22 | 12.0 | -0.51 |
5.1 BFS as unusual sources
It is well known that some rare class of sources can reach extreme values of (see Cagnoni et al. ila2002 (2002)). Here we will focus on our specific sample and discuss the possibility that our BFS belong to the following categories:
-
a.
Isolated Neutron Stars (INS).
-
b.
X-ray binaries.
-
c.
High Redshift or Dark Clusters of Galaxies.
-
d.
Type 2 Quasars.
-
e.
Extreme BL Lac.
Isolated Neutron Stars.
Isolated Neutron Stars (INS; see Treves et al. treves2000 (2000), Haberl
haberl2003 (2003), Haberl haberl2004 (2004)) are extreme BFS. The bona-fide
lower limit used to assess their nature is 1000, but for
optically identified objects the real value can be as high as . The
X-ray spectrum is optimally fitted by a black body with kT60-100 eV.
The optical emission lies a factor of a few over the Rayleigh-Jeans
tail of the blackbody and no emission outside the optical/soft X-ray range has
been found. The low column densities from the X-ray spectra and the parallax
measured distance for RXJ1856.5-3754 (Walter & Lattimer walter2002 (2002))
makes this source an intrinsecally faint and closeby object, probably emitting
from the neutron star surface.
Different kind of isolated neutron stars can also reach high
values: Anomalous X-ray Pulsars (AXP; Israel, Mereghetti
& Stella isra2002 (2002)), close-by radio pulsars with substantial cooling
X-ray thermal emission (e.g. PSR 0656+14) and Geminga-like objects (Bignami &
Caraveo bigna1996 (1996)). AXPs are young, luminous and distant objects and
should be much closer to the Galactic plane than our BFS. The radio limit,
though not strong, argue against close-by cooling radio pulsars. This does not
apply to Geminga-like neutron stars for which the radio emission is only
marginal. Converting the X-ray flux of Geminga to the HRI pass-band and using
V=25.6, yields , making it concistent with our BFS candidates. In
the cooling framework, the same physical mechanism is at the basis of INS
emission and of the soft thermal component of young radio pulsars and
Geminga-like objects.
Basing on this scenario, Popov et al. (popov2003 (2003), popov2004 (2005))
produced the log N-log S of cooling neutron stars (all the three categories),
allowing us to estimate that only 1 unidentified INS is expected for
our flux and sky coverage.
If our steady BFS (1BMW042142.4-571541)) is an INS, no optical counterpart
could be revealed up to the 28 mag; therefore, this possibility
could be strengthened by the absence of optical sources in deeper
observations, reaching the critical lower limit of 1000,
corresponding to magnitude 25-26, together with a better position from
Chandra.
At the same time the well-defined properties of the X-ray emission
could be tested by observations with an instrument with sufficient soft
response, like the XMM-Newton EPIC pn camera.
X-ray binaries. Some kind of X-ray binaries can reach high values of . In particular, BFS searches have already discovered Ultraluminous X-ray Sources (ULX; e.g. Cagnoni et al. ila2003 (2003)). However, the observed flux level of BFS is too low for a Galactic object and none of our BFS can belong to nearby galaxies, excluding ULXs, supersoft sources and bursting LMXBs. Therefore, we consider unlikely known classes of X-ray binaries (see however the discussion on possible transients).
Clusters of Galaxies. BFS research has already been effective for the discovery of clusters of galaxies since Cagnoni et al. (ila2001 (2001)). Furthermore, several distant clusters have already been discovered in the BMW-HRI catalog as extended objects (Moretti et al. moretti2004 (2004)). Distant clusters may escape this selection if only the X-ray peak is bright enough to be detected, resulting in a point source, while the rest is concealed in the background. This effect is strongly favoured at large off-axis angle (and consequent PSF degradation) like those at which BFS are detected. Therefore, if some BFSs are galaxy clusters, we expect them to be at quite high redshift. The of clusters of galaxies is the highest among the X-ray emitting classes of Table 4. For normal galaxy clusters, the values reached are usually lower than those of BFS (and if only the peak of the X-ray emission is computed, the resulting is further lowered). Despite this, there are two effects that could boost the . The first, and more effective, is the redshift of the optical emission. In fact, for a redshift of 0.75, the 4000 Å break of the cD galaxy (or of any early type galaxy of the cluster) would be redder than the GSC2 F band. Even a lower redshift could result in a sufficient enhancement of the . Second, the X-ray peak could be not coincident with the optical one (if the cluster is not virialized, or if there is no cD galaxy, like in Bautz-Morgan type III clusters, or if there is a central cooling flow). Optical-near IR deeper observations should reveal a substantial increase of galaxy counts in proximity of BFS and, if there is any, the cD galaxy of the cluster. An even more strong test would be X-ray observations with Chandra or XMM-Newton, that should reveal an extended source.
BL Lacs. BL Lacs stand somehow apart from the bulk of AGNs in that they can reach high values. The unified spectral energy distribution of BL Lacs (Fossati et al. fossati1998 (1998); Ghisellini et al. ghis1998 (1998)) can be described by a two peak emission, in which the lower energy peak (radio to X-ray) is commonly ascribed to synchrotron emission, while the high energy peak (X-ray to -ray) is probably due to inverse Compton emission. In this scenario, different BL Lacs are distinguishables on the basis of the shifts of the peaks, creating the so-called blazar sequence. By tuning the position of the peaks, it is possible to produce the old categories of X-ray selected and radio selected BL Lacs, the former being those capable of high values.
In order to check the viability of BL Lacs hypothesis for BFS we consider the different (the power law index connecting the X-ray flux to the optical flux) and (the power law index connecting the X-ray flux to the radio flux) for Einstein Slew Survey Bl Lacs (Perlman et al. perlman1996 (1996)) and the upper limit for BFS. Despite the poor radio limits, the locus occupied by BFS is partially superimposed to the most extreme Slew BL Lacs, with the brightest BFS, 1BMW042142.4-571541, exhibiting an limit substantially lower. If these objects were indeed BL Lacs, they would probably stretch the sequence in the - plane, representing a still undiscovered extreme population. The identification of the optical and possibly of the radio counterpart would be very important for testing the BL Lac hypothesis. In this case, further X-ray observations should show a power law spectrum with photon, without evidence of absorption excess.
Type 2 Quasars. Evidences for a substantial population of type 2 Quasars, as requested by unification models (Urry & Padovani urrypd1995 (1995); Comastri et al. comastri1995 (1995)), has been continuously increasing in the recent past. In particular, the resolution of the largest fraction of the cosmic X-ray background in discrete sources (Hasinger et al. has1998 (1998); Mushotzky et al. mush2000 (2000); Campana et al. camp2001 (2001), Giacconi et al. giacconi2002 (2002), Moretti et al. moretti2003 (2003), Brandt & Hasinger bra2005 (2005)) has brought to infer the existence of an adequate number of highly absorbed and luminous AGNs, responsible for the hard part of the background. Up to now, while only a few type 2 quasars have been firmly identified (e.g. Stern et al. stern2002 (2002); Norman et al. norm2002 (2003)), many candidates are being produced either by deep fields, pencil beam searches (Chandra Deep Field North, Barger et al. barger2003 (2003); Chandra Deep Field South, Szokoly et al. szokoly2003 (2003); Lockman Hole, Mainieri et al. mainieri2002 (2002)), or by dedicated shallower surveys, with a substantial sky coverage (Hellas2XMM, Baldi et al. baldi2002 (2002); ChaMP, Green et al.green2003 (2003); SEXSI, Harrison et al. harrison2003 (2003); BMW-Chandra, Romano et al. romano2004 (2005)). The most striking characteristic of type 2 quasars is the severe absorption excess. In particular, this makes them Extremely Red Objects, with R-K. Therefore, if some BFS are type 2 quasar, we expect them to have a relatively bright near-IR counterpart. Unfortunately, the near-IR limit of the 2MASS (Table 1) is not sufficient to confirm or rule out this possibility. Deeper near-IR observations are therefore mandatory to test the viability of this scenario. Future X-ray spectral information could also be extremely useful, confirming or excluding the need of absorption excess to fit the spectra. A number of source capable of very high ratios was recently discovered in Chandra Deep Fields, the so-called Extreme X-ray Objects (EXO; Koekemoer et al. koe2004 (2004)). The nature of these sources is still not clear, but they share with type 2 quasars the extremely red colour. However, these sources have X-ray fluxes much fainter than BFS ( erg cm-2 s-1), so they are likely to belong to different populations.
The nature of BFS reported here is probably not-unique. In order to accomodate the possible transients in one of the above classes, a key factor is variability. The most variable candidates, BL Lacs, can vary up to a factor of (e.g. Mkn 501; Pian et al. pian1998 (1998)), enough to explain the non-detections. This makes BL Lacs appealing candidates for possible transients. The variability of type 2 quasars, instead, seems not sufficient. Other known transient source classes usually can not produce such high values. An alternative explanation could be that of a new kind of transient, capable of great flux variability but reaching much lower peak maximum luminosity. According to this idea, the would be greatly boosted by the non-simultaneity of X-ray and optical observations.
6 Follow-up projects
We wish to stress that the interpretation of BFS requires future multi-wavelength observations. Deeper optical and near-IR observations should allow us to find the optical counterpart (except possibly for INS), and future X-ray observations should give spectral and temporal insights. We already started a program of optical follow-up. In the future, more will be known on these mysterious and fascinating lacunae in the X-ray/optical sky.
Acknowledgements.
We thank Ilaria Cagnoni for inspiration and valuable help; Marina Orio and Nicola La Palombara for useful discussions. We thank the referee, Gianni Zamorani, for his constructive criticisms which improved considerably the manuscript and his patience in the review process. We acknowledge usage of HEASARC and CDS databases and tools. This work was partially supported by MIUR under contract COFIN 2002027145_002.References
- (1) Baldi, A., Molendi, S., Comastri, A. et al., 2002, ApJ 564, 190.
- (2) Barger, A.J., Cowie, L.L., Capak, P., et al. 2003, ApJ 126, 632
- (3) Beichman, C.A., et al., 1988, Infrared Astronomical Satellite (IRAS) Catalog and Atlases, vol. 1, Explanatory Supplement, NASA RP-1190 (Washington, DC:GPO).
- (4) Bignami, G. F., Caraveo, P. A. 1996, ARA&A 34, 331.
- (5) Bock, D. C.-J., Large, M. I., Sadler, E. M. 1999, AJ 117, 1578.
- (6) Brandt, W. N., Hasinger, G. 2005, ARA&A 43, in press (astro-ph/0501058).
- (7) Cagnoni, I., Elvis, M., Kim, D. W., et al., 2001, ApJ 560, 86.
- (8) Cagnoni, I., Elvis, M., Kim, D. W., et al., 2002, ApJ 579, 148.
- (9) Cagnoni, I., Turolla R., Treves A., et al., 2003, ApJ 582, 654.
- (10) Campana, S., Lazzati, D., Panzera, M. R., et al. 1999, ApJ 524, 423.
- (11) Campana, S., Moretti, A., Lazzati, D., Tagliaferri, G. 2001, ApJ 560, L19.
- (12) Chieregato, M. 2005, Ph.D. Thesis, in preparation.
- (13) Comastri, A., Setti, G., Zamorani, G., Hasinger, G. 1995, A&A 296, 1.
- (14) Condon, J. J., Cotton, W. D., Greisen, E. W., et al. 1998, AJ 115, 1693.
- (15) David, L. P., Harnden, F. R., Kearns K. L., et al. 1998, The ROSAT High Resolution Imager (HRI) Calibration Report, U.S. ROSAT Science Data Center (SAO).
- (16) Fossati, G., Maraschi, L., Celotti, A., et al. 1998, MNRAS 299, 433.
- (17) Ghisellini, G., Celotti, A., Fossati, G., et al. 1998, MNRAS 301, 451.
- (18) Giacconi, R., Zirm, A., Wang, J.Xi., et al. 2002, ApJS 139, 369.
- (19) Green, P. J., Silverman, J. D., Cameron, R. A, et al. 2003, ApJS 150, 43.
- (20) Haberl, F. 2003, in High Energy Studies of Supernova Remnants and Neutron Stars, COSPAR Symposium, Houston, Oct. 2002 (astro-ph/0302540).
- (21) Haberl, F. 2004, MmSAI 75, 454.
- (22) Hambly, N. C., MacGallivray, H. T., Read, M. A., et al. 2001, MNRAS 326, 1279.
- (23) Harrison, F. A., Eckart, M. E., Mao, P. H., et al. 2003, ApJ 596, 944.
- (24) Hasinger, G., Burg, R., Giacconi, R., et al., 1993, A&A 275, 1.
- (25) Hasinger, G., Burg, R., Giacconi, R., et al., 1998, A&A 329, 482.
- (26) Israel, G. L., Mereghetti, S., Stella, L. 2002, MmSAI 73, 465.
- (27) Kleinmann, S. G., Lysaght, M. G., Pughe, W. L., et al. 1994, Ap&SS 217, 11.
- (28) Koekemoer, A. M., Alexander, D. M., Bauer, F. E., et al. 2004, ApJ 600, L123.
- (29) Lazzati, D., Campana, S., Rosati, P., et al. 1999, ApJ 524, 423.
- (30) Maccacaro T., Gioia, I. M., Wolter, A., et al. 1988, ApJ 326, 680.
- (31) Mainieri, V., Bergeron, J., Hasinger, G., et al. 2002, A&A 393, 425.
- (32) McLean, B. J., Greene, G. R., Lattanzi, M. R., Pirenne, B. 2000, ADASS 216, 145.
- (33) McLean, B. J., et al. 2005, in preparation.
- (34) McMahon, R. G., White, R. L., Helfand, D. J., Becker, R. H. 2001, ApJS 143, 1.
- (35) Monet, D. G., Levine, S. E., Casian, B., et al. 2003, AJ 125, 984.
- (36) Moretti, A., Campana, S., Lazzati, D., Tagliaferri, G. 2003, ApJ 570, 502.
- (37) Moretti, A., Campana, S., Lazzati, D., Tagliaferri, G. 2003, ApJ 588, 696.
- (38) Moretti, A., Guzzo, L., Campana, S., et al. 2004, A&A 428, 21.
- (39) Moshir, M., Kopan, G., Conrow, T., et al. 1990, BAAS 22, 1325.
- (40) Motch C., Guillout, P., Haberl, F., et al. 1998, A&AS 132, 341.
- (41) Mushotzky, R. F., Cowie, L. L., Barger, A. J., Arnaud, K. A. 2000, Nat 404, 459.
- (42) Musso, C., Mignani, R. P., Becker W., et al. 1998, AdSR 21, 255.
- (43) Norman, C., Hasinger, G., Giacconi, R., et al. 2002 ApJ 571, 218.
- (44) Panzera, M. R., Campana, S., Covino, S., et al. 2003, A&A 399, 351.
- (45) Perlman, E. S., Stocke, J. T., Schachter, J. F., et al. 1996, ApJS 104, 251.
- (46) Pian, E., Vacanti, G., Tagliaferri, G., et al. 1998, ApJ 492, L17.
- (47) Popov, S. B., Colpi, M., Prokhorov, M. E., et al. 2003, A&A 406, 111.
- (48) Popov S.B., Turolla R., Prokhorov, M.E., et al. 2004, Ap&SS submitted (astro-ph/030559).
- (49) Rengelink, R. B., Tang, Y., de Bruyn, A. G., et al. 1997, A&AS 124, 259.
- (50) Romano, P., Campana, S., Mignani, R. P. et al. 2005, A&A submitted.
- (51) Rutledge, R. E., Fox, D. W., Bogosavljevic, M., et al. 2003, ApJ 598, 458.
- (52) Stern, D., Moran, E. C., Coil, A. L., et al. 2002, ApJ 568, 71.
- (53) Szokoly, G. P., Bergeron, J., Hasinger, G., et al. 2003, ApJS 155, 271.
- (54) Treves, A., Turolla, R., Zane, S., et al. 2000, PASP 112, 297.
- (55) Urry, C. M., Padovani, P. 1995, PASP 107, 803.
- (56) Walter, F. M., Lattimer, J. M. 2002, ApJ 576, 145.
- (57) White, R. L., Becker, R. H., Helfand, D. J., et al. 1997, ApJ 475, 479.
- (58) York, D. G., Adelman, J., Anderson, J. E., Jr., et al. 2000, AJ 120, 1579.
- (59) Zickgraf, F.-J., Engels, D., Hagen, H.-J., et al. 2003, A&A 406, 535.