ON THE OBSERVATIONAL STATUS OF ULTRAHIGH ENERGY COSMIC RAYS AND THEIR POSSIBLE ORIGIN IN STARBURST-LIKE GALAXIES
This paper presents a brief review of the current status of ultrahigh energy cosmic ray observations and discusses nearby starburst-like galaxies as their possible origin.
1 Energy Spectrum, Mass Composition, and Distribution of Arrival Directions
In the almost structureless, fast falling with energy, inclusive cosmic ray (CR) spectrum, three kinematic features have drawn considerable attention for a long time. These features, known as the knee, the ankle, and the ultraviolet cutoff, are the only ones in which the spectral index shows a sharper variation as a function of energy, probably signaling some “new physics”. A plethora of astrophysical and exotic explanations have been proposed to address the production mechanism at the high end of the spectrum. In the absence of a single model which is consistent with all data, the origin of these particles remains a mystery. Clues to solve it are not immediately forthcoming from the data, particularly since various experiments report mutually inconsistent results.
In recent years, a somewhat confused picture of the energy spectrum has been emerging. Since 1998, the AGASA Collaboration has consistently reported a continuation of the spectrum beyond the expected Greisen–Zatsepin–Kuzmin (GZK) cutoff, which should arise at about GeV if CR sources are at cosmological distances. In contrast, the most recent results from HiRes describe a spectrum which is consistent with the expected GZK feature. This situation exposes the challenge posed by systematic errors (predominantly arising from uncertainties in hadronic interaction models ) in these types of measurements.
Recent HiRes data have been interpreted as a change in CR composition, from heavy nuclei to protons, at GeV. This is an order of magnitude lower in energy than the previous crossover deduced from the Fly’s Eye data. The end-point of the galactic flux is expected to be dominated by iron, as the large charge of heavy nuclei reduces their Larmor radius (containment scales linearly with ) and facilitates their acceleration to highest energy (again scaling linearly with ). The dominance of nuclei in the high energy region of the Galactic flux carries the implication that any changeover to protons represents the onset of dominance by an extra-galactic component. The inference from this new HiRes data is therefore that the extra-galactic flux is beginning to dominate the Galactic flux already at GeV. Significantly, this is well below GeV, the threshold energy for resonant energy-loss on the cosmic microwave background (CMB), and so samples sources even at large redshift.
The dominance of extra-galactic protons at lower energy can be consistent with recently corroborated structures in the CR spectrum. A second knee, recognized originally in AGASA data is now confirmed by the HiRes-MIA Collaboration. At GeV, the energy spectrum steepens from to . This steepening at the second knee can be explained by energy losses of extra-galactic protons over cosmic distances, due to pair-production on the CMB. The theoretical threshold of the energy-loss feature occurs at GeV, and therefore allows for proton dominance even below this energy. However, the HiRes
coincident with the energy of the second knee (from about 50% protons just below to 80% protons just above), and therefore argues for the beginning of extra-galactic proton dominance at the second knee. Another feature in the CR spectrum is the ankle at GeV where the spectrum flattens from to . This has been commonly identified with the onset of the extra-galactic flux in the past. In the aftermath of the new HiRes data, the ankle can now be interpreted as the minimum in the energy-loss feature. These changes in viewing the onset of the extra-galactic component have spurred a refitting of the CR data down to GeV with appropriate propagation functions and extra-galactic injection spectra. The major result is that the injection spectrum is significantly steeper than the standard predicted by Fermi engines. This appears to contradict the latest HESS measurements of the spectral slope of both, identified and unidentified gamma-ray sources (albeit at lower energies, see M. Lemoine-Gourmard in this proceedings).
At the highest energies, the arrival directions of CRs are expected to begin to reveal their origins. If the CR intensity were isotropic, then one should expect a time-independent flux from each direction in local detector coordinates, i.e., declination and hour angle. In that case, a shower detected with local coordinates could have arrived with equal probability at any other time of a shower detection. For any point of the celestial sphere, the expected shower density can be estimated if the exposure in each direction can be obtained. This implies that celestial anisotropies can be easily discerned by comparing the observed and expected event frequencies at each region. Although there seems to be a remarkable agreement among experiments on predictions about isotropy on large scale structure, this is certainly not the case when considering the two-point correlation function on small angular scale. The AGASA Collaboration reports observations of event clusters which have a chance probability smaller than 1% to arise from a random distribution, whereas the recent analysis reported by the HiRes Collaboration showed that their data are consistent with no clustering among the highest energy events. In our opinion, it is very important to rigorously define the corresponding budget of statistical significance and search criteria prior to studying the data, since defining them a posteriori may inadvertently introduce an undetermined number of “trials” and thus make it impossible to assign the correct statistical significance to the search result. In this direction, with the aim of avoiding accidental bias on the number of trials performed in selecting the angular bin, the original claim of the AGASA Collaboration was re-examined considering only those events observed after the original claim. This study showed that the evidence for clustering in the AGASA data set is weaker than was previously supposed, and is consistent with the hypothesis of isotropically distributed arrival directions.
On a separate track, evidence has been presented for neutral particles (with energy GeV) from the Cygnus spiral arm. Specifically, AGASA has revealed a correlation of the arrival direction of the CRs to the Galactic Plane (GP) at the level. The GP excess, which is roughly 4% of the diffuse flux, is mostly concentrated in the direction of the Cygnus region. Evidence at the 3.2 level for GP enhancement in a similar energy range has also been reported by the Fly’s Eye Collaboration. Interestingly, the full Fly’s Eye data include a directional signal from the Cygnus region which was somewhat lost in an unsuccessful attempt to relate it to –ray emission from Cygnus X-3. The complete isotropy up to about GeV revealed by KASCADE data vitiate direction-preserving photons as primaries. Therefore, the excess from the GP is very suggestive of neutrons as candidate primaries, because the directional signal requires relatively-stable neutral primaries, and time-dilated neutrons can reach the Earth from typical Galactic distances when the neutron energy exceeds GeV. If the Galactic messengers are neutrons, then those with energies below GeV will decay in flight, providing a flux of cosmic antineutrinos above 1 TeV that should be observable at kilometer-scale neutrino telescopes. A measurement of the -flux will supply a strong confirmation of the GP neutron hypothesis.
Another point of agreement among the experiments is the absence of a photon component at the highest energies. This was most recently supported by an analysis of AGASA data: above GeV, less than 50% (65%) of the primary CRs can be photons at 90%CL (95% CL).
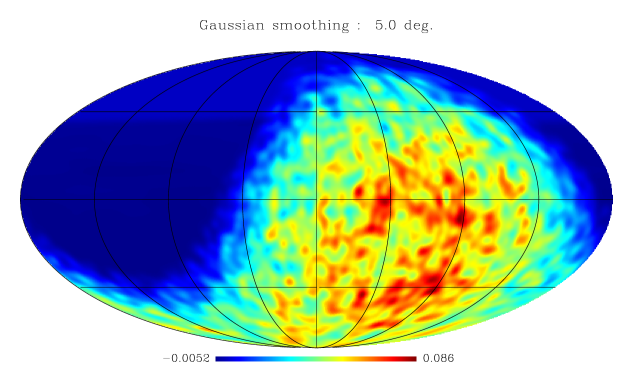
The confusing experimental situation regarding the GZK feature, mass composition, and the small-scale clustering in the distribution of arrival directions should be resolved by the Pierre Auger Observatory (PAO), which will provide not only a data set of unprecedented size, but also the machinery for controlling some of the more problematic systematic uncertainties. The first PAO site is now operational in Malargüe, Argentina, and is in the process of growing to its final size of 3000 km2. At the time of writing, 12 telescopes and about 700 water tanks were operational. The first analyses of data from the PAO are currently underway. Figure 1 shows the arrival directions of all events recorded from January to July 2004. The pixels have a size of 1.8 degrees and the map was smoothed with a Gaussian beam of 5 degrees. On 21 May 2004, one of the larger events recorded by the surface array triggered 34 stations. A preliminary estimate yields an energy GeV and a zenith angle of about First physics results will be made public in the Summer of 2005 at the 29th International Cosmic Ray Conference.
2 Possible Astrophysical Origin
Supernova remnants (SNRs) are thought to be the main source of both CR ions and electrons with energies below the knee (see Ref. for a review, and references therein for details). CRs of low energies are also expected to be accelerated in OB associations, through turbulent motions and collective effects of star winds. When the Larmor radius approaches the accelerator size, it becomes very difficult to magnetically confine the CR to the acceleration region, and thus to continue the accelerating process up to higher energies. If one includes the effect of the characteristic velocity of the magnetic scattering centers, the above argument leads to the general condition, for the maximum energy acquired by a particle travelling in a medium with magnetic field . In the case of one-shot acceleration scenarios, the maximum reachable energy turns out to have a quite similar expression to the shock acceleration case. In what follows, we focus on only one possible astrophysical origin of ultrahigh energy CRs, and refer the reader to for thorough discussion on other candidates.
2.1 The two nearest starbursts
Starbursts are galaxies undergoing a large-scale star formation episode. They feature strong infrared emission originating in the high levels of interstellar extinction, strong HII-region-type emission-line spectrum (due to a large number of O and B-type stars), and considerable radio emission produced by recent SNRs. Typically, starburst regions are located close to the galactic center, in the central kiloparsec. This region alone can be orders of magnitude brighter than the center of normal spiral galaxies. From such an active region, a galactic-scale superwind is driven by the collective effect of supernovae and particular massive star winds. The enhanced supernova explosion rate creates a cavity of hot gas ( K) whose cooling time is much greater than the expansion time scale. Since the wind is sufficiently powerful, it can blow out the interstellar medium of the galaxy, preventing it from remaining trapped as a hot bubble. As the cavity expands, a strong shock front is formed on the contact surface with the cool interstellar medium. The shock velocity can reach several thousands of kilometers per second and ions like iron nuclei can be efficiently accelerated in this scenario, up to ultrahigh energies, by Fermi’s mechanism. If the super-GZK particles are heavy nuclei from outside our Galaxy, then the nearby ( Mpc ) starburst galaxies M82 () and NGC 253 () are prime candidates for their origin.
M82 is probably the best studied starburst galaxy, located at 3.2 Mpc. The total star formation rate in the central parts is at least M⊙ yr The far infrared luminosity of the inner region within 300 pc of the nucleus is L⊙. There are M⊙ of ionized gas and M⊙ of neutral gas in the IR source. The total dynamical mass in this region is M⊙. The main observational features of the starburst can be modelled with a Salpeter IMF extending from 0.1 to 100 M⊙. The age of the starburst is estimated in yr. Around M⊙ (i.e. % of the dynamical mass) is in the form of new stars in the burst. The central region, then, can be packed with large numbers of early-type stars. More than 60 individual compact radio sources have been detected within the central 200 pc of NGC 253, half of which are SNRs. The supernova rate is estimated to be as high as yr-1, comparable to the massive star formation rate, M⊙ yr-1. Assuming that the star formation rate has been continuous in the central region for the last 109 yrs, and a Salpeter IMF for 0.08-100 , the bolometric luminosity of NGC 253 is consistent with 1.5 of young stars. Based on this evidence, it appears likely that there are at least tens of millions of young stars in the central region of the starburst. These stars can contribute to the -ray luminosity at high energies. A TeV detection was reported by CANGAROO , but has been yet unconfirmed by other experiments. A multiwavelength model of NGC 253, predicting less gamma-ray flux than that detected by CANGAROO (thus, predicting that HESS will not detect the starburst) has been presented in Ref.
2.2 Acceleration processes in starbursts
Due to the nature of the central region, and the presence of the superwind, the escape of the iron nuclei from the central region of the galaxy is dominated by convection.aaaThe relative importance of convection and diffusion in the escape of the CRs from a region of disk scale height is given by the dimensionless parameter, where is the convection velocity and is the CR diffusion coefficient inside the starburst. When , the CR outflow is difussion dominated, whereas when it is convection dominated. For the central region of NGC 253 a convection velocity of the order of the expanding SNR shells 10000 km s-1, a scale height pc, and a reasonable value for the diffusion coefficient cm2 s-1, lead to . Thus, convection dominates the escape of the particles. The residence time of the iron nuclei in the starburst results s. Nuclei can then escape through the disk in opposite directions along the symmetry axis of the system, being the total path travelled substantially shorter than the mean free path. Once the nuclei escape from the central region of the galaxy they are injected into the galactic-scale wind and experience further acceleration at its terminal shock. CR acceleration at superwind shocks was first proposed in in the context of our own Galaxy. The scale length of this second shock is of the order of several tens of kpc, so it can be considered as locally planar for calculations. The shock velocity can be estimated from the empirically determined superwind kinetic energy flux and the mass flux generated by the starburst through: The shock radius can be approximated by , where is the starburst age. Since the age is about a few tens of million years, the maximum energy attainable in this configuration is constrained by the limited acceleration time arising from the finite shock’s lifetime. The photon field energy density drops to values of the order of the CMB, and consequently, iron nuclei are safe from photodissociation while energy increases to GeV.
To estimate the maximum energy that can be reached by the nuclei, consider the superwind terminal shock propagating in a homogeneous medium with an average magnetic field . If we work in the frame where the shock is at rest, the upstream flow velocity will be () and the downstream velocity, . The magnetic field turbulence is assumed to lead to isotropization and consequent diffusion of energetic particles which then propagate according to the standard transport theory. The acceleration time scale is then: where is the upstream diffusion coefficient which can be written in terms of perpendicular and parallel components to the magnetic field, and the angle between the (upstream) magnetic field and the direction of the shock propagation, . Since strong turbulence is expected from the shock we can take the Bohm limit for the upstream diffusion coefficient parallel to the field, i.e. where is the strength of the pre-shock magnetic field and is the energy of the -ion. For the component we shall assume, following Biermann, that the mean free path perpendicular to the magnetic field is independent of the energy and has the scale of the thickness of the shocked layer (). Then, or, in the strong shock limit, The upstream time scale is , Thus, using and transforming to the observer’s frame one obtains
The predicted kinetic energy and mass fluxes of the starburst of NGC 253 derived from the measured IR luminosity are erg s-1 and 1.2 M⊙ yr-1, respectively. The age is in the range to yr (also valid for M82). Finally, the radio and -ray emission from NGC 253 are well matched by models with G, although it might be at least a factor of 4 bigger in the innermost region of the nucleus. With these figures, assuming a conservative age Myr, one obtains a maximum energy for iron nuclei of
2.3 Testing the starburst hypothesis
For an extragalactic, smooth, magnetic field of nG, diffusive propagation of nuclei below eV evolves to nearly complete isotropy in the CR arrival directions. Thus, we could use the rates at which starbursts inject mass, metals and energy into superwinds to get an estimate of the CR-injection spectra. Using equal power per decade over the interval – we obtain a source CR-luminosity where is the efficiency of ultrahigh energy CR production by the superwind kinetic energy flux. With this in mind, the energy-weighted, approximately isotropic nucleus flux at eV is given by where . To estimate the diffusion coefficient we used , , and an average . We fix after comparing the above equations to the observed CR-flux. Note that the contribution of and to critically depends on the age of the starburst. The relation “starburst-age/superwind-efficiency” derived from Eq. (2.3), leads to , if both M82 and NGC 253 were active for Myr. The power requirements may be reduced assuming contributions from M82 “B”.
In the non-diffusive regime (i.e., ), the accumulated deflection angle from the direction of the source in the extragalactic -field is roughly . The nuclei suffer additional deflection in the Galactic magnetic field. In particular, if the Galactic field is of the ASS type, the arrival direction of the 4 highest energy CRs can be traced backwards to one of the starbursts. Figure 2 shows the extent to which the observed arrival directions of the highest energy CRs deviate from their incoming directions at the Galactic halo because of bending in the magnetic field. It is seen that trajectories for CR nuclei with can be further traced back to one of the starbursts, within the uncertainty of the extragalactic deviation.
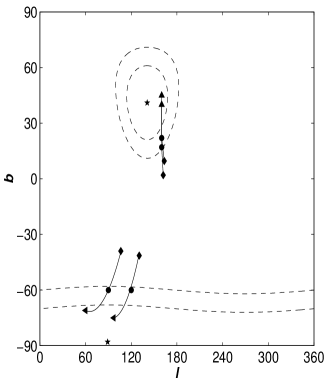
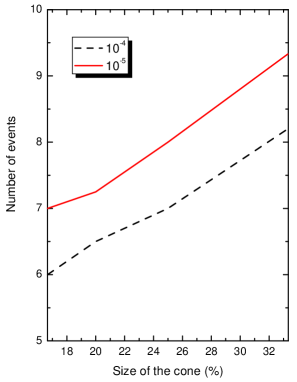
We now attempt to assess to what extent these correlations are consistent with chance coincidence. The deflections in the extragalactic and Galactic fields (regular and random components) may be assumed to add in quadrature, so that the angular sizes of the two sources are initially taken as cones with opening half-angles between 40∘ and 60∘, which for the purpose of our numerical estimate we approximate to 50∘. The global structure of the field will substantially diminishing the effective solid angle. The combined deflections in the and coordinates concentrate the effective angular size of the source to a considerably smaller solid angle. As a conservative estimate, we retain 25% of this cone as the effective source size. By randomly generating 4 CR positions in the portion of the sky accessible to the existing experiments (declination range ), an expected number of random coincidences can be obtained. The term “coincidence” is herein used to label a synthetic CR whose position in the sky lies within an effective solid angle of either starburst. is characterized by a cone with opening half-angle reduced from to to account for the 75% reduction in effective source size due to the magnetic biasing discussed above. For the 4 observed events, with zero background, the Poisson signal mean 99% confidence interval is . Thus our observed mean for random events, , falls at the lower edge of this interval, yielding a 1% probability for a chance occurrence. Assuming an extrapolation of AGASA flux () up to eV, the event rate at PAO, with an aperture km2 sr for showers with incident zenith angle less than , is given by where eV and eV. Considering a 5-year sample of 25 events and that for this energy range the aperture of PAO is mostly receptive to CRs from NGC253, we allow for different possibilities of the effective reduction of the cone size because of the Galactic magnetic field biasing previously discussed. In Fig. 2 we plot contours of constant probabilities () in the two-dimensional parameter space of the size of the cone (as a fraction of the full circle) and the minimum number of events originating within the resulting effective solid angle. The model predicts that after 5 years of operation, even if 7 are observed, it would rule out a random fluctuation at the level.
Other galaxies, presenting a more extreme starburst behavior, like
those luminous and ultra-luminous infrared galaxies which are also
expected to be detected by space and ground-based gamma-ray
experiments, may
additionally contribute to the ultrahigh energy CR flux.
Acknowledgments
The work of DFT was performed under the auspices of the U.S. Department of Energy (NNSA) by University of California’s LLNL under contract No. W-7405-Eng-48. He acknowledges the European Union for the grant that allowed his participation in this meeting, and the organizers for hospitality. The work of LAA has been partially supported by the US National Science Foundation (NSF) under grant No. PHY-0140407.
References
- [1] D. F. Torres and L. A. Anchordoqui, Rept. Prog. Phys. 67, 1663 (2004).
- [2] L. Anchordoqui, T. Paul, S. Reucroft and J. Swain, Int. J. Mod. Phys. A 18, 2229 (2003).
- [3] M. Takeda et al., Phys. Rev. Lett. 81, 1163 (1998); Astropart. Phys. 19, 447 (2003).
- [4] K. Greisen, Phys. Rev. Lett. 16, 748 (1966); G. T. Zatsepin and V. A. Kuzmin, JETP Lett. 4, 78 (1966) [Pisma Zh. Eksp. Teor. Fiz. 4, 114 (1966)].
- [5] R. U. Abbasi et al. [HiRes Collaboration], Phys. Rev. Lett. 92, 151101 (2004).
- [6] L. A. Anchordoqui, M. T. Dova, L. N. Epele and S. J. Sciutto, Phys. Rev. D 59, 094003 (1999).
- [7] D. R. Bergman [HiRes Collaboration], astro-ph/0407244.
- [8] D. J. Bird et al. [Fly’s Eye Collaboration], Phys. Rev. Lett. 71 3401 (1993).
- [9] M. Nagano et al., J. Phys. G 18, 423 (1992).
- [10] T. Abu-Zayyad et al., [HiRes-MIA Collaboration], Astrophys. J. 557, 686 (2001).
- [11] V. Berezinsky, A. Z. Gazizov and S. I. Grigorieva, Phys. Lett. B 612, 147 (2005).
- [12] M. Ahlers, L. A. Anchordoqui, H. Goldberg, F. Halzen, A. Ringwald and T. J. Weiler, arXiv:astro-ph/0503229.
- [13] L. A. Anchordoqui, C. Hojvat, T. P. McCauley, T. C. Paul, S. Reucroft, J. D. Swain and A. Widom, Phys. Rev. D 68, 083004 (2003); R. Abbasi et al. [HiRes Collaboration], Astropart. Phys. 21, 111 (2004).
- [14] N. Hayashida et al. [AGASA Collaboration], Phys. Rev. Lett. 77, 1000 (1996); arXiv:astro-ph/0008102.
- [15] R. U. Abbasi et al. [HiRes Collaboration], arXiv:astro-ph/0404137; arXiv:astro-ph/0404366; arXiv:astro-ph/0412617.
- [16] C. B. Finley and S. Westerhoff, Astropart. Phys. 21, 359 (2004).
- [17] N. Hayashida et al. [AGASA Collaboration], Astropart. Phys. 10, 303 (1999).
- [18] M. Teshima et al., Proc. 27th ICRC, (Copernicus Gesellschaft, 2001) p.341.
- [19] D. J. Bird et al. [Fly’s Eye Collaboration], Astrophys. J. 511, 739 (1999).
- [20] T. Antoni et al. [KASCADE Collaboration], arXiv:astro-ph/0312375.
- [21] G. L. Cassiday et al., Phys. Rev. Lett. 62, 383 (1989); M. Teshima et al., Phys. Rev. Lett. 64, 1628 (1990).
- [22] L. A. Anchordoqui, H. Goldberg, F. Halzen and T. J. Weiler, Phys. Lett. B 593, 42 (2004).
- [23] M. Ave, J. Hinton, R. Vazquez, A. Watson and E. Zas, Phys. Rev. Lett. 85, 2244 (2000).
- [24] M. Risse et al., arXiv:astro-ph/0502418.
- [25] J. Abraham et al. [Auger Collaboration], Nucl. Instrum. Meth. A 523, 50 (2004).
- [26] L. A. Anchordoqui [Auger Collaboration], arXiv:astro-ph/0409470.
- [27] D. F. Torres, G. E. Romero, T. M. Dame, J. A. Combi, and Y. M. Butt, Phys. Rept. 382, 303 (2003).
- [28] L. A. Anchordoqui, G. E. Romero and J. A. Combi, Phys. Rev. D 60, 103001 (1999).
- [29] T. M. Heckman, L. Armus, and G. K. Miley, Astrophys. J. Suppl. 74, 833 (1990).
- [30] R. W. O’connell and J. J. Mangano, Astrophys. J. 221, 62 (1978).
- [31] G. H. Rieke, et al., Astrophys. J. 238, 24 (1980).
- [32] S. Satyapal, et al. Astrophys. J. 483, 148 (1997).
- [33] J. S. Ulvestad and R. R. J. Antonucci, Astrophys. J. 488, 621 (1997).
- [34] A. M. Watson, et al. Astron. J. 112, 534 (1996).
- [35] G. E. Romero and D. F. Torres, Astrophys. J. 586, L33 (2003).
- [36] D. F. Torres, E. Domingo-Santamaria and G. E. Romero, Astrophys. J. 601, L75 (2004).
- [37] C. Itoh et al. [CANGAROO-II Collaboration], Astron. Astrophys. 402, 443 (2003).
- [38] E. Domingo-Santamaria and D. F. Torres (2005), in preparation.
- [39] A. J. Owens, and R. J. Jokipii, Astrophys. J. 215, 677 (1977).
- [40] J. R. Jokipii and G. R. Morfill, Astrophys. J. 290, L1 (1985).
- [41] J. R. Jokipii, Astrophys. J. 313, 842 (1987).
- [42] L. O’C. Drury, Rep. Prog. Phys. 46, 973 (1983).
- [43] P. L. Biermann, Astron. Astrophy. 271, 649 (1993).
- [44] T. A. D. Paglione, A. P. Marscher, J. M. Jackson, and D. L. Bertsch, Astrophys. J. 460, 295 (1996).
- [45] L. Anchordoqui, H. Goldberg, S. Reucroft and J. Swain, Phys. Rev. D 64, 123004 (2001).
- [46] G. Bertone, C. Isola, M. Lemoine and G. Sigl, arXiv:astro-ph/0209192.
- [47] L. A. Anchordoqui, H. Goldberg and D. F. Torres, Phys. Rev. D 67, 123006 (2003).
- [48] D. F. Torres, O. Reimer, E. Domingo-Santamaria and S. W. Digel, Astrophys. J. 607, L99 (2004) D. F. Torres, Astrophys. J. 617, 966 (2004); A. N. Cillis, D. F. Torres and O. Reimer, Astrophys. J. 621, 139 (2005).