Discovery of a Galaxy Cluster
in the Foreground of the
Wide-Separation Quasar Pair UM 425
Abstract
We report the discovery of a cluster of galaxies in the field of UM425, a pair of quasars separated by 6.5″. Based on this finding, we revisit the long-standing question of whether this quasar pair is a binary quasar or a wide-separation lens. Previous work has shown that both quasars are at and show broad absorption lines. No evidence for a lensing galaxy has been found between the quasars, but there were two hints of a foreground cluster: diffuse X-ray emission observed with Chandra, and an excess of faint galaxies observed with the Hubble Space Telescope. Here we show, via VLT spectroscopy, that there is a spike in the redshift histogram of galaxies at . We estimate the chance of finding a random velocity structure of such significance to be about 5%, and thereby interpret the diffuse X-ray emission as originating from , rather than the quasar redshift. The mass of the cluster, as estimated from either the velocity dispersion of the galaxies or the X-ray luminosity of the diffuse emission, would be consistent with the theoretical mass required for gravitational lensing. The positional offset between the X-ray centroid and the expected location of the mass centroid is 40 kpc, which is not too different from offsets observed in lower redshift clusters. However, UM425 would be an unusual gravitational lens, by virtue of the absence of a bright primary lensing galaxy. Unless the mass-to-light ratio of the galaxy is at least 80 times larger than usual, the lensing hypothesis requires that the galaxy group or cluster plays a uniquely important role in producing the observed deflections.
Based on observations performed with the Very Large Telescope at the European Southern Observatory, Paranal, Chile.
Subject headings:
gravitational lensing – quasars: individual (UM 425) – X-rays: galaxies: clusters1. Introduction
The probability that a distant quasar is gravitationally lensed by an intervening potential is sensitive to the volume of the universe, so lensing statistics place interesting constraints on (Turner 1990, but see also Keeton 2002 and references therein). Wide separation lensed QSOs () probe more massive deflectors like groups or clusters of galaxies. The properties of these dark matter-dominated halos provide strong tests for the current standard theory of structure formation involving cold dark matter (CDM). Wide-separation lensed QSOs can measure the fractional matter density and the rms linear density fluctuation in spheres of 8 Mpc (Lopes & Miller, 2004). But the detection of wide lensed QSOs has not been easy. Only 3 confirmed examples exist with : Q0957+561 (6.3″ at =1.41; Walsh et a. 1979), RX J0921+4529 (6.9″ at =1.65; Muñoz et al. 2001), and the record-setting quadruple-image quasar SDSS J1004+4112 (14.6″; Inada et al. 2003; Oguri et al. 2004).
Wide quasar pairs at similar redshifts are under intense study as possible wide lenses and have been hunted in large surveys like the 2dF (Miller et al., 2004) and SDSS (Inada et al. 2003; Fukugita et al. 2004). The lensed quasar candidates are selected to have very similar redshifts, colors and optical/UV spectra. If no obvious lensing galaxy is seen between the quasar constituents, deciding whether such pairs are lensed can be tricky. Such a case was probed recently by Faure et al. (2003) for the 5″ pair LBQS 1429-0053. Evidence for lensing may include (1) photometric monitoring and identification of a time delay between the quasar images, (2) shear in the images of the quasar host galaxy, (3) a weak lensing signal (correlated ellipticity) in galaxies in the field, (4) X-ray diffuse emission and/or (5) an overdensity of galaxies in the field at a redshift appropriate to a candidate lensing cluster.
Even if these wide pairs are not found to be lensed, they can be very illuminating in terms of the study of AGN physics, the way that twin studies are in medicine. For instance, to warrant detailed study of such quasars as candidate lensed quasars, the pair must have nearly identical spectra, ages and environment, yet may differ greatly in luminosity. In this paper, we study the intriguing pair UM 425.
2. UM 425
UM 425 is a pair of quasars at redshift discovered by Meylan & Djorgovski (1989) in a search for lenses among anomalously bright (presumably magnified) high redshift quasars. Separated by 6.5″, the 2 brightest images have nearly identical optical/UV spectra and close velocities: km s from Meylan & Djorgovski (1989); and km s from Michalitsianos, Falco, Munoz, & Kazanas (1997). Both and show strong broad absorption lines (BALs), which occur in a fraction (10 – 20%) of optically-selected QSOs (Hewett & Foltz, 2003; Reichard et al., 2003b). Colors of the two images are indistinguishable from UV through near-IR.
While UM425 has long been a strong wide lens candidate, ground-based optical imaging to reveals no obvious deflector, arcs, or arclets (Courbin et al., 1995), whereas a massive lens should be present to cause the large separation.
We proposed deep (110 ksec) Chandra observations of the pair, in part because UM425A (perhaps due to lensing) is one of the brightest known BALQSOs. X-ray studies of BALQSOs address the debate on whether the BAL phenomenon is one of orientation, or perhaps accretion rate or some other intrinsic physical property (e.g., Becker et al. 2000; Green et al. 2001; Gallagher et al. 2002a). Our analysis of the UM 425 observation (ObsId 3013 obtained on 2001-Dec-13; see Aldcroft & Green 2003, AG03 hereafter) showed that the 5000 count spectrum of UM425A (the brighter component) is well-fit with a power law (photon spectral index ) partially covered by a hydrogen column of cm-2. This slope is typical for quasars, and the heavy intrinsic absorption is expected for a BALQSO (Green et al., 2001). Assuming the same for the much fainter (30 count) spectrum of UM425B yields an obscuring column 5 times larger. This X-ray spectral difference (and the difference in between the two images) could be accounted for in a lens scenario by differing (or varying) absorbing columns and/or dust-to-gas ratios along the two sightlines. Indeed, analysis of the Ly emission line region in archival HST STIS spectra of the two components shows - despite their widely disparate - that both the emission line and absorption profiles differ (AG03). Spectral differences of this magnitude have been noted previously in bona fide lensed quasars (HE 2149-2745 Burud et al. 2002a, SBS 1520+530 - Burud et al. 2002b).
A striking discovery in our Chandra image was significant diffuse extended emission in the direction of UM425. Such emission arises from the hot gas bound in massive galaxy clusters or groups. The initial analysis by AG03 suggested that the cluster (and thereby mass) was probably too low on its own to explain the wide separation of UM425 in a lens scenario. A similar analysis of the X-ray data, informed by a draft of AG03, was published in a Letter by Mathur & Williams (2003). They strongly advocated that the cluster was at the quasar redshift, while acknowledging that further data were necessary.
AG03 also analyzed archival HST WFPC2 and NICMOS images of the field, finding no evidence for a luminous lensing galaxy. However, a 3- excess of faint galaxies in the UM425 field was seen, with plausible magnitudes for a galaxy group at a redshift () well-positioned to lens a =1.465 quasar. The X-ray and optical evidence for a plausible lensing cluster, as well as the debate over the cluster’s redshift, is what motivated the VLT observations described here. For luminosity and distance calculations, we adopt a km s-1 Mpc-1, , and cosmology throughout.
3. VLT Observations
After pre-imaging at the ESO Very Large Telescope (VLT), we obtained optical spectra of galaxies in the UM 425 field in multi-object spectroscopy (MOS) mode.
3.1. Imaging
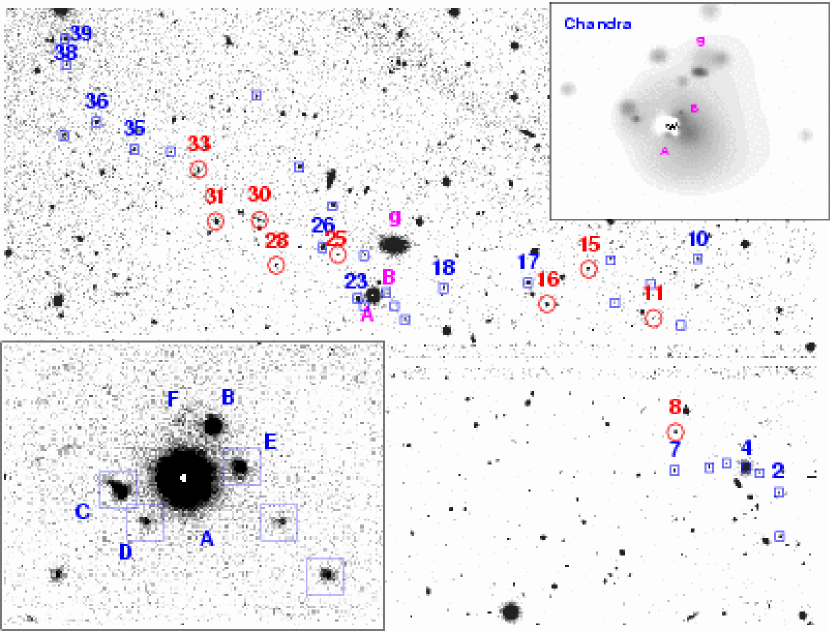
We obtained pre-imaging data in Bessel , , and filters at the VLT across a 6.7′ field at a scale of 0.25/pixel amid seeing of 0.8″ on UT 13 March 2004. Calibration images were also obtained. We used SExtractor software (Bertin, E. & Arnouts, 1996) to derive intrumental photometry, using objects detected in the -band (which had the largest number of detected objects) as a reference catalog in ASSOC mode. We use MAG_AUTO for band total magnitudes, and for colors we use the difference between aperture magnitudes in apertures of diameter FWHM, or about 2.4″ (20 kpc at =0.77; see § 3.2). Our images are complete to =24.0, =23.5, and =23.5 (based on a conservative limit 1 mag brighter than the turnover in the galaxy counts histogram). The wide-field band image is shown in Figure 1, along with small-field insets showing the immediate vicinity of UM425 in optical and X-ray bands.
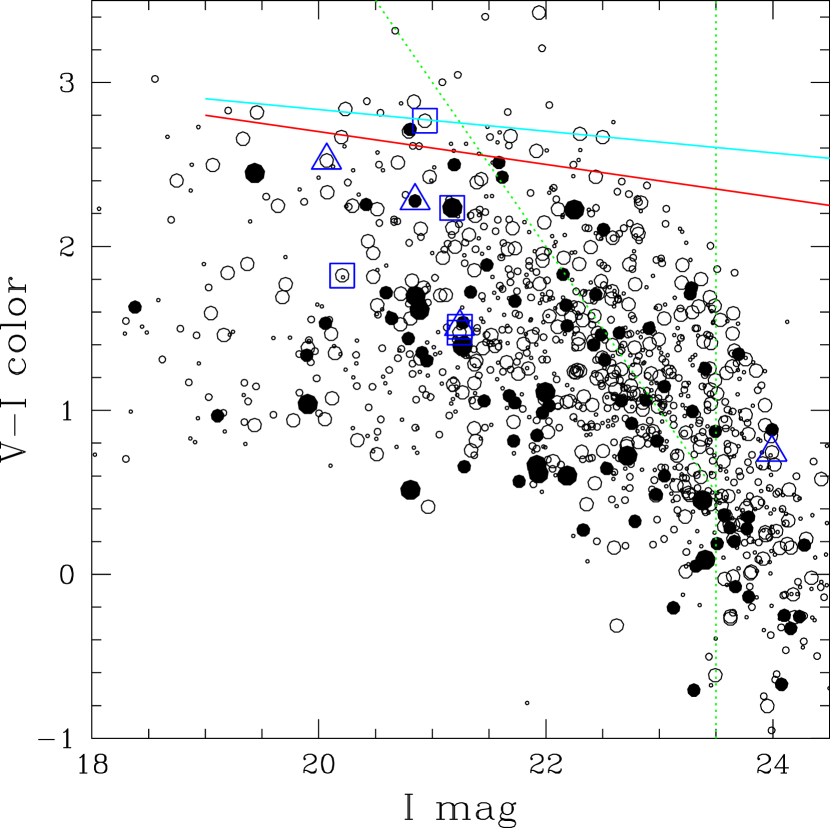
For a cluster at =0.77 (see § 3.2), approximates a restframe color, spanning the 4000Å Balmer break. spans an even larger (bluer) range, so is more sensitive to any recent or on-going star formation. Figure 2 shows a vs. color-magnitude diagram. Several recent papers (e.g., De Lucia, G. 2004) indicate that a single-burst model provides a reasonable fit to the red sequence of high-redshift clusters. We assume a formation redshift of 3, so that galaxies at =0.77 are 5 Gyr old, and –21 (e.g., de Lapparent 2003). Using the HyperZ photometric redshift code of Bolzonella, Miralles, & Pello (2000), the expected colors of bright elliptical galaxies at =0.77 are in the range –2.5 – 2.9, with .
No strong red sequence is visible among objects within 1′ of UM425. But our CMD probes only brighter galaxies: corresponds to an observed-frame -band magnitude of about 22.2 at =0.77. Many of the cluster elliptical galaxies composing the sequence are expected to lie fainter or redder than our current completeness limits (shown as dashed lines in Figure 2). In addition, the cluster may have a high fraction of star-forming galaxies, as borne out by our spectroscopy (§ 3.2). The colors of star-forming galaxies, strongly affected by the strength of the break and [O II] emission lines, have much larger scatter. Blue galaxies like these are candidate progenitors of nearby present-day faint red sequence ellipticals (Kodama, T. & Bower, R.G. 2001; De Propris et al. 2003). However, even when galaxies with spectroscopically-identified emission lines are excluded, substantial (0.3mag rms) scatter is typically seen in cluster red sequence colors.
Deeper imaging in these filters could better determine the number of galaxies that are likely to be cluster members, and thereby estimate an extent and optical centroid for comparison to the X-ray centroid. If the diffuse X-ray emission originates in a cluster at the redshift of UM425, the 4000Å break is close to 1m, so that band or near-IR imaging is required to estimate cluster membership with reasonable accuracy. Space-based imaging would allow for a variety of other important measurements (see § 8 below).
3.2. Spectroscopy
We obtained spectra of the high-redshift galaxy candidates on the nights of 10, 12, and 20 May 2004, using the Focal Reducer Spectrograph (FORS2) at the ESO VLT (U4), using the grism GRIS_150I with filter OG590 and a slit width of 6 pixels (0.76). We effectively covered the spectral range from Å to 1m with a spectral scale of 6.86Å/pixel, yielding a spectral resolution of FWHM19Å. We accumulated 3.26h of exposure time with an effective seeing of about 0.75. Standard reduction (bias subtraction, correction for flat field variation, cosmic ray elimination) for both the photometry and spectroscopy data, as well as rebinning to the observed wavelength for the spectra, was performed independently using both MIDAS (SL) and IRAF routines (LI). The spectral extraction pipeline we used runs under MIDAS, and simultaneously fits the spatial profiles (with a Gaussian PSF) and the sky lines (using a Levenberg-Marquardt algorithm). Pixels are variance-weighted in the fit. Cosmic rays are assigned with infinite variances, so they do not contribute.
Radial velocities were also measured independently. Results are identical to within the errors, which are themselves conservative (typically 5 the difference in redshift estimates). In Table 1, we present the average of the two measurements, and the resulting random errors. We also tabulate (observed frame) emission line equivalent widths for [O II]
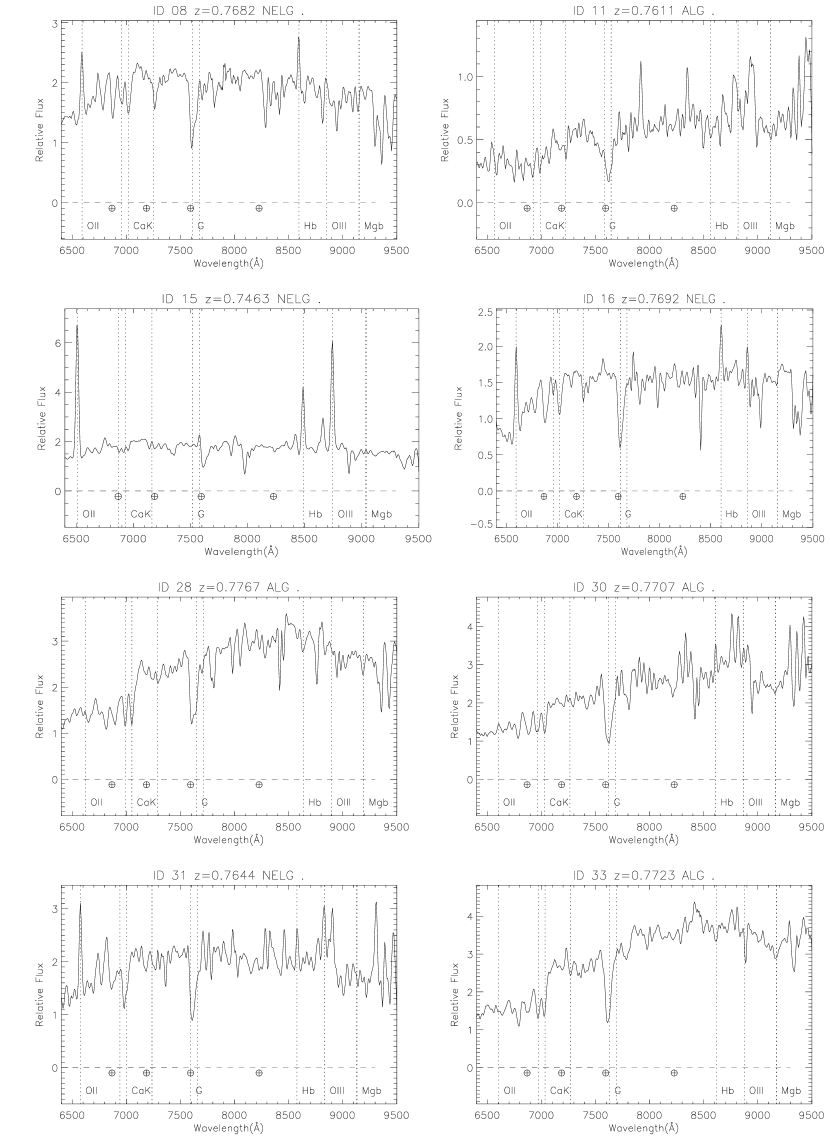
The redshift histogram in Figure 3 reveals a strong cluster of redshifts near 0.75. We analyze all 9 velocities near the cluster redshift (those with 0.60.85), using the robust biweight estimator of Beers et al. (1990), which includes the velocity errors and yields a redshift (similar to a median) of 0.76860.003. The final flux-calibrated spectra for cluster galaxies are displayed in Figure 4. Half the spectra show strong emission line signatures of star formation. The widest spectroscopically confirmed cluster galaxies in the field (#8 and 33 in Figure 4 and Table 1) span 2 Mpc projected separation (at the cosmological angular scale of 7.4 kpc/arcsec).
Redshift structures in a given patch of sky trace large scale structures in the Universe, which may be found in any direction. What are the chances that a redshift spike such as we find is unrelated to the diffuse X-ray cluster emission? We cannot directly answer this question, but we can estimate the chances of randomly finding a redshift spike like this in a similar-sized region on the sky.
Models of large scale structure, including galaxy luminosity functions and galaxy evolution in the field, in filaments, and in clusters, might allow simulations of a patch of sky and hence a test for spikes. But observations of significant samples of galaxies at these faint magnitudes are both rare and recent, so that such models are as yet poorly constrained. Instead, we turn directly to the best extant deep wide-field spectroscopic data, in particular the Great Observatories Origins Deep Survey (GOODS)-North field. There are 1813 reliable spectroscopic galaxy redshifts tabulated by Wirth et al. (2004) and Cowie et al. (2004) in the GOODS-North field, which spans about 17′10′. To test whether a redshift spike as strong as the one we find is expected in a random sky direction, we restrict their full catalog to objects with GOODS magnitude 23, resulting in a bright subcatalog of 630 redshifts across the GOODS spectroscopic field. Due to observing constraints, the VLT spectra we obtained were constrained to a thin strip on the sky of approximately 7.5′0.6′(Figure 1). We sampled the bright subcatalog in strips of this size, scanning across the full GOODS field with a range of step sizes and initial strip positions. At each position, we tested whether at least 21 redshifts existed in a thin strip. If fewer than 21 were found, we moved another step. If 21 or more were found, we randomly chose 21 within each thin strip. We accumulated a histogram of redshifts within each thin strip, using the same bin width as in our UM425 histogram (=0.05) and then we counted the number of redshift spikes of 9 or more galaxies. For 17,000 such thin sample trials, we found a redshift spike of 9 or more galaxies in just 3.8% of samples. Since the median mag of our VLT redshifts is about 21, we tried using a variety of magnitude-limited subsamples from the GOODS-North sample, and found that an average fraction of 6.6% of 21-member thin subsamples had spikes of 9 or larger. Since we only retained thin subsamples with 21 or more redshifts, we have biased the subsamples toward significant structures already, so we consider either of our quoted fractions to be conservative. We therefore consider it very unlikely that this redshift spike is a coincidence unrelated to the diffuse X-ray cluster emission.
4. Cluster Properties
4.1. Velocity Dispersion
We calculate the galaxy radial velocities as
and measure their RMS dispersion about the mean. Assuming a normal distribution yields km s for the 9 galaxies within =0.05 of the mean. A more conservative measure might remove the farthest velocity outlier as a potential interloper, #15 at =0.7464, which yields a mean (and also median) optical cluster redshift =0.7688 and km s. The most robust estimates of scale (similar to RMS dispersion in the Gaussian case) for velocity samples of this size are from the gapper or biweight methods (Beers et al., 1990), which yield 695300 and 552280 km s, respectively. With more redshifts, these various estimates would likely converge.
For lensed images, the image separation depends only on of the lens and the ratio of the comoving distances111We calculate angular size distances in our cosmological model using the ANGSIZ code of Kayser, Helbig, & Schramm (1997). between the lens and the source, , and the observer and the source, . In the SIS model for the lensing mass, and using =0.77, the observed image separation of 6.5 implies a cluster velocity dispersion of or more. The same model produces a “minimum flux redshift” of 0.6 (AG03), only 10–15% different (in the relevant angular diameter distance) from the observed mean redshift. We thus have strong evidence for an optical cluster of sufficient mass to lens the quasar pair. But are the optical and X-ray characteristics compatible?
4.2. Diffuse X-ray Analysis
Because of the bright X-ray point source coincident with UM425A, it is difficult to estimate the number of diffuse X-ray photons detected in the vicinity. After subtracting the point source as well as possible, AG03 estimated a lower limit of 5112 counts in the cluster, from a region where the excess above background was clearly visible. Now with corroborating optical evidence for a cluster, we have re-analyzed these data more thoroughly, to better characterize the cluster X-ray emission. The somewhat complicated procedure we describe below reflects the difficulty of studying the X-ray counts from the diffuse emission in close proximity to the quasar counts.
First, in a 0.5-2 keV image, we fit a PSF model to UM 425A yielding an estimate of 3448 total counts. From the full image, we then exclude a 7 pixel (3.44″)222Based on PSF modeling we expect about 200 counts from UM 425A outside a 7 pixel radius. region centered on UM 425A, and fill the hole at the background level333Using a source-free annulus from 70–90″ radius, we determined the 0.5-2 keV background level to be 0.0195 counts/pixel (0.047 counts/arcsec2). using the dmfilth tool in CIAO3.1. We smooth the resulting image using csmooth (adapted for CIAO from Ebeling, White, & Rangarajan 2005) which adapts the smoothing scale to result in 2.5 significance above background. The task also generates an image of the smoothing scale (kernel size map). Since the PSF depends on energy, we then use our best-fit quasar spectral model (AG03) as input to ChaRT444http://asc.harvard.edu/chart/ and MARX555http://space.mit.edu/CXC/MARX/ to create a simulated PSF at the position of UM 425A. We excise from this simulated quasar image the same 7 pixel circular region as in the cluster image, and smooth with the original smoothing scale map. Now we have an quasar image that should be an exact model of the effect of UM 425A in the excised and smoothed cluster image. We thus subtract the two images. Finally, we refill the excised hole in the cluster image with a constant level determined from the same size region reflected across the axis of cluster symmetry in that same image. The regions of UM 425B and the nearby galaxy (labeled “g” in Figure 1) were also excised and refilled at the background level.666Due to the small size of these regions and low surface brightness of the cluster, filling with counts from the cluster region rather than background makes no difference (2counts).
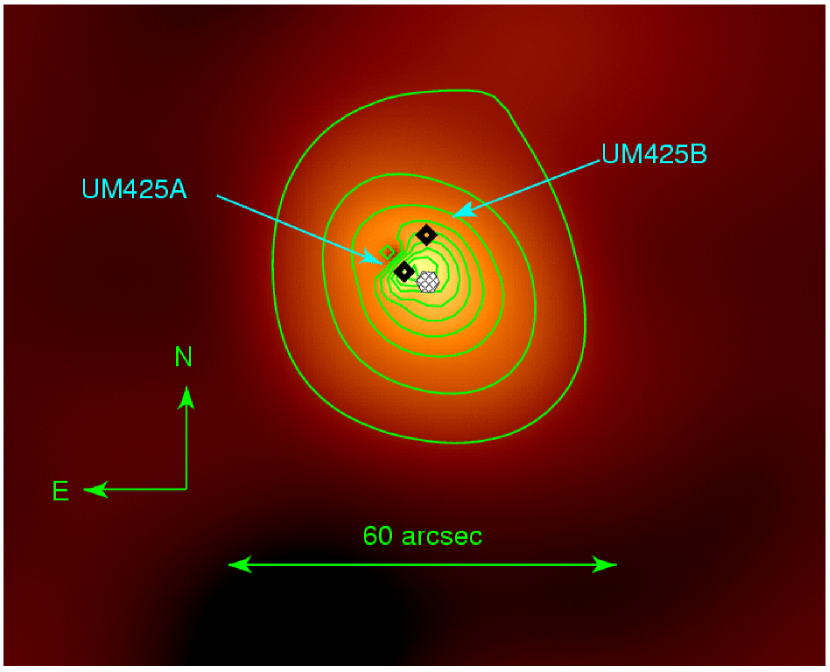
From the smoothed cluster image shown in Figure 5 it is clear that the peak of diffuse emission does not coincide with the center of the outer contours (which are noticeably elliptical). This indicates that the X-ray emitting gas in the cluster is not fully relaxed, and may be composite. We determine that the cluster center, based on the outer contours, is at (J2000). The emission peak is approximately 2.6″ to the northwest of that position. Approximate major and minor axes for the cluster X-ray emission are ()=17.7″,14.3″ at position angle =40 deg (counter-clockwise from North). A variety of methods (different combinations of PSF subtraction, smoothing, and the use of ellipse centroids or flux peaks) all yield positions within about 4″.
To determine the total flux in the cluster we applied essentially the same steps described for preparing the smoothed image, but used raw image data with no smoothing. This gives our best estimate of the true underlying cluster emission with all contribution from UM425 (A and B) and the nearby galaxy removed. Figure 6 shows the background-subtracted radial profile, as well as the accumulations of counts above background with radius. Based on the point at which the cumulative counts profile flattens out to the background level, we estimate a total of 18125 net cluster counts within the 32″ radial bin777Neither adequate spatial nor spectral information is available from these diffuse counts to better constrain the total flux via spectral or -model spatial fits alà Ettori, Tozzi, Borgani, & Rosati (2004).
If we assume a Raymond-Smith plasma at =0.77 with a rest-frame temperature keV and abundance 0.2 solar, the unabsorbed flux is erg s-1 cm-2 (0.5-2 keV). We ignore -corrections, since they are small () for clusters of keV (Jones et al., 1998). Based on the log-log of extragalactic diffuse X-ray sources (Boschin, 2002; Moretti et al., 2004), the likelihood of finding an X-ray cluster of this brightness (or brighter) within 10″ of any random point on the sky is at most about 4. Thus this cluster is somehow associated with UM425, either as the lensing mass or perhaps (see § 6) as a host cluster to two (presumably unlensed) BALQSOs.
At a redshift of 0.7685 in our adopted cosmology, this spectral model and flux correspond to an X-ray cluster luminosity of (0.1-2.4 keV) erg s-1, consistent with a typical cluster. This luminosity differs from the earlier estimate of AG03 for two reasons. They measured a smaller region, resulting in a lower limit on the cluster counts that was a factor 3.5 smaller than our more detailed analysis here. Furthermore, they were forced to assume a redshift, so reasonably used the minimum flux redshift of 0.6. The revised estimate here is another factor of 1.8 higher, because it is now based on the measured optical cluster redshift.
From Mulchaey & Zabludoff (1998), who analyzed clusters and groups together, both the luminosity and the assumed =2 keV temperature correspond roughly to =550 km s.888A similar estimate of =600 km s would be found from more recent samples (e.g., the REFLEX sample; Ortiz-Gil et al. 2004 after correcting for different assumed cosmologies). This in turn corresponds to a mass estimate sufficient to achieve the observed splitting of UM425A/B for a singular isothermal sphere with optimal placement.
5. Gravitational Lensing Models
Even without any quantitative analysis, it is clear that UM 425 would be an unusual gravitational lens: both the angular separation and the flux ratio of the quasars are large, and no primary lensing galaxy has been detected between the two quasars in deep optical or near-infrared images. Only three out of about 80 well-established lenses have a separation greater than 6″: Q 0957+564 (Walsh, Carswell, & Weymann 1979), RX J0921+4529 (Muñoz et al. 2001) and SDSS J1004+4112 (Inada et al. 2003). In those three cases, there is a central massive lensing galaxy between the quasar images, whose gravitational deflection is supplemented by a surrounding galaxy cluster. The large flux ratio between UM 425A and B (100 at optical wavelengths, and even larger at X-ray wavelengths) would be the largest of any known lens. Large magnification ratios between the two brightest images of a quasar lens are unexpected, because they generally require the fine-tuned placement of the source quasar near a caustic of the lensing mass distribution. In this section, we use the simplest plausible lens model to illustrate these points. With a quasar redshift of 1.465, and assuming a single lens plane at a redshift of 0.77, the critical surface density for strong lensing is g cm M⊙ arcsec-2.
For a singular isothermal sphere (SIS: ), the fractional cross-section for producing systems with a magnification ratio greater than is
| (1) |
implying that only 4% of randomly placed background sources would produce an image pair with a magnification ratio greater than 100. The actual probability of finding such a system is even lower because of magnification bias; systems with large have a total magnification of only 2, the smallest possible magnification for a multiple-image system.
The parameters in the SIS model are the Einstein radius (which sets the overall mass scale), the sky coordinates of the center of mass, and the coordinates and intrinsic flux of the unlensed quasar. With only the image separation and magnification ratio as constraints, we have exactly as many parameters as constraints. Adopting a magnification ratio of 100, the Einstein radius is and the center of mass is located only 64 mas from component B, along the A–B line. (The magnification of each image is proportional to its distance from the lens center.) The differential time delay between the quasar images is 11 years. To estimate the line-of-sight velocity dispersion , we use the standard relation
| (2) |
where and are the angular-diameter distances between the lens and source, and between the observer and source, respectively. The result is km s-1. If this is interpreted as a single elliptical galaxy of normal mass-to-light ratio, the corresponding luminosity predicted from the Faber-Jackson relation is 220 km s, which is ruled out by the non-detection of any galaxy along the A–B line in optical and near-infrared images. Aldcroft & Green (2003) ruled out a galaxy brighter than more than 03 from B, and even if it were coincident with B.
Thus, unless the mass-to-light ratio of the galaxy is at least 80 times larger than usual, the lensing hypothesis requires that a galaxy group or cluster plays an important role, just as it does for the other 3 known large-separation lenses. There are two indications that there is indeed a sufficiently massive foreground cluster. First, there is an overdensity of optically detected galaxies at , with an estimated velocity dispersion of 695 km s-1. Second, the diffuse X-ray emission can be naturally interpreted as a cluster with velocity dispersion of 550 km s-1. The problems are that the centroid of the optically detected galaxies is very poorly known, and the X-ray centroid seems to be closer to A than to B (2″ vs. 8″).
One can ask whether it is possible that there is a low-mass and hitherto-undetected lensing galaxy in an appropriate place between the quasar images, and that the foreground cluster magnifies the image separation to its observed large value. A suitably-placed elliptical galaxy with would have a velocity dispersion of 185 km s-1, and would need to be supplemented by a cluster convergence of . One issue is that the domination of the cluster convergence causes the differential time delay between the quasar images to be small; in this case it is only 1.3 years. Monitoring by Courbin et al. (1995) detected a flare in UM425 B. The flare is consistent with a microlensing event, but if instead was intrinsic to the quasar, the lack of similar burst in UM425 A yields a 3-year upper limit to the time delay which is incompatible with the prediction from the cluster convergence above. If the cluster is given a shear of magnitude 0.1 in the direction of the major axis of the X-ray isophotes, the time delay is reduced even further to 0.8 year. The least massive SIS lens galaxy that produces a time delay greater than 3 years has km s-1 and a Faber-Jackson luminosity of , which is ruled out.
In short, the interpretation of UM 425 as a lens seems to require that at least one of the following possibilities hold: [1] The quasar variability observed by Courbin et al. (1995) and used to place an upper bound on the time delay does not reflect intrinsic variability (due perhaps to microlensing as stated by those authors). [2] The observed quasar flux ratio does not reflect the lensing magnification ratio (due perhaps to an extreme case of differential extinction or to microlensing). [3] The mass distribution is unprecedently “dark.” [4] The X-ray centroid is 6″ (44 kpc at ) from the true center of mass.
Relevant to the last possibility, recent measurements of clusters of galaxies show that all of the following mass centroid estimators may show significant offsets from each other: [1] X-ray diffuse emission centroid, [2] optical galaxy counts centroid, [3] central dominant (cD) galaxy position, and [4] weak lensing mass reconstruction. These offsets may be attributable to significant substructure, ongoing mergers, or more generally to the effects of unsettled local dynamical activities on the intracluster gas. Chandra and XMM-Newton have shown X-ray cluster emission centroids offset by 30-70 kpc from lensing centroid estimates (e.g., Belsole et al. 2005; Clowe et al. 2004; Machacek et al. 2002; Jeltema et al. 2001). For UM425, the cluster X-ray centroid is rather poorly constrained due to the small number of cluster counts and contamination by the bright quasar. Even so, the required dark matter centroid offset is well within the range seen elsewhere.
6. X-ray Cluster Distance
Could the cluster be at the redshift of UM 425 as suggested by Mathur & Williams (2003)? If the diffuse emission arises at the quasar redshift, the X-ray flux for a =3 keV model (consistent with the newly-derived below) would be erg s-1 cm-2 (0.5-2 keV), and the luminosity would be about 1.5 erg s-1. This is not at all an unusual cluster luminosity for a massive cluster, so remains an alternate possibility. The linear scale at that redshift, 8.4 kpc/arcsec yields a reasonable cluster size. A bright cD galaxy should be easily detected in our band image. However, in this high- scenario, the quasars are distinct (unlensed) objects. Either or both are likely to be hosted by massive galaxies. Assuming that either of these host galaxies is a cD progenitor (or if they were to merge as a more massive cD somewhere along the line connecting them), we again are faced with significant (20 kpc), but certainly not unprecedented offsets from the X-ray cluster centroid.
With sufficient X-ray exposure, a definitive redshift can be measured using the Fe K line from the cluster gas even for a distant X-ray cluster (e.g., Hashimoto et al. 2004; Rosati et al. 2004). Given the low flux of the cluster in the UM 425 field, Chandra exposure times to achieve an X-ray redshift would be excessive (i.e., weeks), and an XMM-Newton image would suffer greatly from contamination by the bright quasar due to XMM’s broader PSF. Worse, BALQSOs themselves may show strong Fe K emission (Gallagher et al., 2004), which would worsen these contamination issues considerably..
Despite great interest, clusters at redshifts above unity remain elusive. Quasars at moderately high redshifts to date are unfortunately not reliable signposts of massive clusters (e.g., Donahue, Daly, & Horner 2003), although there are rare exceptions (Siemiginowska et al., 2005). Even at low redshift, no example of a cluster with two luminous quasars has been published. If this is in part the result of a counter-conspiracy of cosmic evolutions (that quasar space density peaks near 2 before massive clusters have formed) then an X-ray luminous cluster hosting two luminous BALQSOs appears indeed unlikely.
Our discovery of an optical cluster renders considerably less probable the hypothesis of Mathur & Williams (2003) is correct that the cluster is at the same redshift as UM425. If there is also a cluster at =1.465, then very deep spectroscopy, or perhaps deep (22) multi-band near-IR imaging could provide redshifts.
7. The Binary Interpretation
Mortlock et al. (1999), building on the work of Kochanek, Falco & Mu oz (1999), argued that a high degree of quasar spectral similarity is expected in true binary quasars with sufficient frequency to explain most of those quasar pairs suspected as lenses but still lacking detection of a lens galaxy. They further suggest that binary quasars “are only observable as such in the early stages of galactic collisions, after which the quiescent supermassive black holes orbit in the merger remnant for some time.” Clearly then, true quasar pairs are of great interest for understanding the hypothesis that interactions trigger accretion events prior to a merger (AG03).
While a redshift of 0.77 for the cluster strengthens the case for the lens interpretation, we still cannot demonstrate convincingly from the existing evidence that UM425 is lensed. Therefore, genuine binarity for UM425 is not ruled out. At least two previous quasar pair studies (Peng et al. 1999 for Q1634+267 and Faure et al. 2003 for LBQS 1429-0053) suffered a similar dilemma. While the images show strikingly similar high-S/N spectra, deep imaging revealed no signs of a lens galaxy, so both studies’ judgment weighed toward a binary interpretation. However, neither found any evidence for a foreground cluster as we have here.
8. Conclusion
UM425A was selected by its anomalous brightness as a lens candidate. UM425B was found in deep followup to have a similar redshift. Since these properties were by selection, they are not by themselves convincing evidence for lensing. More intriguing is that both components show evidence for broad absorption lines, for which the a priori probability is 1 – 5% in optically-selected quasars (Hewett & Foltz, 2003; Reichard et al., 2003b). Additionally, X-ray and optical evidence for a massive intervening cluster presented in this paper are compelling, because at the observed significance, the joint probability in the field of such a redshift spike (7%) or of diffuse X-ray emission (0.04%) is extremely small.
Based on its large angular separation and flux ratio, and the absence of a massive lensing galaxy, if UM425 can be confirmed as a lens it would be an especially interesting one. There may be a particularly dark (high ratio) galaxy, or a large offset between the cluster mass and X-ray emission centroids. Or the images may suffer extreme differential extinction or variability.
Confirmation of lensing for UM425 is most efficiently achieved with further deep, ground-based spectroscopy of the field, combined with deep, high spatial resolution imaging (e.g., using the ACS aboard Hubble) to (1) better characterize cluster membership via morphology, magnitude, red sequence colors and photometric redshifts (2) centroid the optical cluster galaxies and luminosity for comparison to the X-ray centroid and as input to a lensing model, and (3) study the field galaxies for evidence of weak lensing/tangential shear.
PJG and TLA gratefully acknowledge support through NASA contract NAS8-03060 (CXC). Work by J.N.W. was supported by NASA through Hubble Fellowship grant HST-HF-01180.02-A, awarded by the Space Telescope Science Institute, which is operated by the Association of Universities for Research in Astronomy, Inc., for NASA, under contract NAS 5-26555. Imaging and spectroscopy presented here are based on observations made with ESO telescopes at the Paranal Observatories under program IDs 271.A-5009(A) and 073.A-0352(B). Thanks to Tim Beers for providing the rostat biweight estimator code.
References
- Aldcroft & Green (2003) Aldcroft, T.L. & Green, P.J. 2003 ApJ, 592, 710 (AG03)
- Becker et al. (2000) Becker, R. H., White, R. L., Gregg, M. D., Brotherton, M. S., Laurent-Muehleisen, S. A., & Arav, N. 2000, ApJ, 538, 72
- Beers et al. (1990) Beers, T. C., Flynn, K., & Gebhardt, K. 1990, AJ, 100, 32
- Belsole et al. (2005) Belsole, E., Sauvageot, J.-L., Pratt, G. W., & Bourdin, H. 2005, A&A, 430, 385
- Bertin, E. & Arnouts (1996) Bertin, E. & Arnouts, S. 1996 A&AS 117, 393
- Bolzonella, Miralles, & Pello (2000) Bolzonella, M., Miralles, J.-M., & Pello, R. 2000, A&A 363, 476
- Boschin (2002) Boschin, W. 2002, A&A, 396, 397
- Burud et al. (2002a) Burud, I. et al. 2002, A&A, 383, 71 (2002a)
- Burud et al. (2002b) Burud, I. et al. 2002, A&A, 391, 481 (2002b)
- Clowe et al. (2004) Clowe, D., Gonzalez, A., & Markevitch, M. 2004, ApJ, 604, 596
- Courbin et al. (1995) Courbin, F. et al. 1995, A&A, 303, 1
- Cowie et al. (2004) Cowie, L. L., Barger, A. J., Hu, E. M., Capak, P., & Songaila, A. 2004, AJ, 127, 3137
- de Lapparent (2003) de Lapparent, V. 2003, A&A, 408, 845
- De Propris et al. (2003) DeP̃ropris, R., Stanford, S.A., Eisenhardt, P.R, & Dickinson, M. 2003, ApJ, 598, 20 2001, in ASP Conf. Ser., Vol.238, Astronomical Data Analysis and Systems X, eds. F. R. Harnden, Jr., F. A. Primini, & H. E. Payne (San Francisco: ASP), 314.
- Donahue, Daly, & Horner (2003) Donahue, M., Daly, R. A., & Horner, D. J. 2003, ApJ, 584, 643
- Ebeling, White, & Rangarajan (2005) Ebeling, H., White, D.A., & Rangarajan, F.V.N. 2005, MNRAS, in prep
- Ettori, Tozzi, Borgani, & Rosati (2004) Ettori, S., Tozzi, P., Borgani, S., & Rosati, P. 2004, A&A, 417, 13
- Faure et al. (2003) Faure, C., Alloin, D., Gras, S., Courbin, F., Kneib, J.-P., & Hudelot, P. 2003, A&A, 405, 415
- Fukugita et al. (2004) Fukugita, M., Nakamura, O., Schneider, D. P., Doi, M., & Kashikawa, N. 2004, ApJ, 603, L65
- Gallagher et al. (2002a) Gallagher, S. C., Brandt, W. N., Chartas, G., & Garmire, G. P 2002, ApJ, 567, 37 170
- Gallagher et al. (2004) Gallagher, S. C., Brandt, W. N., Wills, B. J., Charlton, J. C., Chartas, G., & Laor, A. 2004, ApJ, 603, 425
- Green et al. (2001) Green, P. J. et al 2001, ApJ, 558, 109
- Hashimoto et al. (2004) Hashimoto, Y., Barcons, X., Böhringer, H., Fabian, A. C., Hasinger, G., Mainieri, V., & Brunner, H. 2004, A&A, 417, 819
- Hewett & Foltz (2003) Hewett, P. C., & Foltz, C. B. 2003, AJ, 125, 1784
- Inada et al. (2003) Inada, N. et al. 2003, Nature, 426, 810
- Jeltema et al. (2001) Jeltema, T. E., Canizares, C. R., Bautz, M. W., Malm, M. R., Donahue, M., & Garmire, G. P. 2001, ApJ, 562, 124
- Jones et al. (1998) Jones, L. R., Scharf, C., Ebeling, H., Perlman, E., Wegner, G., Malkan, M., & Horner, D. 1998, ApJ, 495, 100
- Kayser, Helbig, & Schramm (1997) Kayser, R., Helbig, P., & Schramm, T., 1997, A&A, 318, 680
- Keeton (2002) Keeton, C. R. 2002, ApJ, 575, L1
- Kochanek, Falco & Mu oz (1999) Kochanek, C.S. Falco E.E. & Mu oz, J.A. 1999, ApJ, 510, 590
- Kodama, T. & Bower, R.G. (2001) Kodama, T. & Bower, R.G. 2001, MNRAS, 321, 18
- Koo et al. (1996) Koo, D. C., et al. 1996, ApJ, 469, 535
- Lopes & Miller (2004) Lopes, A. M. & Miller, L. 2004, MNRAS, 348, 519
- Machacek et al. (2002) Machacek, M. E., Bautz, M. W., Canizares, C., & Garmire, G. P. 2002, ApJ, 567, 188
- Markevitch (1998) Markevitch, M. 1998, ApJ, 504, 27
- De Lucia, G. (2004) De Lucia, G. et al. 2004, ApJ, 610, L77
- Mathur & Williams (2003) Mathur, S. & Williams, R. J. 2003, ApJ, 589, L1
- Meylan & Djorgovski (1989) Meylan, G. & Djorgovski, S. 1989, ApJ, 338, L1
- Michalitsianos, Oliversen, & Maran (1996) Michalitsianos, A. G., Oliversen, R. J. & Maran, S. P. 1996, ApJ, 458, 67
- Michalitsianos, Falco, Munoz, & Kazanas (1997) Michalitsianos, A. G., Falco, E. E., Muñoz, J. A., & Kazanas, D. 1997, ApJ, 487, L117
- Miller et al. (2004) Miller, L., Lopes, A. M., Smith, R. J., Croom, S. M., Boyle, B. J., Shanks, T., & Outram, P. 2004, MNRAS, 348, 395
- Moretti et al. (2004) Moretti, A., et al. 2004, A&A, 428, 21
- Mortlock, Webster, & Francis et al. (1999) Mortlock, D. J., Webster, R. L.; Francis, P. J. 1999, MNRAS, 309, 836
- Mulchaey & Zabludoff (1998) Mulchaey, J. S. & Zabludoff, A. I. 1998, ApJ, 496, 73
- Mullis et al. (2003) Mullis, C. R., et al. 2003, ApJ, 594, 154
- Muñoz et al. (2001) Muñoz, J. A., et al. 2001, ApJ, 546, 769
- Murray & Chiang (1997) Murray, N. & Chiang, J. 1997, ApJ, 454, L105
- Oguri et al. (2004) Oguri, M., et al. 2004, ApJ, 605, 7
- Ortiz-Gil et al. (2004) Ortiz-Gil, A., Guzzo, L., Schuecker, P., Böhringer, H., & Collins, C. A. 2004, MNRAS, 348, 325
- Peng et al. (1999) Peng, C. Y., et al. 1999, ApJ, 524, 572
- Reichard et al. (2003b) Reichard, T. A., et al. 2003, AJ, 126, 2594
- Rosati et al. (2004) Rosati, P., et al. 2004, AJ, 127, 230
- Siemiginowska et al. (2005) Siemiginowska, A. L., et al. 2005, ApJ, submitted
- Turner (1990) Turner, E. L. 1990, ApJ, 365, L43
- Walsh et a. (1979) Walsh, D., Carswell, R.F., & Weymann, R.J. 1979, Nat, 279, 381
- Wirth et al. (2004) Wirth, G. D., et al. 2004, AJ, 127, 3121
| ID | RA (J2000) Dec | Redshift | ErroraaRedshift error . | bbObserved-frame emission line equivalent width in Å, and line identification. (Å) | |
|---|---|---|---|---|---|
| 2 | 11 23 7.8 | +01 36 19.0 | 0.8646 | 60 | 7.1 [O II] |
| 4 | 11 23 8.8 | +01 36 30.1 | 0.0309 | 46 | 21 H |
| 7 | 11 23 11.1 | +01 36 28.8 | 0.4201 | 56 | |
| 8 | 11 23 11.1 | +01 36 46.0 | 0.7682 | 44 | 21.1 [O II], 7.1 H, 15.1 [O III] |
| 10 | 11 23 10.4 | +01 38 3.6 | 0.4114 | 82 | |
| 11 | 11 23 11.8 | +01 37 36.9 | 0.7611 | 96 | |
| 15 | 11 23 13.9 | +01 37 59.1 | 0.7463 | 35 | 135 [O II], 51 H, 78 [O III] |
| 16 | 11 23 15.2 | +01 37 43.5 | 0.7692 | 52 | 37 [O II], 14 H, 12 [O III] |
| 17 | 11 23 15.8 | +01 37 53.0 | 0.5424 | 55 | |
| 18 | 11 23 18.5 | +01 37 50.5 | 0.8735 | 55 | 54 [O II], 17 H, 28 [O III] |
| 23 | 11 23 21.3 | +01 37 46.0 | 0.2470 | 45 | 45 [O III], 86 H |
| 25 | 11 23 21.9 | +01 38 5.7 | 0.7663 | 55 | 34 [O II], 11 H |
| 26 | 11 23 22.4 | +01 38 8.7 | 0.5442 | 57 | 14 H, 22 [O III] |
| 28 | 11 23 23.9 | +01 38 0.9 | 0.7767 | 51 | |
| 30 | 11 23 24.5 | +01 38 21.0 | 0.7707 | 67 | 12 [O II], |
| 31 | 11 23 25.9 | +01 38 20.5 | 0.7644 | 51 | 26 [O II], 10 H, 19: [O III] |
| 33 | 11 23 26.4 | +01 38 43.7 | 0.7723 | 62 | |
| 35 | 11 23 28.5 | +01 38 52.8 | 0.1426 | 53 | 44 H |
| 36 | 11 23 29.7 | +01 39 4.9 | 0.8654 | 48 | 41 [O II], 17 H |
| 38 | 11 23 30.7 | +01 39 30.6 | 0.8661 | 58 | 61 [O II], 22 H |
| 39 | 11 23 30.7 | +01 39 42.2 | 0.3298 | 34 | 11 H, 8 [O III], 77 H |