1-1 Machikaneyama-cho, Toyonaka, Osaka 560-0043, Japan
11email: torii@ess.sci.osaka-u.ac.jp
Early imaging and the discovery of the optical afterglow of GRB 041218
We report early imaging of the INTEGRAL GRB 041218. The observation started 129 s after the burst and a sequence of exposures in , , , and bands were repeated. The optical afterglow is detected in and bands while it was not detected in and . We find that the early afterglow deviates from a single power law decay and identify two characteristic timescales (breaks). Such breaks are theoretically expected from synchrotron cooling in the relativistic fireball (Sari et al. 1998) and we crudely constrain the physical condition of the relativistic shock.
Key Words.:
Gamma rays: bursts1 Introduction
The discovery of afterglow emission of gamma-ray bursts (van Paradijs et al. vanparadijs (1997); Costa et al. costa (2004)) opened new diagnostics for quantitative characterization of relativistic shock in GRBs. Follow-up observation within minutes of the gamma-ray emission is particularly important, since the afterglow has information close ( pc) to the progenitor. Early optical afterglow has been detected only in a small number of occasions, including GRB 990123 (Akerlof et al. akerlof (1999)), GRB 021004 (Torii et al. torii02 (2002); Fox et al. fox (2003)), GRB 021211 (Wozniak et al. wozniak (2002)), and GRB 030418 (Rykoff et al. rykoff (2004)). In spite of the limited pieces of data, early afterglows have shown rich variety of behaviors which provided us with crucial information on the physical condition in the vicinity of the progenitor. These data brought us with the interesting pictures such as forward and reverse shock components (GRB 990123 and GRB 021211), continued energy injection from the central engine (GRB 021004), and large extinction near the massive progenitor (GRB 030418).
Since all these early detections were made by unfiltered or single filter CCDs, no information on the afterglow color could be derived in the previous studies. In this Letter, we report early imaging and the discovery of the optical afterglow of GRB 041218 with the Automated Response Telescope (ART).
2 Observations and Results
A long (60 s) duration gamma-ray burst, GRB 041218 was detected with the IBIS/ISGRI instruments onboard the INTEGRAL satellite at 2004 December 18, 15:45:25 UT (Mereghetti et al. 2004) and the burst position was distributed through IBAS (Mereghetti et al. mereghetti03 (2003)). After the earliest successful automated observation of GRB 030329 (Torii et al. torii03 (2003); Vanderspek et al. vanderspek (2004)), we upgraded the ART by using a larger telescope and installing standard photometric filters. GRB 041218 observations were performed with a 14 inch f/7 Schmidt Cassegrain telescope, equipped with Cousin’s filters (Bessel 1990) in conventional filter wheel and cooled CCD camera (KAF-1001E). The first 60 s exposure in band was started at 15:47:34 UT, or 129 s after the burst. Then a sequence of 60 s exposures in , , and bands was repeated. When the observation started, a large fraction of the sky was covered by clouds while the transparency gradually improved until 20 minutes post-burst. After that, the field of view was intermittently covered by clouds.
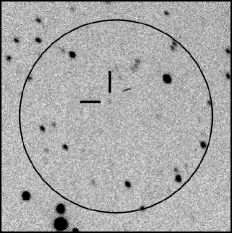
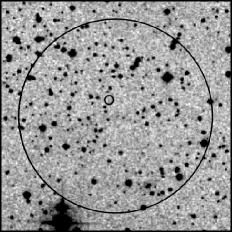
We stacked four (two and two ) frames obtained on December 18 between 15:57:59 and 16:09:24 UT and visually compared the resulting image with the digitized Palomar Observatory Sky Survey frame. In this stacked image, we noted a new object with S/N = 3.8 near the center of the radius error circle (Mereghetti et al. mereghetti03 (2003)) and reported it to the GCN Circular (Torii torii04 (2004)). An independent identification of this new object and its fading was reported by Gorosabel et al. (gorosabel (2004)). Figure 1 shows the GRB 041218 field as imaged by ART and the digitized Palomar Observatory Sky Survey 2 Red for comparison.
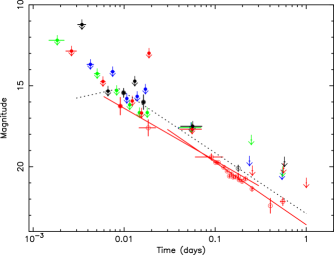
After dark subtraction and flat fielding, we applied robust source detection and PSF photometry procedures to the data. When the source counts exceeded the level we considered it as a detection. In the other cases such upper limit was derived. The afterglow was detected in one frame at and two frames at 4.0 and level. The derived magnitudes, calibrated by using the field photometry of Henden (henden (2004)), are summarized in Table 1. Figure 2 shows the light curves combining our data with those reported in the GCN Circulars.
| Start Time | Mean Epoch | Magnitude* | Filter | Exposure |
|---|---|---|---|---|
| (UT) | (days) | (s) | ||
| 15:47:34 | 0.00184 | 12.19 | 60 | |
| 15:48:43 | 0.00263 | 12.85 | 60 | |
| 15:49:52 | 0.00343 | 11.22 | 60 | |
| 15:51:03 | 0.00425 | 13.68 | 60 | |
| 15:52:12 | 0.00505 | 14.25 | 60 | |
| 15:53:21 | 0.00585 | 14.73 | 60 | |
| 15:54:29 | 0.00664 | 15.33 | 60 | |
| 15:55:41 | 0.00747 | 14.13 | 60 | |
| 15:56:50 | 0.00827 | 15.29 | 60 | |
| 15:57:59 | 0.00907 | 16.250.54 | 60 | |
| 15:59:08 | 0.00987 | 15.430.27 | 60 | |
| 16:00:19 | 0.01069 | 15.79 | 60 | |
| 16:01:28 | 0.01149 | 16.18 | 60 | |
| 16:02:37 | 0.01229 | 15.94 | 60 | |
| 16:03:46 | 0.01309 | 14.72 | 60 | |
| 16:04:57 | 0.01391 | 15.66 | 60 | |
| 16:06:06 | 0.01471 | 16.66 | 60 | |
| 16:07:15 | 0.01550 | 16.68 | 60 | |
| 16:08:24 | 0.01630 | 16.000.45 | 60 | |
| 16:09:35 | 0.01712 | 15.21 | 60 | |
| 16:10:46 | 0.01795 | 16.66 | 60 | |
| 16:11:56 | 0.01876 | 12.99 | 60 | |
| 16:42:10 | 0.05425 | 17.62 | 60 9 | |
| 16:43:19 | 0.05505 | 17.58 | 60 10 | |
| 16:44:28 | 0.05585 | 17.50 | 60 10 | |
| 16:45:37 | 0.05664 | 17.68 | 60 10 |
Upper limits are at level.
3 Discussion
The afterglow light curve of GRB 041218 shows, roughly, a power law decay. Here, we try to model the light curve as synchrotron radiation from the relativistic fireball.
Fitting the band light curve with the function ( in days) gives and with . The errors for and are 90% confidence values. A large value is mainly due to fluctuations at days while this function marginally overestimate the flux in the first two detections, suggesting that the flux decay rate steepened at around days. If we fit the data at days, a steeper index and are obtained with .
For the band, only three detections are available and they are well described with a single power law with and . This function is drawn as dotted black line in Figure 2 for days. The decay index in band is fully consistent with that for the band. However, the upper limit at 0.00664 days is significantly (0.59 mag) below the extrapolation from this power law. This means that the flux decay with started just before the earliest detection at 0.00987 days. By using the upper limit at 0.00664 days, the decay index must have been at days and suddenly changed to within minutes.
We note that the observed changes in the decay indices (at days in and at days in ) are theoretically expected for synchrotron radiation from relativistic fireball (e.g., Sari et al. 1998). According to this model, the early optical afterglow is expected to show breaks. The first one, , corresponds to the transit in the optical band of the typical electrons synchrotron frequency for minimum Lorentz factor, . The second one, , is the break corresponding to the transit of the cooling frequency in the observing band. Therefore, we interpret days and days.
We may constrain the power law index of electron number distribution, , from the band light curve at days. From the relation and , we derive . Before the cooling break at , the decay index is expected to be . Therefore, we draw a power law decay with that starts with our first detection at days. These two power law functions are shown in Figure 2 by red lines; they intersect at days.
We then constrain so that the limit in at days is consistent with the model function. In the early part of the afterglow light curve, the flux is expected to increase with a power law index (Sari et al. sari (1998)). This constraint leads to a rising light curve at days, as drawn in Figure 1. The existence of was originally invoked to conserve the total energy above and it is unclear if such a clear-cut lower boundary exists in the accelerated electrons distribution. The fact that the early afterglow seems to have brightened in a short timescale (minutes) suggests that there is a distinct lower limit in the electron energy distribution at .
For the other parameters, we can not solve the degeneracy due to the limited pieces of information. Instead, we try to build some trial parameter sets in the framework of the Sari et al. (sari (1998)) model with adiabatic evolution. An arbitrary assumption of isotropic burst kinetic energy ergs and the fraction of energy density in the magnetic field gives the astrophysically reasonable set of other parameters, the fractional energy density of accelerated electrons, , and the density of the surrounding medium, .
The above discussion applies for constant density around the progenitor. The environment of long duration gamma-ray bursts are likely surrounded by stellar wind from a massive progenitor. In the framework of the Chevalier & Li (2000) model, the early flux rise in GRB 041218 afterglow may be explained as due to the clearance of the synchrotron self absorption. In this case (Case B in Chevalier & Li (2000)), the early afterglow brightens as . But again, the model parameters can not be fully constrained and we can not distinguish whether the interstellar or the circumstellar model gives the better description.
By interpolating and measurements, we may derive the afterglow color as at days and at days. These values are within the range (, imon et al. simon (2001)) measured in other afterglows. Although the Galactic extinction in the burst direction is estimated as E()=0.61 or A()A()=0.45 from dust emission (Schlegel et al. schlegel (1998)), the optical star count suggests a lower value (A()1.0 or A()-A() 0.22) (Dobashi et al. dobashi (2005), figure 12). The fact that the GRB 041218 afterglow has an color similar to that of other unextincted afterglows suggests that the lower extinction is likely correct. The at days is not that strong constraint and consistent with those observed in other afterglows (imon et al. simon (2001)).
4 Conclusions
We presented early imaging results and the discovery of the optical afterglow of GRB 041218. The afterglow light curve was found to deviate from a single power law decay and two characteristic timescales, days and days, were identified. We showed that the standard fireball model gives simple enough account for the observed data.
In the early phase of GRB afterglow, a variety of unexplored physical processes, such as interaction of pairs with the swept-up materials are expected (Beloborodov 2005). We expect that further follow-up observations with the ART for the INTEGRAL, HETE-2, and Swift GRBs will give insights into such phenomena.
Acknowledgements.
This work is partly supported by a Grant-in-Aid for Scientific Research by the Ministry of Education, Culture, Sports, Science and Technology of Japan (15740129 and 16002004). This study is also carried out as part of the 21st Century COE Program, ‘Towards a new basic science: depth and synthesis’. The Digitized Sky Survey was produced at the Space Telescope Science Institute based on photographic data obtained using the Oschin Schmidt Telescope on Palomar Mountain. The Second Palomar Observatory Sky Survey was made by the California Institute of Technology.References
- (1) Akerlof, C., Balsano, R., Barthelmy, S., et al. 1999, Nature, 398, 400
- (2) Beloborodov, A.M. 2005, astro-ph/0503049
- (3) Bessel, M.S. 1990, PASP, 102, 1181
- (4) Cenko, S.B. 2004, GCN Circ., 2875
- (5) Chevalier, A. C., & Li, Z.-Y. 2000, ApJ, 536, 195
- (6) Costa, E., Frontera, F., Heise, J., et al. 1997, Nature, 387, 783
- (7) D’Avanzo, P., Ciroi, S., Malesani, D., et al. 2004, GCN Circ., 2879
- (8) Dobashi, K., Uehara, H., Kandori, T., et al. 2005, PASJ, 57, S1
- (9) Ferrero, P., Pizzichini, G., Greco, G., et al. 2004, GCN Circ., 2897
- (10) Fox, D.W., Yost, S., Kulkarni, S.R., et al. 2003, Nature, 422, 284
- (11) Gorosabel, J., de Ugarte, A., Castro-Tirado, A.J., et al. 2004, GCN Circ., 2861
- (12) Halpern, J.P., & Tuttle, S. 2004, GCN Circ., 2873
- (13) Henden, A. 2004, GCN Circ., 2869
- (14) Klotz, A., Boer M., Atteia, J.L., & Stratta, G. 2004, GCN Circ., 2904
- (15) Mereghetti, S. Gtz, D., Borkowski, J., et al. 2003, A&A, 411, L291
- (16) Mereghetti, S., Gotz, D., Shaw, S., et al. 2004, GCN Circ., 2858
- (17) Misra, K., & Pandey, S.B. 2004, GCN Circ., 2888
- (18) Monfardini, A., Mottram, C., Guidorzi, C., et al. 2004, GCN Circ., 2878
- (19) Rykoff, E.S., Smith, D.A., Price, P.A., et al. 2004, ApJ, 601, 1013
- (20) Sari, R., Piran, T., & Narayan, R. 1998, ApJL, 497, L17
- (21) Schlegel, D., Finkbeiner, D., & Davis, M. 1998, ApJ, 500, 525
- (22) imon, V., Hudec, R., Pizzichini, G., & Masetti, N. 2001, A&A, 377, 450
- (23) Torii, K., Kato, T., & Yamaoka, H. 2002, GCN Circ., 1589
- (24) Torii, K., Kato, T., Yamaoka, H., et al. 2003, ApJL, 597, 101
- (25) Torii, K. 2004, GCN Circ., 2860
- (26) Vanderspek, R., Sakamoto, T., Barraud, C., et al. 2004, ApJ, 617, 1251
- (27) van Paradijs, J., Groot, P.J., Galama, T., et al. 1997, Nature, 386, 686
- (28) Wozniak, P., Vestrand, W.T., Starr, D., et al. 2002, GCN Circ., 1757
- (29) Yonetoku, D., Murakami, T., Masui, H., et al. 2004, GCN Circ., 2892