Results of a Search for Cold Flows of Dark Matter Axions
Abstract
Theoretical arguments predict that the distribution of cold dark matter in spiral galaxies has peaks in velocity space associated with non-thermalized flows of dark matter particles. We searched for the corresponding peaks in the spectrum of microwave photons from axion to photon conversion in the cavity detector of dark matter axions. We found none and place limits on the density of any local flow of axions as a function of the flow velocity dispersion over the axion mass range 1.98 to 2.17 eV.
pacs:
PACS numbers: 14.80.Mz, 95.35.+d, 98.35.GiI. Introduction
The axion [1, 2] is a light pseudo-scalar particle whose existence would explain why the strong interactions conserve the discrete symmetries P and CP in spite of the fact that the Standard Model as a whole violates those symmetries. It is the quasi-Nambu-Goldstone boson associated with the spontaneous breaking of a global symmetry. The axion mass is
| (1) |
where , called the axion decay constant, is of order the expectation value that breaks . All axion couplings are inversely proportional to . In particular, the coupling exploited in our experiment, of the axion to two photons, is given by
| (2) |
In Eq. (2), , and are the axion and electromagnetic fields, and is a model-dependent factor of order one. In one class of representative benchmark models, called KSVZ [3], . In another class, called DFSZ [4], .
In the to eV range, the axion is a well-established cold dark matter (CDM) candidate [5, 6]. The present velocity dispersion of cosmic axions is [7]
| (3) |
In many discussions of cold dark matter detection it is assumed that the distribution of CDM particles in galactic halos is isothermal [8]. An isothermal distribution may be the outcome of an early epoch of “violent relaxation” [9] of the galactic halo. However, there are excellent reasons to believe that a large fraction of the local density of cold dark matter particles is in discrete flows with definite velocities [10]. Indeed, because CDM has very low primordial velocity dispersion and negligible interactions other than gravity, the particles lie on a 3-dim. hypersurface in 6-dim. phase-space. Because the number of particles involved is extremely large, this “phase-space sheet” is continuous; it cannot break. Wherever a galaxy forms, the sheet winds up in phase-space. This implies that the velocity spectrum of CDM particles at any physical location is discrete, i.e., it is the sum of distinct flows each with its own density and velocity. The existence of discrete flows is seen in numerical simulations of galactic halo formation when care is taken to enhance the resolution in the relevant regions of phase-space [11].
Discrete flows (sometimes called ‘streams’) are also produced when satellites, such as the Sagittarius dwarf galaxy, are tidally disrupted by the gravitational field of the Milky Way [12, 14]. N-body simulations of galactic halo formation predict [15] that the Milky Way halo contains hundreds of such satellites.
A consequence of the existence of discrete flows is the formation of caustics [13]. If the Earth is sufficiently close to a caustic, the local density is dominated by a pair of flows and a high resolution search becomes a very powerful tool for discovering the axion signal. A recent paper [16] claims on observational grounds that we are in fact very close to a caustic in the Milky Way halo and that the local dark matter density is dominated by a pair of flows, with one member of the pair contributing 75% of the local density. If this is the case, the corresponding line is much narrower than a thermalized spectrum and hence has much higher signal to noise in a high resolution search.
II. Experiment
Dark matter axions can be detected by stimulating their conversion to microwave photons in a cavity permeated by a strong magnetic field [17, 18]. The energy of the outgoing photon equals the total energy of the incoming axion:
| (4) |
where is the velocity of the converted axion in the frame of the detector. Because galactic halo axions have velocities of order , the photon frequencies are spread over where is the axion mass frequency and , called the axion quality factor, is of order .
When is at the center of the bandwidth of the cavity, the power generated in the cavity from axion conversion is [17]
| (5) | |||||
| (6) |
where is the cavity volume, the magnetic field strength, the local density of halo axions, and the loaded quality factor of the cavity. is a form factor which is largest in the fundamental TM mode. Because is unknown (except within three orders of magnitude), the detector is made tunable to explore a wide range of frequencies. Tuning is achieved by displacing dielectric and metal rods inside the cavity. We calculate the value of for each rod position by numerically simulating the cavity. Over the range of frequencies reported upon here, 478 – 525 MHz, varies from 0.42 to 0.38. The cavity volume is 189 L. Typical values for and are 7.8 T and respectively. The output of the cavity is amplified, shifted down in frequency by mixing with a local oscillator, digitized, and spectrum analyzed using the Fast Fourier Transform (FFT) algorithm at two different resolutions, which we call medium (MR) and high resolution (HR). See ref. [18] for a detailed description of the apparatus.
In the MR channel, the spectrum taken at each cavity setting is the average of individual spectra, each of which is the FFT of the cavity output voltage measured over an 8 ms time interval, for a total measurement integration time of 80 s [18]. The resulting resolution (125 Hz) is well matched to the expected width (approx. 500 Hz for = 500 MHz) of the axion signal. The MR search is not predicated on any assumption about the velocity distribution of axions in the Galactic halo, other than the very conservative assumption that their velocity dispersion is not larger than about 300 km/s.

In the HR channel we increase the resolution to 0.019 Hz by taking, at each cavity setting, the FFT of a single 52 s long sequence of cavity output measurements. The sampling rate is set by the cavity bandwidth kHz (for = 500 MHz). The FFTs involve therefore approximately one million data points each. A discrete CDM flow produces a peak in the spectrum of microwave photons from axion conversion in our detector. Each peak’s has a daily modulation due to the Earth’s rotation and an annual modulation due to its orbital motion [19]. The latter causes a peak frequency to shift by an amount of order 100 Hz or less in the course of the year, whereas the daily shift is of order 1 Hz or less (for MHz). During the time (52s) spent taking data at each cavity tune, a peak’s frequency shifts by an amount which is at most Hz, due to the Earth’s rotation. The resulting broadening of peaks is less than the present HR resolution (0.02 Hz).
We now describe the method by which we identify HR candidate peaks and discriminate spurious peaks (environmental and statistical) from potentially real axion signals. At the highest resolution (the “1-bin search”), the power in each frequency bin is the sum of independent sine and cosine components. The observed probability distribution of is shown in Fig. 1. For low values of , the distribution is of the form
| (7) |
This exponential behaviour is characteristic of the thermal and electronic noise from the cavity/amplifier chain. is the average noise power in the 1-bin search. Hence, is proportional to the total noise temperature , where 1.7 K) is the physical temperature of the cavity and 2.0 K) is the total electronic noise temperature of the receiver chain. We verified this relationship experimentally by heating the cavity and showing that is a linear function of . Indeed, that measurement constitutes our calibration of the power emitted by the cavity.
Thermal and electronic noise is only one part of the background in the search for an axion signal. The other part is a set of narrow lines from the R.F. environment of the experiment. These are signals from nearby emitters (e.g. computer clocks) which leak into the cavity by a variety of means. We refer to such narrow lines as ‘environmental peaks’. The difference between the observed -distribution and Eq. (7) for (see Fig. 1) is due to environmental peaks.
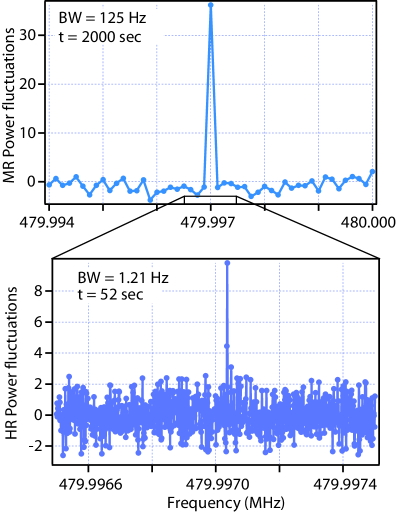
We performed a comparison between the signal power observed in the HR and MR channels using an environmental peak at 480 MHz; see Fig. 2. The HR and MR signals were determined to have power W and W in that peak respectively. The difference between the two measurements is consistent with the size of the noise fluctuations in the HR channel. Note that this MR spectrum was acquired over a much longer measurement integration time than the HR spectrum (2000 s vs. 52 s).
In addition to the 1-bin search, we conduct -bin searches with , 512 and 4096, to search for dark matter axion flows of correspondingly larger velocity dispersion. An -bin is the sum of adjacent 1-bins. Each -bin is made to overlap with half of the previous -bin to avoid missing a peak which would otherwise spread over adjacent -bins.
Before candidate peaks are selected, each HR spectrum is corrected for the combined passband-filter response of the receiver chain and for the frequency-dependent response of the coupling between the cavity and the first cryogenic amplifier. These corrections are similar to those for the MR channel, and have been described in detail elsewhere [18]. For each corrected HR spectrum, the -distribution is fitted to Eq. (7) for , to determine the value of . The 2-bin spectrum is obtained by combining adjacent bins in the 1-bin spectrum, the 4-bin spectrum is likewise obtained from the 2-bin spectrum, and so on. For each , a power threshold was chosen such that any peak with power larger than that threshold will be considered a candidate axion signal. The thresholds were set as low as possible consistent with the requirement that the number of candidates remain manageable. The thresholds are 20, 25, 30, 40, 120, 650 and for = 1, 2, 4, 8, 64, 512 and 4096 respectively.
The set of candidate peaks that passed these thresholds were investigated in subsequent runs, using the same methods as we apply to the MR channel [18]. All our candidates were shown to be environmental peaks.
We now place a limit on the density of any persistent axion dark matter flow as a function of its velocity dispersion, over the frequency range covered (478 – 525 MHz). The corresponding axion mass range is 1.997 to 2.171 eV. The -bin search places a limit on an axion flow of velocity disperion equal to or less than
| (8) |
where is the flow velocity in the laboratory reference frame. Eq. (8) was obtained by varying Eq. (4) and using (0.019 Hz) for the bin width, and MHz for the frequency.
The cavity was operated at near-critical coupling. Hence, half of the power of Eq. (6) is measured by the receiver chain (the other half being lost in the cavity walls), provided (1) the axion mass frequency falls at the center of the cavity bandwidth, and (2) the frequency of the axion signal peak is at the center of a single bin.
If the axion mass frequency differs from the cavity resonant frequency , the observed power is reduced by the Lorentzian factor
| (9) |
To set conservative limits, we use for each cavity setting the smallest value of the Lorentzian factor over the bandwidth covered by that setting.
If the frequency of an axion signal peak does not fall at the center of a bin, the signal power is spread over several bins. It can be shown that the minimum fraction of the power in a narrow line that ends up in a single -bin is 40.5% for , 81% for , 87% for , and 93% for . For , 512 and 4096, practically all the power ends up in a single bin regardless of where falls relative to the bin boundaries. To set conservative limits, we use the above minimum fractions of signal power that fall in a single -bin.
For the 64, 512 and 4096-bin searches, a background subtraction was performed. For those searches, the signal power levels such that the sum of signal plus background has 97.7% probability to exceed the thresholds stated earlier, beyond which a peak is considered a candidate axion signal, are respectively 71, 182 and 531 . The latter are therefore the 97.7% confidence level upper limits on an axion signal obtained from the 64, 512 and 4096-bin searches. The limits from the lower searches are not appreciably improved by performing a background subtraction. Those limits equal the thresholds (20, 25, 30, and 40 for = 1, 2, 4, and 8) beyond which a peak is considered an axion signal candidate.
III. Discussion
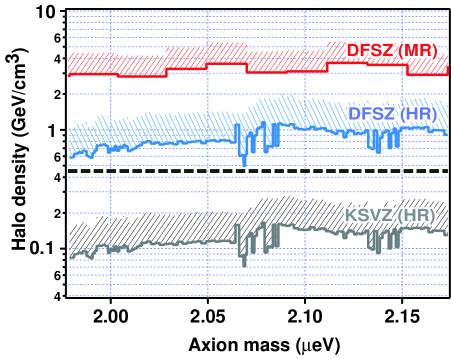
The limits on the density of a cold flow of axion dark matter derived from the 2-bin search are shown in Fig. 3. The limits derived from the other -bin searches differ from the limits only by constant (frequency independent) factors. These factors are respectively 1.60, 1.00, 1.12, 1.39, 2.53, 5.9 and 17.2 for = 1, 2, 4, 8, 64, 512 and 4096. The limits from the searches are less severe than the limit, but they are valid for larger velocity dispersions [see Eq. (8)]. The limit is both less severe and less general than the limit.
Fig. 3 shows the potential of the High Resolution analysis for finding or excluding cosmic axions when a significant fraction of the local density is contained in one or few lines resulting from the incomplete thermalization of infalling dark matter. Over the measured mass range, flows are excluded for densities of order 1 GeV/cm3 even for DFSZ axions, which has the smallest axion-photon coupling ( = 0.36), at 97.7% c.l. This marks an improvement in sensitivity of a factor 3 over our previous Medium Resolution analysis.
This work is supported in part by U.S. Department of Energy under Contract W-7405-ENG-48 at Lawrence Livermore National Laboratory, and under grant DE-FG02-97ER41029 at the University of Florida.
REFERENCES
- [1] S. Weinberg, Phys. Rev. Lett. 40 (1978) 223; F. Wilczek, Phys. Rev. Lett. 40 (1978) 279.
- [2] R. D. Peccei and H.R. Quinn, Phys. Rev. Lett. 38 (1977) 1440; Phys. Rev. D16 (1977) 1791.
- [3] J.E. Kim, Phys. Rev. Lett. 43 (1979) 103; M.A. Shifman, A.I. Vainshtein and V.I. Zakharov, Nucl. Phys. B166 (1980) 493.
- [4] A.P. Zhitnitskii, Sov. J. Nucl. Phys. 31 (1980) 260; M. Dine, W. Fischler and M. Srednicki, Phys. Lett. B104 (1981) 199.
- [5] J. Preskill, M. Wise and F. Wilczek, Phys. Lett. B120 (1983) 127; L. Abbott and P. Sikivie, Phys. Lett. B120 (1983) 133; M. Dine and W. Fischler, Phys. Lett. B120 (1983) 137.
- [6] J.E. Kim, Phys. Rep. 150 (1987) 1; H.-Y. Cheng, Phys. Rep. 158 (1988) 1; M.S. Turner, Phys. Rep. 197 (1990) 67; G.G. Raffelt, Phys. Rep. 198 (1990) 1.
- [7] S. Chang, C. Hagmann and P. Sikivie, Phys. Rev. D59 (1999) 023505.
- [8] P.F. Smith and J.D. Lewin, Phys. Rep. 187 (1990) 203.
- [9] D. Lynden-Bell, MNRAS 136 (1967) 101.
- [10] J.R. Ipser and P. Sikivie, Phys. Lett. B291 (1992) 288.
- [11] D. Stiff and L.M. Widrow, Phys. Rev. Lett. 90 (2003) 211301.
- [12] D. Stiff, L.M. Widrow and J. Frieman, Phys. Rev. D64 (2001) 083516.
- [13] P. Sikivie, Phys. Lett. B432 (1998) 139; Phys. Rev. D60 (1999) 063501.
- [14] K. Freese, P. Gondolo, H.J. Newberg and M. Lewis, Phys. Rev. Lett. 92 (2004) 111301.
- [15] J.F. Navarro, C.S. Frenk and S.D.M. White, Ap. J. 462 (1996) 563; B. Moore et al., Ap. J. Lett. 499 (1998) L5.
- [16] P. Sikivie, Phys. Lett. B567 (2003) 1.
- [17] P. Sikivie, Phys. Rev. Lett. 51 (1983) 1415; Phys. Rev. D32 (1985) 2988.
- [18] C. Hagmann et al., Phys. Rev. Lett. 80 (1988) 2043; S. Asztalos et al., Phys. Rev. D64 (2001) 092003; S. Asztalos et al., Ap. J. 571; S. Asztalos et al., Phys. Rev. D69 (2004) 011101(R).
- [19] F.-S. Ling, P. Sikivie and S. Wick, Phys. Rev. D70 (2004) 123503.
- [20] E.I. Gates, G. Gyuk, M.S. Turner, Ap. J. 449 (1995) L123.
2