The detection of Class I methanol masers towards regions of low-mass star formation.
S. V. Kalenskii, V. G. Promyslov, V. I. Slysh
Astro Space Center of P.N. Lebedev’s Physical Institute
P. Bergman, A. Winnberg
Onsala Space Observatory
Abstract
Six young bipolar outflows in regions of low-to-intermediate-mass star formation were observed in the , , and methanol lines at 44, 95, and 84 GHz, respectively. Narrow features were detected towards NGC 1333IRAS4A, HH 25MMS, and L1157 B1. Flux densities of the detected lines are no higher than 11 Jy, which is much lower than the flux densities of strong maser lines in regions of high-mass star formation. Analysis shows that most likely the narrow features are masers.
Introduction
Bright and narrow maser lines of methanol (CH3OH) have been found towards many star-forming regions. According to the classification by Menten [1], all methanol masers can be divided into two classes, I and II. The Class I masers emit in the transitions at 44 GHz, at 36 GHz, at 84 GHz etc, the Class II masers emit in the transitions at 6.7 GHz, at 12 GHz, and in the series of transitions at 157 GHz etc. Class II masers are often associated with UC HII regions or IR sources. According to current views, Class I masers are pumped by collisions, and Class II masers are pumped by external radiation.
As a result of a number of surveys in the Class I lines , , etc., more than one hundred Class I masers have been found in high-mass star-forming regions. At the same time, Bachiller et al. [2] and Kalenskii et al. [3] observed a large number of both high-mass and low-mass young stars in the line and did not find any maser towards low-mass stars. Therefore it is generally considered that the Class I masers are related to massive stars. An exception is the detection by Kalenskii et al. [4] of a narrow, probably, maser feature in the Class I lines and towards the blue wing of the bipolar outflow driven by a young low-mass star L1157-mm. Gas in this direction is shock heated to a temperature of about 100 K, and the abundances of methanol, ammonia, formaldehyde, and many other molecules are enhanced due to grain mantle evaporation.
| Transition | Frequency | Line | HPBW2 | Jy/K |
|---|---|---|---|---|
| (GHz) | strength1 | |||
| 44.069476 | 2.8609 | 82 | 20.5 | |
| 84.521206 | 1.4115 | 44 | 22 | |
| 95.169516 | 3.3377 | 39 | 25 | |
| 96.739393 | 1.5 | 39 | 25 | |
| 96.741377 | 2 | 39 | 25 | |
| 96.744549 | 2 | 39 | 25 | |
| 96.755507 | 1.5 | 39 | 25 |
1–from Lees et al. [6]
2–half-power beamwidth
The reason for nondetection of masers at 44 GHz by Bachiller et al. [2] and Kalenskii et al. [3] might be an insufficiently high sensitivity (about 10 Jy) or poor choice of either star-forming regions and/or observing positions. In particular, it is reasonable to assume that methanol masers are formed towards the wings of bipolar outflows, where the abundance of methanol is enhanced [5]. However, in the survey by Bachiller et al. [2] the telescope was often pointed towards objects, and in the survey by Kalenskii et al. [3] it was pointed towards these objects almost without exception. objects spatially coincide with central sources of outflows rather than with their wings. The low-mass objects that were observed by Bachiller et al. and Kalenskii et al. are located relatively close to the Sun, usually at a distance of 500 pc or closer. The regions, where the gas is shock heated, are often located approximately away from the central sources or even further. The masers, related to these regions, would fall outside the wide main beam of the telescope, used in the observations by Bachiller et al. and Kalenskii et al. The regions of massive star formation are much more rare objects than the regions of low mass star formation. Most of them are located at several kpc from the Sun, and their angular sizes are usually less than . Therefore, in the single-dish observations the masers fall within the antenna beams and tend to be detected independently of their exact locations in star-forming regions. For example, the masers in a relatively nearby (2 kpc from the Sun) region of massive star formation L379 are located towards a bipolar outflow wing; however, they fell into the main beam of the telescope when Kalenskii et al. [3] observed the central source, . The closest maser is offset from this object, which corresponds to a linear distance of 0.3 pc111For simplicity, we call ”distance” the projection of distance on the plane of the sky.. If L379 were located at 500 pc from the Sun, all angular distances would increase by a factor of 4. The masers would be offset from the object and would not fall into the telescope beam.
| Source | R.A.B1950 | Line | FWHM | |||
|---|---|---|---|---|---|---|
| DEC.B1950 | (K km s-1) | (km s-1) | (km s-1) | (K) | ||
| NGC 1333IRAS2 | 03 25 54.5 | I | 1.33(0.06)1 | 10.83(0.17) | 7.88(0.45) | 0.16 |
| 31 04 00 | II | 0.98(0.08) | 9.97(0.28) | 8.38(0.85) | 0.11 | |
| III | 5.32(0.09) | 10.14(0.04) | 5.46(0.10) | 0.92 | ||
| NGC 1333IRAS4A | 03 26 04.8 | I | 0.16(0.02) | 6.65(0.13) | 1.59(0.22) | 0.095 |
| 31 03 13 | I | 0.09(0.02) | 7.51(0.02) | 0.33(0.05) | 0.25 | |
| II | 1.01(0.11) | 4.38(0.78) | 8.93(1.49) | 0.11 | ||
| II | 0.44(0.06) | 7.32(0.03) | 0.94(0.14) | 0.45 | ||
| III | 1.60(0.12) | 3.78(0.16) | 7.19(0.31) | 0.21 | ||
| III | 0.16(0.04) | 6.95(0.04) | 0.67(0.13) | 0.23 | ||
| III | 0.64(0.03) | 6.42(0.10) | 2.31(0.17) | 0.26 | ||
| NGC 1333IRAS4B | 03 26 06.5 | I | 0.32(0.03) | 7.10(0.07) | 1.83(0.21) | 0.16 |
| 31 02 51 | II | 1.15(0.07) | 5.36(0.30) | 9.31(0.57) | 0.12 | |
| II | 0.16(0.04)2 | 6.08(0.07) | 0.76(0.20) | 0.20 | ||
| II | 0.33(0.03) | 7.16(0.04) | 0.76(0.08) | 0.40 | ||
| III | 2.70(0.09) | 4.72(0.15) | 8.77(0.29) | 0.29 | ||
| III | 0.73(0.05) | 6.86(0.04) | 1.59(0.10) | 0.43 | ||
| HH 25MMS | 05 43 34.0 | I | 0.27(0.02) | 10.42(0.01) | 0.48(0.04) | 0.52 |
| 00 15 20 | II | 0.81(0.11) | 9.97(0.36) | 5.60(0.80) | 0.14 | |
| II | 0.31(0.04) | 10.14(0.03) | 0.53(0.06) | 0.54 | ||
| III | 1.63(0.08) | 10.53(0.07) | 2.87(0.17) | 0.53 | ||
| L1157 B1 | 20 38 41.0 | I | 0.60(0.03) | 0.69(0.08) | 3.82(0.24) | 0.17 |
| 67 50 33 | I | 0.12(0.01) | 0.75(0.01) | 0.37(0.03) | 0.31 | |
| II | 1.61(0.09)1 | 0.18(0.15) | 5.19(0.33) | 0.29 | ||
| III | 4.61(0.07)1 | 0.10(0.04) | 4.81(0.09) | 0.90 | ||
| L1157 B2 | 20 38 42.2 | I | 0.61(0.09) | 0.04(0.38) | 5.29(0.43) | 0.11 |
| 67 50 03 | I | 0.28(0.11)2 | 1.53(0.14) | 2.17(0.49) | 0.12 | |
| I | 0.04(0.01)2 | 0.72(0.03) | 0.36(0.08) | 0.11 |
1–the line has a non gaussian profile, but the division into 2 or more components is unreliable.
2–marginal detection
There are other regions where Class I masers are located so far from objects and bipolar outflow centers that the angular distances between the masers and these objects would be larger than , if the distances to these sources were no more than 200–500 pc. For example, the maser spots in W 33Met are 0.7 pc away from the nearest known IR object, which would correspond to offset, if the distance to the source were 500 pc. However, there are regions where the offsets of methanol masers from objects or bipolar outflow centers are small. For instance, the maser in M8E is located only 0.02 pc away from the center of a bipolar outflow [8], which, even at a distance as small as 200 pc, would correspond to an offset of only . The Class I maser GGD 27 within the errors coincides spatially with the center of a bipolar outflow [7]. Therefore it is unlikely that Bachiller et al. [2] and Kalenskii et al. [3] failed to detect any maser towards low-mass stars only because they observed mostly objects; probably, the sensitivity of these surveys also was insufficient.
| Source | FWHM | |||||
|---|---|---|---|---|---|---|
| (K) | (K) | (K) | (K) | (km s-1) | (km s-1) | |
| NGC 1333IRAS2 | 0.45(0.03) | 0.42(0.02) | 0.15(0.02) | 0.06 | 9.51(0.14) | 5.56(0.16) |
| 0.30(0.03) | 0.41(0.03) | 0.09 | 7.53(0.05) | 1.42(0.06) | ||
| NGC 1333IRS4A | 0.25(0.05) | 0.37(0.05) | 0.09(0.04) | 0.10 | 6.22(0.29) | 5.31(0.37) |
| 0.79(0.07) | 1.04(0.07) | 0.20 | 7.69(0.03) | 1.14(0.04) | ||
| NGC 1333IRS4B | 0.58(0.07) | 0.90(0.09) | 0.21 | 7.74(0.07) | 1.24(0.07) | |
| HH 25MMS | 0.51(0.02) | 0.76(0.03) | 0.13(0.02) | 0.06 | 10.25(0.05) | 3.56(0.07) |
| L1157 B1 | 0.75(0.02) | 1.10(0.02) | 0.28(0.02) | 0.06 | 0.43(0.05) | 5.00(0.05) |
| L1157 B2 | 0.55(0.02) | 0.75(0.02) | 0.17(0.02) | 0.06 | 1.30(0.06) | 4.00(0.07) |
The detection of methanol masers in relatively nearby sources could be very important for the maser exploration. Therefore we observed several nearby bipolar outflows from low-mass stars in the line at 7 mm, as well as in the 3mm wave range222The observations at 3mm are part of a more extended survey; the results of this survey will be published elsewhere., in the , line, and in the series of lines. The lines of this series are purely thermal and never exhibit maser emission. Several objects with enhanced abundance of methanol were selected from the literature as target sources.
Observations
The observations were performed with the 20-m radio telescope at Onsala (Sweden). The line frequencies and strengths and the main parameters of the telescope are presented in Table 1. A dual beam switching mode with a frequency of 2 Hz and a beam throw of was applied. Pointing errors were checked using observations of SiO masers and found to be within . The data were calibrated using a chopper-wheel method. Data were reduced with the CLASS package. The line rest frequencies were taken from Lovas’ database333http://physics.nist.gov/cgi-bin/micro/table5/start.pl.
Observations in the line were carried out on December 6–9, 2004. The main beam efficiency was about 0.5 for elevations lower than and about 0.56 for elevations higher than . The half-power beamwidth was . The system noise temperature corrected for atmospheric absorption, rearward spillower, and radome losses varied between 180 and 400 K. An autocorrelator with a 12.5 kHz (0.085 km s-1 at 44 GHz) resolution was used as spectrometer.
Observations in the 3mm wave range were carried out in May 2001. The main beam efficiency and the half-power beamwidth at 84.5 GHz were 0.6 and , respectively. A cryogenically cooled low-noise SIS mixer was used. The system noise temperature corrected for atmospheric absorption, rearward spillower, and radome losses varied between 300 and 1000 K. The backend consisted of an autocorrelator with a 50 kHz resolution (0.177 km s-1 at 84.5 GHz); in parallel, a 256-channel filter spectrometer with a 250 kHz resolution (0.887 km s-1) was connected.
Results
The results are presented in Figures 1 and 2 and in Tables 2 and 3. Emission at 7 mm was detected in all six observed regions. Narrow features were found towards NGC 1333IRAS4A, HH 25MMS, and L1157 B1. Antenna temperatures of the detected lines do not exceed 0.52 K, which corresponds to a flux density of 10.7 Jy. Thus, the detected lines are much weaker than strong maser lines in massive star-forming regions, which have flux densities up to several hundred Janskys. In addition, the flux densities of the detected lines are approximately equal to or lower than the upper limits on flux density in the surveys by Bachiller et al. [2] and Kalenskii et al. [3]. Thus, the fact that Bachiller et al. and Kalenskii et al. did not find any methanol maser in the line may be either fully or partly explained by insufficient sensitivity of these surveys.

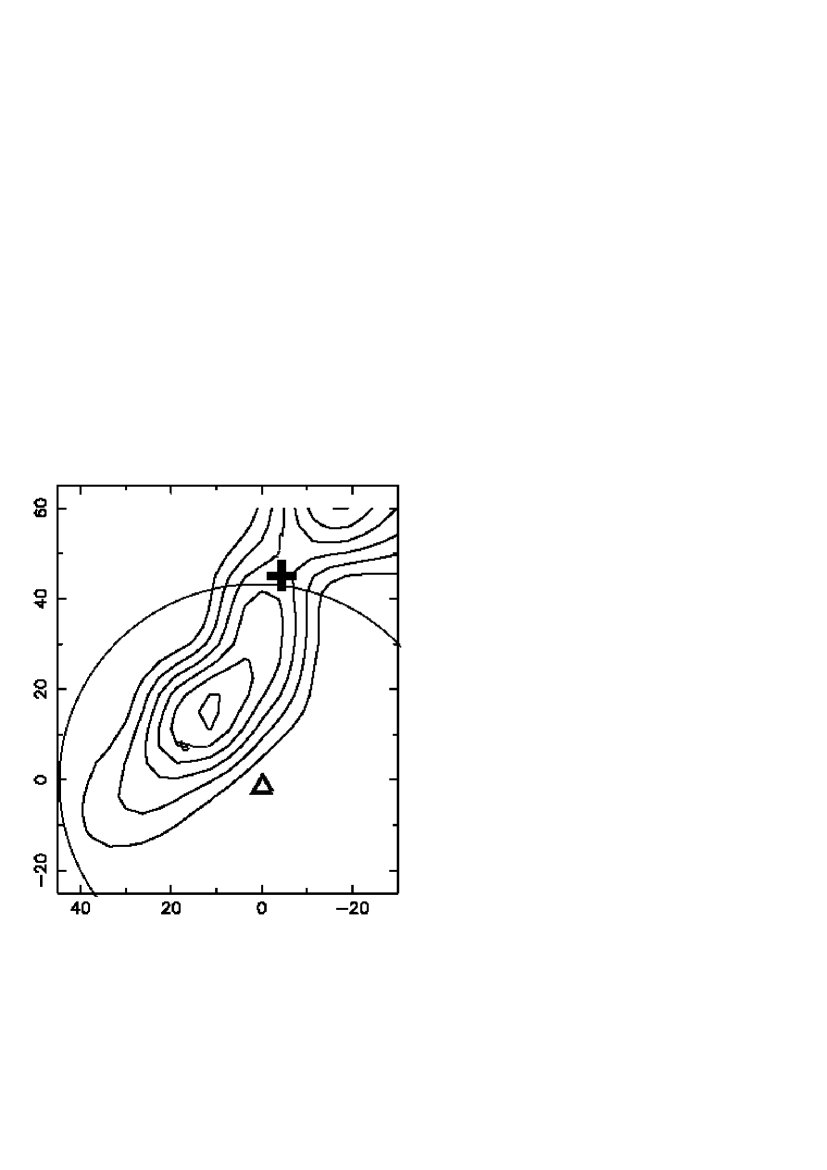
We observed several regions in the molecular cloud NGC 1333, where low-to-intermediate-mass stars actively form. A narrow feature at 44 GHz was detected towards the infrared source IRAS4A. Figure 3 shows that both the central source and peaks of CO emission in the red and blue wings of the outflow fall into the antenna beam. Therefore without additional observations with high spatial resolution we cannot determine to which of these objects the narrow features are related. Blake et al. [9] found that the abundances of CS, SiO, and CH3OH in this direction are enhanced due to grain mantle evaporation. In the same direction at 84 and 95 GHz we detected features, which are broader than the narrow feature at 44 GHz, but narrower than the thermal lines at 96 GHz (Fig. 1); probably, these features are masers with the absolute values of optical thickness and hence, line narrowing, less than those at 44 GHz.
Narrow lines at 44 and 95 GHz were detected towards the red wing of a bipolar outflow in the dark cloud L1630 with the central source HH 25MMS, located south of the IR source (Fig. 4). A broad line was found at 84 GHz. Its width is close to those of the thermal lines . A high abundance of methanol in this direction was detected by Gibb and Davis [10].

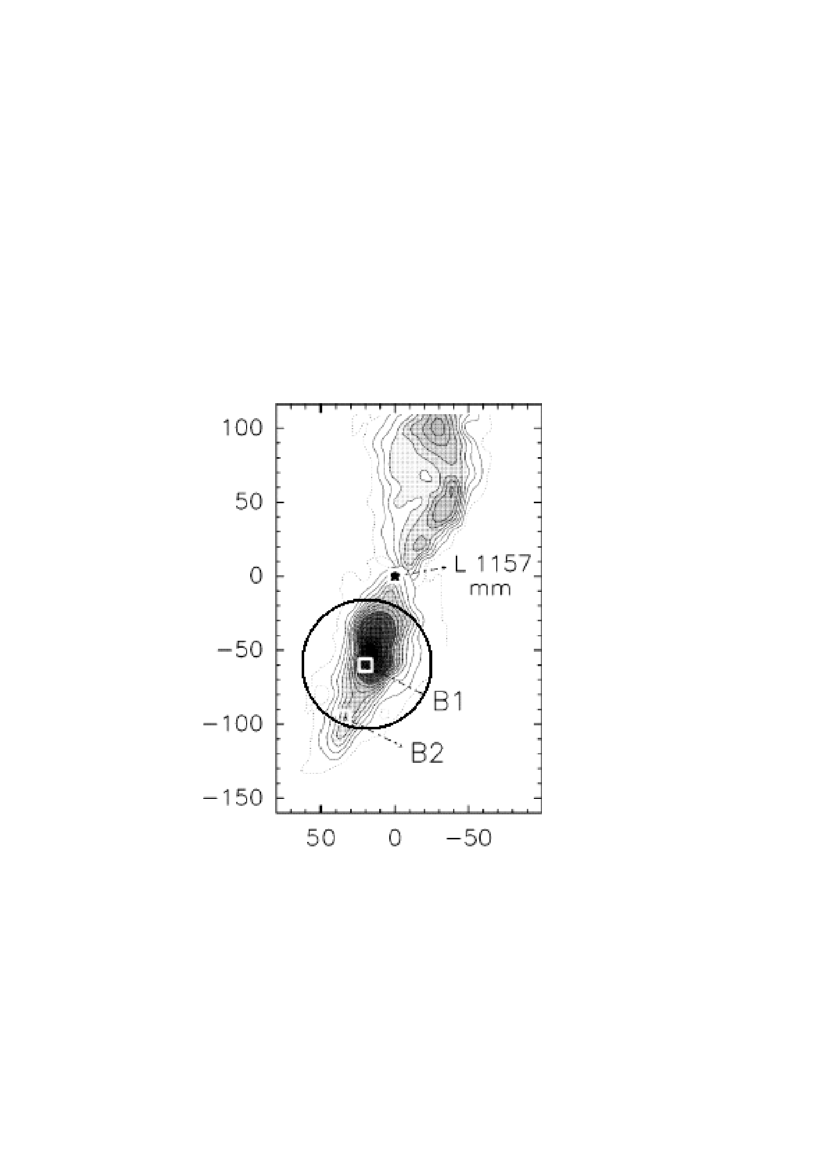
A narrow feature at 44 GHz is also found towards the region B1 in the blue wing of the bipolar outflow, driven by a class 0 object (according to the Andre et al [11] classification) L1157-mm in the molecular cloud L1157 (Fig. 5). The abundances of methanol, ammonia, and a number of other molecules are enhanced in B1 due to grain mantle evaporation [12]. Only broad quasithermal lines were detected towards this region both at 84 and 95 GHz (Fig. 1).

In the region B2, about offset from B1 (Fig. 5), the narrow feature at 7mm is very weak; moreover, its radial velocity is the same as that of the narrow feature in B1. Probably, there are no narrow lines, related to B2, and it is the narrow feature related to B1 that fell into the antenna beam since its width is as large as 82 arcsec444We cannot check this suggestion using the ratio of observed intensities of the narrow features in B1 and B2, since the accurate position of the source, observed in B1 is unknown..
Discussion
Typical widths of thermal lines towards regions of high-mass star formation are about 3–5 km s-1 or higher. Therefore a feature that was detected in a ”maser” transition and is narrower than 1 km s-1 can be considered a maser without any additional justification. The situation in regions of low-to-intermediate mass star formation is different. Widths of thermal lines of quiescent gas in these regions are often 0.2–0.3 km s-1 or less. Therefore the fact that the detected line is narrow does not necessarily mean that the line is a maser. Additional interferometric observations for measuring the line brightness temperature are necessary.
An essential argument in favor of maser origin of the detected narrow features is the fact that these features are found in the transitions and with the temperatures of upper level excitation equal to 65 K and 84 K, respectively. The kinetic temperature of quiescent gas in these regions is about 10–20 K; therefore thermal excitation of these transitions in quiescent gas is unlikely. These levels may be thermally excited in the gas, heated and accelerated by shocks; however, the width of thermal lines, arising in such gas, vary within the range from several km s-1 to several dozen km s-1.
In order to quantitatively verify this argument we modeled the narrow features, found in NGC 1333IRAS4A, HH 25MMS, and L1157B1. For this purpose, we computed a grid of LVG models spanning the ranges 10–200 K in temperature, cm-3 in density, and cm-3/(km s-1/pc) in methanol density divided by the velocity gradient. We utilized the collisional decay rates for methanol, obtained by Pottage et al. [13] as a result of quantum mechanical calculations. The agreement between the models and observational data was estimated from the criterion. The values of were calculated from the formula:
| (1) |
where and are the observed and model flux density ratios for the narrow features in the , , and lines, and are the errors of the observed ratios. For HH 25MMS, we found that a number of models with and cm cm-3 satisfactorily reproduce the observed ratios. In all suitable models the , , and lines proved to be inverted with the absolute values of optical thickness of the and lines of the order of or higher than 3, and those of the line of the order of or higher than 5. The brightness temperature of the and lines in the suitable models vary from several hundred to several thousand Kelvins, and that of the line is higher than 1000 K.
In the case of NGC 1333IRAS4A, agreement was obtained for a number of models with K and cm cm-3. The , , and lines again proved to be inverted in all suitable models. The absolute value of the optical thickness of these lines varies within the range 3–5, and the brightness temperature varies from several hundred to several thousand Kelvins.
We failed to find any suitable model for L1157B1, since the intensities at 84 and 95 GHz that correspond to the intensity of the narrow feature at 44 GHz are above the upper limits presented in Table 2 in all computed models. There are several explanations for this inconsistency within the frames of maser hypothesis. For example, Sobolev et al. [14] suggested that compact masers arise in turbulent media from the fact that in a turbulent velocity field the coherence lengths along some directions are larger than the mean coherence length. If the masers are unsaturated, the intensity of maser emission is proportional to , where is the optical thickness along the direction. In the first approximation one can consider that the LVG modeling yields the opacity that is averaged over all directions and the ”mean” line brightness that corresponds to this opacity. The larger the mean line opacity the higher the ratio of the maximum brightness to the mean brightness. Consider an example, when the coherence length along some direction is twice its mean value. If the mean opacity equals , which corresponds to the typical opacity of the line, obtained as a result of the modeling of HH 25MMS, then the ratio of the peak opacity to the mean opacity equals 2, and the peak opacity equals . The ratio of the peak brightness temperature (i.e. the brightness temperature of the maser spot) to the mean brightness temperature (i.e. to the model brightness temperature) equals . When the mean opacity equals , which corresponds to the typical opacities of the and lines, the ratio of the brightness temperature of the maser spot to the model brightness temperature equals . Thus, in the current example the ratio of the brightness temperatures of maser spots in the and lines to that of the line is less than the model ratio of the intensities of these lines by a factor 7.5. This difference is sufficiently large to explain the nondetection of maser features in the and lines in L1157B1. The increase of the scattering of coherence lengths may lead to much greater difference between the observed and model ratios of line intensities.

It is interesting that towards the region B2, located from B1, Kalenskii et al. [4] observed in 2000 narrow features at 95, and probably at 84 GHz, whereas in 2004 we found at 7mm towards this region only a very weak narrow feature; moreover, this feature may be related to B1 rather than to B2 (see above). As far as the authors know, no Class I maser sources with the emission at 44 GHz stronger than that at 84 and 95 GHz have been found so far. Probably, Kalenskii et al. observed a variable maser, whose intensity had essentially decreased by December 2004. Variability of at least two Class I maser sources, W3(OH) and G11.94-0.62, have been noted by Kurtz et al. [15]. Another possible explanation lies in the assumption that the maser at 44 GHz is linearly polarized and, during the observations in 2004, its polarization plane was orthogonal to that of the receiver. Linear polarization of the masers has not been measured so far; however, linear polarization has been detected by Wiesemeyer et al. [16] in the , , and lines, the degree of the polarization in the line being as large as 33%–39%. Probably, the degree of the polarization in the stronger line is the same or even higher and may strongly affect the measured flux density.
Interestingly, the radial velocities of maser features virtually coincide with the radial velocities of the peaks of thermal lines , which, in turn, are close to the radial velocities of the quiescent gas. Gueth et al. [17, 18] performed interferometric observations of L1157 in CO and SiO lines. They revealed hollow shells and related these shells to shock waves. One can reasonably suggest that enhancement of methanol abundance also occur in these shells. The brightest masers must arise in the directions with the maximum opacity, i.e. along the walls, and therefore must be observed towards the positions indicated in Figure 6. Since the gas parameters apparently vary with position, the maser region must occupy only a small part of the shell. Since the outflow axis is virtually perpendicular to the direction towards the observer, the radial velocity of maser emission must be close to the radial velocity of the molecular cloud. This model, as well as the aforementioned turbulent model, suggests a preferential increase of brightness of the most intense lines with respect to the brightness ratios for different lines, obtained for a uniform source of the same temperature and density. In order to test this model one should perform interferometric observations at 44 GHz, first, of L1157, and to compare the results with already available interferometric maps in other molecular lines.
Thus, further interferometric observations are necessary both in order to test whether the detected narrow lines are actually masers and to choose between different maser models. The detection of Class I methanol masers in relatively nearby regions of low-mass star formation may have a strong impact on the exploration of these masers. The regions of low-mass star formation are in the whole much closer to the Sun and much better studied than massive star-forming regions. Therefore it is much easier to identify the observed masers with other objects (e.g. with the wings of bipolar outflows) than when observing regions of high-mass star formation.
Conclusion
As a result of a short survey of bipolar outflows driven by low-mass young stars in the methanol lines , , and we detected narrow features towards NGC 1333IRAS4A, HH 25MMS, and L1157 B1. Flux densities of these features are no higher than 11 Jy, which is much lower than the flux densities of strong maser lines in regions of high-mass star formation. Nevertheless, most likely the narrow features are masers. In order to confirm this suggestion further interferometric observations are required; in addition, these observations may help to make a choice between different maser models.
Acknowledgements The authors are grateful to the staff of Onsala Space Observatory for help during the observations. The work was performed under partial financial support from the Russian Foundation for Basic Research (grants Nos. 01-02-16902 and 04-02-17057) and the RAS Scientific Research Program ”Extended Sources in the Universe”. Onsala Space Observatory is the Swedish National Facility for Radio Astronomy and is operated by Chalmers University of Technology, Göteborg, Sweden, with financial support from the Swedish Research Council and the Swedish Board for Technical Development.
References
- [1] K. M. Menten, in: Proceedings of the 3rd Haystack Observatory Meeting ”Skylines,” Ed. by A. D. Haschick and P. T. P. Ho, Astron. Soc. Pac. Conf. Ser. 16, 119 (1991);
- [2] R. Bachiller, K.M. Menten, J. Gomez-Gonzalez, and A. Barcia, Astron. Astrophys. 240, 116 (1990);
- [3] S. V. Kalenskii, R. Bachiller, I. I. Berulis et al., Sov. Astron. 36, 517 (1992)
- [4] S. V. Kalenskii, V. I. Slysh, I. E. Val’tts, et al., Astron. Rep. 45, 26 (2001)
- [5] R. L. Plambeck and K. M. Menten, Astrophys. J. 364, 555 (1990);
- [6] R. M. Lees, F. J. Lovas, W. H. Kirchhoff, D. R. Johnson, J. Phys. Chem. Ref. Data, 2, 205 (1973);
- [7] V. I. Slysh, I. E. Val’tts, S. V. Kalenskii, and V. V. Golubev, Astron. Rep. 43, 785 (1999);
- [8] I. E. Val’tts, Astron. Rep. 43, 148 (1999);
- [9] G. A. Blake, G. Sandell, E. F. van Dishoeck, et al., Astrophys. J. 441, 689 (1995);
- [10] A. G. Gibb and C. J. Davis, Mon. Not. R. Astr. Soc. 298, 644 (1998);
- [11] P. Andre, D. Ward-Thompson, M. Barsony, Astrophys. J. 406, 122 (1993);
- [12] R. Bachiller and M. Pérez Gutiérrez, Astrophys. J. 487, L93 (1997);
- [13] J. T. Pottage, D. R. Flower, and S. L. Davis, J. Phys. B 37, 165 (2004);
- [14] A. M. Sobolev, W. D. Watson, and V. A. Okorokov, Astrophys. J. 590, 333 (2003);
- [15] S. Kurtz, P. Hofner, and C. V. Alvarez, Astrophys. J. Suppl. 155, 149 (2004);
- [16] H. Wiesemeyer, C. Thum, and C. M. Walmsley, Astron. Astrophys. 428, 479 (2004);
- [17] F. Gueth, S. Guilloteau, and R. Bachiller, Astron. Astrophys. 307, 891 (1996);
- [18] F. Gueth, S. Guilloteau, and R. Bachiller, Astron. Astrophys. 333, 287 (1998);