W Hya through the eye of Odin ††thanks: Based on observations with Odin, a Swedish-led satellite project funded jointly by the Swedish National Space Board (SNSB), the Canadian Space Agency (CSA), the National Technology Agency of Finland (Tekes), and Centre National d’Études Spatiales (CNES). The Swedish Space Corporation was the industrial prime contractor and is operating Odin.
We present Odin observations of the AGB star W Hya in the ground-state transition of ortho-H2O, 1, at 557 GHz. The line is clearly of circumstellar origin. Radiative transfer modelling of the water lines observed by Odin and ISO results in a mass-loss rate of (2.50.5) 10-7 M⊙ yr-1, and a circumstellar H2O abundance of (2.01.0) 10-3. The inferred mass-loss rate is consistent with that obtained from modelling the circumstellar CO radio line emission, and also with that obtained from the dust emission modelling combined with a dynamical model for the outflow. The very high water abundance, higher than the cosmic oxygen abundance, can be explained by invoking an injection of excess water from evaporating icy bodies in the system. The required extra mass of water is quite small, on the order of 0.1 M⊕.
Key Words.:
Stars: circumstellar matter – Stars: evolution – Stars: individual : W Hya – Stars: late-type – Stars: mass-loss – Infrared:stars1 Introduction
One of the main characteristics of an Asymptotic Giant Branch (AGB) star is its cool, low-velocity outflow. In this outflow, molecules are formed according to the relative chemical abundance of carbon and oxygen (Olofsson olof03 (2003); Millar millar (2003) and the references therein). In addition to H2, CO is an abundant species irrespective of the C/O ratio, but in C/O 1 (O-rich) objects its abundance is rivaled by that of H2O, while in C/O 1 (C-rich) objects HCN and C2H2 also have sizable abundances. Likewise, there are dust signatures of amorphous carbon and SiC when C/O is larger than unity, (Treffers & Cohen treffers (1974)) while silicates are seen if the reverse is the case (Gilman gilman (1969)).
Early AGB stars tend to be semiregular variables with a low mass-loss rate, and these evolve into long-period Mira-type variables where mass loss is more pronounced. The lifetime of a mass-losing AGB star is estimated to be about 105 yr, and before evolving off the AGB the star undergoes an intense epoch of mass loss when most of the initial mass is lost, leaving behind a hot C/O core which then ionizes the surrounding material resulting in a planetary nebula (see e.g., Iben & Renzini iben (1993); Habing habing (1996)).
In this paper we discuss circumstellar H2O observations of the well-studied O-rich semiregular variable W Hya, with a period of 382 days (Lebzelter et al. leb (2000)). It has been detected in a number of circumstellar molecular line emissions, e.g., CO (Wannier & Sahai wannier (1986); Loup et al. loup (1993); Cernicharo et al. cerni (1997); Kerschbuam & Olofsson franz (1999)), SiO maser (Pardo et al. pardo (2004)) and OH maser lines (Szymczak et al. szym (1998); Chapman et al. chapman (1994); Etoka et al. etoka (2003)). It was also detected in water lines using the Infrared Space Observatory’s (ISO) Short- and Long Wavelength Spectrometers (SWS and LWS) by Neufeld et al. (neufeld (1996)) and Barlow et al. (barlow (1996)), respectively. Recently, the Submillimeter Wave Astronomy Satellite (SWAS) detected the ground-state ortho-H2O transition at 557 GHz, 1, as reported by Harwit & Bergin (harwit (2002)).
O-rich semiregular variable stars are seen to have multiple dust species condensing in their outflows (Cami cami (2002)). The 10m silicate feature, dominant in the spectra of Mira variables, may not be the strongest emission feature. This is clearly seen in the spectral energy distribution (SED) of W Hya. By fitting the SED with multiple dust species, Justtanont et al. (kay04 (2004)) derived a dust mass-loss rate of 3 10-10 M⊙ yr-1 (this is a lower limit as the 13m dust feature was not fitted due to the lack of a suitable identification). This suggests that W Hya is a low-mass-loss-rate AGB star. However, its dust envelope is known to be very large, extending out to 40′ (Hawkins hawkins (1990)).
2 Observations
The spectrum of the H2O (1) line at 557 GHz ( = 538.29m) was observed by the Odin satellite towards W Hya using the autocorrelation spectrometer (Nordh et al. nordh (2003); Frisk et al. frisk (2003)). The resulting spectrum is a combination of two separate observing sessions, in December 2002 and July 2003, of a total of 185 orbits. As the position-switching mode was used in these observations, the on-source integration time is 53.4 hours. The average system temperature for this frequency is 3 200 K. The calibration was done by switching between the internal hot load and the sky. The frequency resolution is 1 MHz (= 0.54 km s-1 at 557 GHz). A sinusoidal baseline was subtracted and the data rebinned. Fig. 1 shows the spectrum in terms of the observed antenna temperature, , which has not been corrected for the beam efficiency of 90%.
The peak antenna temperature is 0.05 0.02 K. The line flux is estimated to be (3.61.2) 10-21 W cm-2, after correcting for the aperture efficiency of 70% (Frisk et al. frisk (2003)). The absolute uncertainty in the line flux is large as the data are noisy, and close to the line there are features which are the artefacts caused by the ends and the joining of two correlator bands. These are seen as absorption features at VLSR of 4, 23 and 30 km s-1 (Fig 1). The estimated uncertainty includes that due to the noise and the sinusoidal baseline subtraction, plus an absolute flux calibration uncertainty of 10%. The latter is obtained by comparing the line fluxes of Odin and SWAS data for a number of sources (Hjalmarson et al. ake (2003)). The line intensity is consistent with that obtained by SWAS after scaling the latter with the ratio of the Odin and SWAS beam sizes, 3.37 (Hjalmarson et al. ake (2003)).
The centre velocity and the expansion velocity are estimated to be 42 1.5 km s-1 (LSR scale) and 7.0 1.0 km s-1, respectively. These values are consistent with the results from CO J=1–0 data (Kerschbaum & Olofsson franz (1999)), J=2–1 data (Cernicharo et al. cerni (1997)), J=3–2 and 4–3 data (Young young (1995)).

3 Modelling of the molecular line emission
In this section, we present our models for both the H2O and CO line emission from the circumstellar envelope of W Hya. The models used are based on the assumptions of a constant, isotropic mass-loss rate, and a constant expansion velocity, which results in a spherically symmetric gas outflow with an density distribution. The mass-loss rate refers to the H2 loss rate which is the quantity used throughout this paper. This value needs to be multiplied by a factor of 1.4 to get the total gas mass-loss rate, due mainly to the presence of He.
In order to model the radiative transfer, we need to know the stellar luminosity. From the spectral energy distribution (SED), the peak of the spectrum corresponds to an effective temperature of 2 500 K (Justtanont et al. kay04 (2004)), which agrees well with that derived by Haniff et al. (haniff (1995)). The Hipparcos distance, taken directly from the Hipparcos Catalogue (ESA esa (1997)) parallax, is 115 pc. The derived luminosity for this distance turns out to be very high – 1.16 104 L⊙ (estimated from a fit to the SED). However, the Hipparcos data were reanalysed by Knapp et al. (knapp (2003)). The revised distance of 78 pc, results in a luminosity of 5 400 L⊙, more in line with it being an early-AGB star. The resulting radius is 2.73 1013 cm. From this point on, we will assume a distance of 78 pc for our calculations.
3.1 CO lines
The code used to calculate the CO line emission is based on the work by Schöier & Olofsson (fredrik (2001)). It employs the Monte-Carlo method to determine the excitation in the lowest 40 rotational levels in the ground and first excited vibrational states. The collisional rates are taken from the CO-H2 rates by Flower (flower (2001)), and extrapolated to higher rotational levels and temperatures as described in Schöier et al. (schoeier05 (2005))111The molecular datafile is available for download at www.strw.leidenuniv.nl/moldata.. The rates for ortho- and para-H2 collisions are weighted assuming an ortho/para ratio of three. The outer radius is defined by the photodissociation of CO, and it is obtained following the results of Mamon et al. (mamon (1988)). In order to convert the CO gas mass-loss rate to the total gas mass-loss rate, we assume a CO abundance, [CO]/[H2], of 2 10-4.
In the fitting of observed line fluxes of CO J=1–0 up to 4–3, along with the ISO-LWS J=16–15 and 17–16 lines, the gas kinetic temperature is calculated with a dust-drag heating balanced by the adiabatic and radiative cooling. The radiative cooling is provided by both CO and H2O molecules. The dust parameters entering in the heating term, due to collisions between dust and gas particles, are taken to be consistent with those obtained from the dust modelling. In the case of a low-mass-loss-rate object such as W Hya, the CO molecules are mainly excited by the stellar radiation field and the temperature structure plays only a minor role (Schöier & Olofsson fredrik (2001)). A best-fit model is obtained in terms of integrated line intensities and in the sense,
| (1) |
where is the total integrated line intensity, is the uncertainty in observation , and the summation is done over all independent observations . The errors in the observed radio line intensities are assumed to be 20%, while the ISO lines have an uncertainty of 30%. The result is a stellar mass-loss rate of 1.3 10-7 M⊙ yr-1.
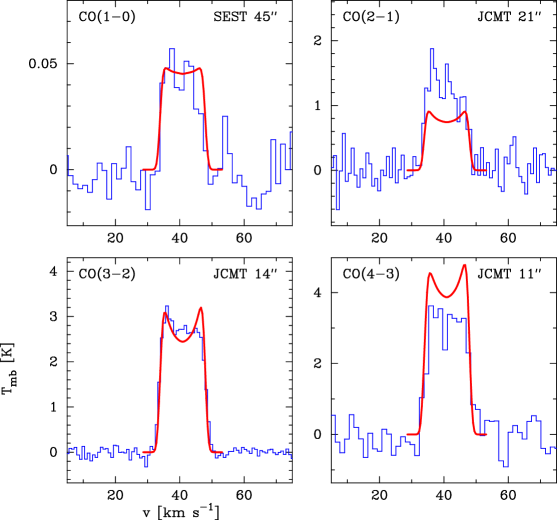
Although our calculated line fluxes are close to the observed, the line profiles do not match. We consistently expect to see double-peaked profiles while the observations tell us otherwise. A way to remedy this is to decrease the envelope size and increase the input mass-loss rate. A mass-loss rate of 1.3 10-7 M⊙ yr-1 results in a CO photodissociation radius of 1.4 1016 cm according to Mamon et al. (mamon (1988)). However, our best-fit model, taking into account also the line shapes, has an outer CO radius of 8 1015 cm with a mass-loss rate of 2 10-7 M⊙ yr-1. The results of the best-fit model are shown in Fig. 2 and the line fluxes are listed in Table LABEL:tab_co. The uncertainty in the mass-loss rate from fitting the line profile is of the order of 50% within the adopted circumstellar model (see Schöier & Olofsson fredrik (2001)). The final model also gives the LSR velocity for W Hya as 40.7 km s-1, and an envelope gas expansion velocity of 7.0 km s-1. These values are consistent with those derived from the Odin H2O data.
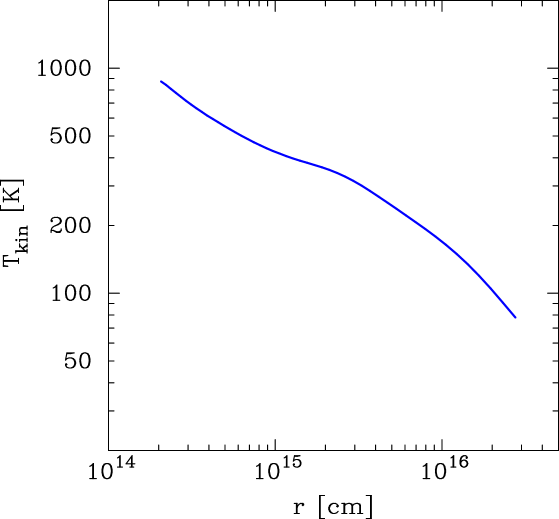
The final kinetic temperature profile is shown in Fig. 3. We note that our derived temperature is between 100–150 K higher than that obtained by Zubko & Elitzur (zubko (2000)) in the region where the H2O molecules are located ( cm). This is not inconsistent considering our lower mass-loss rate.
| Transition | Instr. | Observed flux | Model flux | Ref |
|---|---|---|---|---|
| 1-0 | SEST | 0.82 | 0.66 | a |
| 2-1 | JCMT | 18.7 | 11.8 | b |
| 2-1 | IRAM | 22.0 | 26.2 | c |
| 3-2 | JCMT | 40.2 | 39.8 | d |
| 3-2 | CSO | 29.0 | 22.7 | e |
| 4-3 | JCMT | 44.6 | 60.8 | b |
| 4-3 | CSO | 40.0 | 34.8 | e |
| 16-15 | LWS | 3.3 10-20 | 2.4 10-20 | f |
| 17-16 | LWS | 2.3 10-20 | 2.4 10-20 | f |
3.2 H2O lines
We model the water lines observed by Odin, ISO-SWS (Neufeld et al. neufeld (1996)), and ISO-LWS (Barlow et al. barlow (1996)). The code used for this differs from the code used for CO. The main reason for a different treatment is the extremely high optical depths in the water lines preventing the convergence of the Monte-Carlo calculation. The technique employed here is the accelerated lambda iteration (Rybicki & Hummer rybicki (1991)), which is used to calculate the excitation in the 45 lowest rotational levels of ortho- and para-H2O.
We use the collisional rates calculated for H2O and He (Green et al. green (1993)), with a scaling factor of 1.4 to correct for the mass difference between H2 and He. However, a more recent calculation for the collision between H2O and ortho- and para-H2 by Phillips et al. (phillips (1996)) suggests that adopting the collisional rate with He and using the simple scaling factor can give very different rates. Unfortunately, the collisional rates with H2 were calculated up to 140 K, while the temperature in the circumstellar envelope of an AGB star can be up to 1 000 K. If the H2O–He rate is underestimated by a large factor, it may have a repercussion on the calculated line fluxes as the water lines are sub-thermally excited in the envelope of W Hya.
The envelope gas expansion velocity, and the kinetic temperature law used are those obtained from the CO line modelling. The outer radius of the water molecules is taken from the measurements of the OH masers by Szymczak et al. (szym (1998)), who give an outer OH shell radius of 1.3′′, i.e., 1.5 1015 cm at the assumed distance.
The mass-loss rate and the ortho-H2O abundance are free parameters in the fitting procedure where the integrated line intensities of the Odin and ISO lines are used as observational constraints to find the best-fit model in the sense. The observed integrated line intensities and their uncertainties are given in Table LABEL:tab:models. We obtained ISO fluxes by fitting a Gaussian to archived data with the latest calibration file (OLP version 10), rather than using the line fluxes from Barlow et al. (barlow (1996)) and Neufeld et al. (neufeld (1996)). The error in the observed flux reflects only the estimation of the baseline and does not include possible systematic error or that of the absolute flux.
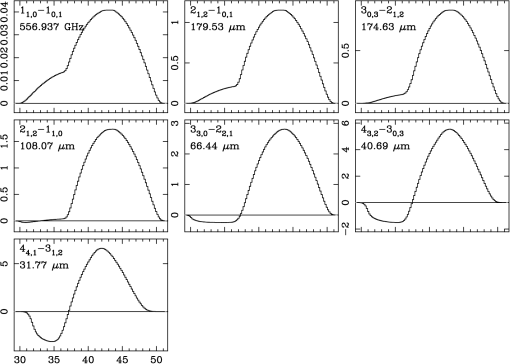
The results of the line emission modelling are given in Fig. 4 in terms of the minimum for a given combination of ortho-H2O abundance and mass-loss rate. Clearly, the circumstellar H2O line emission suggests a relatively low mass-loss rate. Using a 1 uncertainty we infer a mass-loss rate of (2.50.5) 10-7 M⊙ yr-1, and an ortho-H2O abundance of (1.00.4) 10-3. The best-fit model line profile for the Odin 557 GHz line is presented in Fig. 5, superimposed on the observed spectrum. The resulting Odin and ISO lines are shown in Fig. 6 although at a much higher spectral resolution than achieved by ISO.


| (m) | Instr. | Line flux ( W cm-2) | |
|---|---|---|---|
| Obs | Mod | ||
| 538.29 | Odin | 0.360.1 | 0.45 |
| 179.53a | LWS | 10.31.7 | 11.6 |
| 174.63a | LWS | 11.91.2 | 8.33 |
| 108.07a | LWS | 22.84.0 | 15.3 |
| 66.44a | LWS | 32.712.1 | 21.5 |
| 40.69b | SWS | 23.45.3 | 32.6 |
| 31.77b | SWS | 36.33.7 | 31.1 |
We have also modelled the para-water lines present in the ISO spectrum. Since the ortho- and para-water molecules do not interact with each other, they can be modelled independently. In order to fit these lines for the mass-loss rate derived above, the required para-water abundance is 1.1 10-3 (with an estimated uncertainty similar to that of the ortho-H2O abundance), The ortho-to-para ratio is close to unity, in agreement with that reported by Barlow et al. (barlow (1996)). This ratio is expected to be three when considering newly formed H2 on the grain surface at high temperature (Tielens & Allamandola tielens (1987)). The ratio drops to zero for a cold gas.
The total (ortho + para) water abundance according to this analysis, consistent with the observed intensities, is therefore (2.01.0) 10-3.
The marked increase in the value for higher mass-loss rates is primarily an effect of the increasing difficulty to fit the SWS lines. The model line fluxes are significantly lower than the observed ones due to the fact that the blue edge of the profile is in absorption, cancelling out the emission from the red side of the profile (see Fig 6). The absorption is not so pronounced in the low-mass-loss-rate model, hence the overall line fluxes agree more with the observations. It is unfortunate that the resolution of the ISO lines is not high enough for the lines to be resolved. It should be remarked here that the SWS lines come from the very inner region of the circumstellar envelope, and our modelling of these lines is more uncertain. Fitting only the LWS lines gives a weaker constraint on the combination of the mass-loss rate and water abundance.
We have also investigated the effect of the assumed radius of the water envelope by varying this with respect to that adopted from the OH maser data. By increasing the radius by a factor of three, the resulting line fluxes changed by less than 50% for our best-fit model. The line fluxes are primarily excitation limited and they depend only weakly on the adopted H2O envelope size. Netzer & Knapp (netzer (1987)) derived a size of the water envelope from a theoretical model of H2O photodissociation
| (2) |
where the mass-loss rate is given in M⊙ yr-1. We find that the radius obtained from the OH maser data is fully consistent with this relation for the mass-loss rate of 2.5 10-7 M⊙ yr-1 obtained from the H2O line flux fitting.
In our calculation, we did not include the effect of radiative excitation through the vibrational lines. W Hya has a deep H2O absorption band at 3 m, due to the stretching mode, as seen in the ISO SWS spectrum (Justtanont et al. kay04 (2004)). This band occurs close to the stellar photosphere ( K) and most likely a significant fraction of the stellar flux at the wavelengths of the vibrational lines is absorbed in it (Ryde et al. ryde (2002)). The detection of H2O maser emission from rotational lines in the vibrational state towards W Hya shows that radiative excitation to this state occurs (Menten & Melnick menten (1989)). Deguchi & Rieu (deguchi (1990)) found that vibrational radiative excitation plays a minor role when calculating the rotational line fluxes in the ground state. On the contrary, Troung-Bach et al. (tbach (1999)), in their study of the O-rich Mira variable R Cas, found that the ground-state line fluxes decreased by about a factor of two when radiative excitation through the vibrational state was removed. We believe that the uncertainty in the H2O abundance introduced by omitting radiative excitation through vibrational states is less than our estimated uncertainty from the line modelling. The effect is likely to lower the abundance somewhat. We note here that Truong-Bach et al. derive an H2O abundance for R Cas which is remarkably low (in terms of our modelling results), 1 10-5, considering that R Cas and W Hya have very similar mass-loss rates, luminosity, distances, and ISO line fluxes.
4 The mass-loss rate of W Hya
There is a large discrepancy when it comes to the determination of the mass-loss rate of W Hya as a wide range (two orders of magnitudes) of the mass-loss rate has been reported over the years. In this paper we have shown that the circumstellar CO radio lines suggest a low mass-loss rate, about 2 10-7 M⊙ yr-1. This result has a rather low uncertainty provided that the adopted circumstellar model and CO abundance (2 10-4) are correct. Our result is also consistent with those of Wannier & Sahai (wannier (1986)), Young (young (1995)), and Olofsson et al. (hans02 (2002)). Once these values are scaled to the same distance, velocity, and CO abundance, the range of the mass-loss rates is (5–20) 10-8 M⊙ yr-1.
Previous reports on the mass-loss rates derived from H2O line emission are based on ISO results. The mass-loss rate estimates range from as high as 10-5 (assumed distance 95 pc and SWS lines; Neufeld et al. neufeld (1996)) to 6 10-7 M⊙ yr-1 (assumed distance 130 pc and LWS lines; Barlow et al. barlow (1996)). Barlow et al. used a water abundance of 8 10-4 for cm and 3 10-4 beyond this radius. Neufeld et al. do not give their assumed water abundance, but it must have been low, according to our results (see Fig. 4). We find that the Odin and ISO H2O line intensities suggest a mass-loss rate of 2.5 10-7 M⊙ yr-1, a value fully consistent with our CO line modelling result.
The OH maser line data give some hints on the mass-loss rate. Recently, the 1612 MHz line was detected (Etoka et al. etoka (2003)), and it is substantially weaker than the main lines at 1665 and 1667 MHz. This is an indication of a low mass-loss rate (Szymczak & Engels szym2 (1998)). Likewise, as pointed out above, the measured size of the OH maser envelope is consistent with a low mass-loss rate.
Justtanont et al. (kay04 (2004)) derived a low dust mass-loss rate by fitting the SED. Using their derived dust mass-loss rate combined with a dynamical calculation of a dust-driven wind, we infer a total mass-loss rate of 1.4 10-7 M⊙ yr-1. This value is only a lower limit because the different dust components used in the SED modelling do not account for the 13m dust feature. Once the carrier is found for this feature and taken into account in the model, it is possible that the dust mass loss rate can increase by up to a factor of two. The indication from the dynamical calculation is W Hya has a relatively low mass-loss rate.
However, Zubko & Elitzur (zubko (2000)) reported a rather high mass-loss rate when combining SED modelling and a dynamical model for the outflow, 2.3 10-6 M⊙ yr-1 (at a distance of 115 pc). The high mass-loss rate is because the authors did not fit the 10m silicate feature which is the key in deriving the dust mass loss rate.
Based on these results we conclude that there is strong evidence that W Hya has a rather low mass-loss rate, of the order a few 10-7 M⊙ yr-1.
5 The circumstellar H2O abundance
In this work, we derive a consistent mass-loss rate from both the CO and H2O modelling of (2.50.5) 10-7 M⊙ yr-1. The observed line fluxes are reasonably well produced. Our derived water abundance for this mass-loss rate is exceptionally high, (2.01.0) 10-3. Additional uncertainties in this estimate are provided by the effects of radiative excitation through vibrational states, and the uncertain values for the collisional cross sections.
This derived total water abundance violates the limit set by the cosmic abundance of atomic oxygen. In the stellar equilibrium chemistry of an oxygen-rich environment, all the available carbon should be locked up in the form of CO, and the rest of the oxygen goes into the formation of H2O molecules, with a very small fraction bound into grains and other molecules. The cosmic abundance of Carbon and Oxygen relative to H is 3.6 10-4 and 8.5 10-4, respectively (Anders & Grevesse anders (1989)). Therefore, unless there is a separate influx of water from another source the water abundance relative to H2, = [H2O]/[H2], cannot exceed 10-3.
The extra water mass required to explain the abundance needed to model the observed water line emission is
| (3) |
where is the radius of the water shell, and the gas expansion velocity. The total extra mass needed is (6.13.0) 1026 g, i.e., (0.10.05) M⊕. This is considerably smaller than the estimated mass of water ice in the Solar System, assuming most of the present mass of water is bound in comets. The current estimate of the original mass of the Oort Cloud is highly uncertain and varies between 14–1 000 M⊕ (Bailey & Stagg bailey (1988); Weissman weissman (1991); Marochnik et al. maroch (1988)). We speculate that icy bodies can be either part of the disk (and planets) left over after the formation of the central star, or a remnant envelope of the original cloud from which the star formed, reminiscent of the Oort Cloud. The disk/envelope remained in stable orbits until the star ascended the AGB. Because of the much higher luminosity of the AGB star, compared to that in its main sequence phase, outgassing from icy bodies will contribute to the observed high water abundance. Of course, this requires a steady supply of new water, since photodissociation effectively destroys the water molecules on a short time scale. A similar hypothesis has been put forward to explain the presence of gaseous water around the carbon star IRC+10216 (Melnick et al. melnick (2001)).
6 Summary
Observations of the ground-state transition of ortho-water, 1, in the circumstellar envelope of W Hya were done using the Odin satellite. The line is centered at = 42 km s-1 and its width corresponds to a gas expansion velocity of about 7 km s-1. These results compare well with those of previous CO observations (e.g., Kerschbaum & Olofsson franz (1999)), as well as the new CO data presented in this paper. The line flux is (3.61.2) 10-21 W cm-2, consistent with the SWAS observation of the same line (Harwit & Bergin harwit (2002)).
To fit the Odin and ISO water lines, the ortho-water abundance and mass-loss rate are required to be (1.00.4) 10-3 and (2.51.0) 10-7 M⊙ yr-1, respectively. Similarly, the para-water abundance is estimated to be (1.10.8) 10-3 by fitting ISO lines. This mass-loss rate is consistent with that derived from our CO line modelling, as well as that obtained by combining SED modelling and a dynamical model of the outflow. From our calculation, we show that the line shapes of these water transitions are different. Unfortunately, from ISO, we have only the information on the line intensities. It is noted here that the Heterodyne Instrument for the Far-Infrared (HIFI) aboard the Herschel Observatory which will be launched around 2008 will have a much higher resolution which can resolve some of these ISO lines, thereby giving another constraint on the model parameters.
If the mass-loss rate for W Hya is as low as (2.50.5) 10-7 M⊙ yr-1, the total water abundance needed to explain the observed line fluxes is (2.01.0) 10-3. However, if we assume the cosmic abundance for carbon and oxygen, the maximum total water abundance, relative to H2, cannot be higher than 10-3. A way to reconcile the high total water abundance needed to model the H2O lines of W Hya is an extra injection of water in the system, possibly from evaporation of icy bodies, such as planets or comets. This is the suggested explanation for the detection of water in IRC+10216, the IR-brightest carbon-rich AGB star (Melnick et al. melnick (2001)). The excess H2O mass needed to explain the Odin and ISO observations in W Hya is small, of the order of (0.10.05) M⊕, compared to the estimate of the original mass of the Oort Cloud.
Acknowledgements.
This work is partly funded by the Swedish National Space Board. We wish to thank René Liseau and Göran Olofsson for fruitful discussions. Our research made use of the database SIMBAD.References
- (1) Anders E., & Grevesse N., 1989, Geochemica et Cosmochimica Acta 53, 197
- (2) Bailey M.E., & Stagg C.R., 1988 MNRAS 235, 1
- (3) Barlow M.J., Nguyen-Q-Rieu, Truong-Bach et al., 1996, A&A 315, L241
- (4) Cami J., 2002, PhD thesis, University of Leiden
- (5) Cernicharo J., Alcolea J., Baudry A., González-Alfonso E., 1997, A&A 319, 607
- (6) Chapman J.M., Sivagnanam P., Cohen R.J., Le Squeren A.M., 1994, MNRAS 268, 475
- (7) Deguchi T., & Rieu N.-Q., 1990, ApJ 360, L27
- (8) ESA, 1997, the Hipparcos and Tycho Catalogues, ESA SP-1200
- (9) Etoka S., Le Squeren A.M., Gerard E. 2003, A&A 403, L51
- (10) Flower D.R., 2001, J. Phys. B.: At. Mol. Opt. Phys. 34, 2731
- (11) Frisk U., Hagström M., Ala-Laurinaho J., et al., 2003, A&A 402, L27
- (12) Gilman R.C., 1969, ApJ 155, L185
- (13) Green S., Maluendes S., McLean A.D., 1993, ApJS 85, 181
- (14) Habing H.J., 1996, A&ARv 7, 97
- (15) Haniff C.A., Scholz M., Tuthill P.G., 1995, MNRAS 276, 640
- (16) Harwit M., & Bergin E.A., 2002, ApJ 565, L105
- (17) Hawkins G.W., 2000, A&A 229, L5
- (18) Hjalmarson Å, Frisk U., Olberg M., et al., 2003, A&A 402, L39
- (19) Iben Jr., I., &, Renzini A., 1983 Ann Rev A&A 21, 271
- (20) Justtanont K., de Jong T., Tielens A.G.G.M., Feuchtgruber H., Waters L.B.F.M., 2004, A&A 417, 625
- (21) Kerschbaum F., Olofsson H., 1999, A&AS 138, 299
- (22) Knapp G.R., Pourbaix D., Platais I., Jorissen A., 2003, A&A 403, 993
- (23) Lebzelter T., Kiss L.L., Hinkle K.H., 2000 A&A 361, 167
- (24) Loup C., Forveille T., Omont A., Paul J.F., 1993, A&AS 99, 291
- (25) Mamon G.A., Glassgold A.E., Huggins P.J., 1988 ApJ 328, 797
- (26) Marochnik L.S., Mukhim L.M., Sagdeev R.Z., 1988, Science 242, 547
- (27) Melnick G.J., Neufeld D.A., Ford K.E.S., Hollenbach D.J., Ashby M.L.N., 2001, Nature 412, 160
- (28) Menten K.M., Melnick G.J., 1989, ApJ 341, L91
- (29) Millar T.J.. 2003, in Asymptotic giant branch stars, Astronomy and astrophysics library, New York, Berlin: Springer, ed. H. J. Habing & H. Olofsson, p.248
- (30) Netzer N., & Knapp G.R., 1987, ApJ 323, 734
- (31) Neufeld D.A., Chen W., Melnick G.J. et al., 1996, A&A 315, L237
- (32) Nordh H.L., von Schéele F., Frisk U., et al. 2003, A&A 402, L21
- (33) Ohnaka K., 2004, A&A 424, 1011
- (34) Olofsson H. 2003, in Asymptotic giant branch stars, Astronomy and astrophysics library, New York, Berlin: Springer, ed. H. J. Habing & H. Olofsson, p.325
- (35) Olofsson H., González-Delgado D., Kerschbaum F., Schöier F. L., 2002, A&A 391, 1053
- (36) Pardo J.R., Alcolea J., Bujarrabal V., et al., 2004, A&A 424, 145
- (37) Phillips T.R., Maluendes S., Green S., 1996, ApJS 107, 467
- (38) Rybicki G.B., & Hummer D.G., 1991, A&A 245, 171
- (39) Ryde N., Lambert D. L., Richter M. J., Lacy J. H. 2002, ApJ 580, 447
- (40) Schöier F.L., & Olofsson H., 2001, A&A 368, 969
- (41) Schöier F.L., van der Tak F.F.S, van Dishoeck, E.F., Black J.H., 2005, A&A 432, 369
- (42) Szymczak M., Cohen R.J., Richards A.M.S., 1998, MNRAS 297, 1151
- (43) Szymczak M. & Engels D., 1995, A&A 296, 727
- (44) Tielens A.G.G.M., & Allamandola L.J, 1987, In Interstellar Processes, eds. D.J. Hollenbach, H.A. Thronson, Reidel, Dordrecht, p. 397
- (45) Treffers R, & Cohen M., 1974, ApJ 188, 545
- (46) Truong-Bach, Sylvester R.J., Barlow M.J., et al., 1999, A&A 345, 925
- (47) Wannier P.G., & Sahai R., 1986, ApJ 311, 335
- (48) Weissman P.R., 1991, Icarus 89, 190
- (49) Young K., 1995, ApJ 445, 872
- (50) Zubko V., & Elitzur M., 2000, ApJ 554, L137