Evidence for an X-Ray Jet in DG Tau A?
Abstract
We present evidence for an X-ray jet in the T Tau star DG Tau A based on Chandra ACIS data. DG Tau A, a jet-driving classical T Tau star with a flat infrared spectrum, reveals an unusual X-ray spectrum that requires two thermal components with different intervening absorption column densities. The softer component shows a low temperature of MK, and its absorption is compatible with the stellar optical extinction (hydrogen column density cm-2). In contrast, the harder component reveals a temperature (22 MK) characteristic for active T Tau stars but its emission is more strongly absorbed ( cm-2). Furthermore, the high-resolution ACIS-S image reveals a weak excess of soft ( keV) counts at distances of 2–4″ from the star precisely along the optical jet, with a suggestive concentration at 4″ where a bow-shock-like structure has previously been identified in optical line observations. The energy distribution of these photons is similar to those of the stellar soft component. We interpret the soft spectral component as originating from shocks at the base of the jet, with shock heating continuing out to a distance of at least 500 AU along the jet, whereas the hard component is most likely coronal/magnetospheric as in other young stellar systems.
1 Introduction
The earliest stages of star formation are characterized not only by mass accretion onto a circumstellar molecular disk and onto the forming protostar but also by massive bipolar molecular outflows (Shu et al., 1987). The outflows may be driven by narrowly collimated jets that are launched close to the young star, possibly in the innermost regions of the accretion disk (e.g., Shu et al. 1997). The most promising jet formation theories relate to the magnetocentrifugal mechanism (Blandford & Payne, 1982). The two key variants are distinguished by where the wind is launched: from close to where the disk is truncated by the stellar magnetosphere (X-wind model, Shu et al. 2000), or along open magnetic field lines streaming off the disk (Königl & Pudritz, 2000).
High-resolution interferometric radio observations, being unaffected by the intervening molecular material, reveal compact, thermal jets very close to the protostars (tens to a few hundred AU, or up to a few arcseconds at the distance of young stars in Taurus; Rodríguez 1995; Anglada 1995) and coincident with the optical-jet bases. The common explanation invokes shock ionization where the stellar wind or the polar outflows collide with overlying denser or infalling material.
These inner jet regions can shock-heat plasma to X-ray temperatures for realistic flow velocities. The shock temperature is K where is the shock front speed relative to a target, in units of 100 km s-1 (Raga et al., 2002). Jet speeds are typically of order km s-1 (Eislöffel & Mundt 1998 = EM98; Anglada 1995; Bally et al. 2003), and inner-jet velocities reach up to 700–1000 km s-1 (Rodríguez, 1995). If a flow shocks a standing medium at 400 km s-1, then MK. X-rays have been detected both from shock fronts in Herbig-Haro objects far from the driving star (e.g., Pravdo et al. 2001), but also from regions as close as 100 AU to the L1551 IRS-5 protostar (Bally et al., 2003), while the central star is entirely absorbed by the molecular gas.
An obvious question to ask is whether jets are more active closer to the star. The consequences would be far-reaching: distributed, large-scale X-ray sources may efficiently ionize larger parts of the circumstellar environment than the central star alone, and in particular the disk surface, thus inducing disk accretion instabilities (Balbus & Hawley, 1991) and altering the disk chemistry (e.g., Glassgold et al. 2004). Strong X-ray attenuation close to protostars prohibits verification. Instead, we have studied a rare transition object, DG Tau A, that still drives strong, protostar-like jets while being optically revealed.
2 The Target
Although considered to be a classical T Tau star (CTTS; distance pc, spectral type K5, mass = 0.67, Hartigan et al. 1995), DG Tau A shows a rare, flat infrared spectral energy distribution and drives a very energetic jet similar to Class I protostars, including a counter-jet (Lavalley-Fouquet et al. 2000 = L00). DG Tau is one of the most active CTTS known (Hartigan et al., 1995; Bacciotti et al., 2002), and can thus be thought of as a transition object between protostars and CTTS (Pyo et al., 2003). Cohen & Bieging (1986) identified the jet at radio wavelengths and found indications of outflow motions. The stellar optical extinction is rather modest, with = 2.2 (Muzerolle et al., 1998). This enables detection of soft X-rays down to the star, which is not possible in the case of embedded protostars. Despite considerable efforts, no close companion to DG Tau A has been identified (Leinert et al., 1991; White & Ghez, 2001).
Recent high-resolution studies with adaptive optics, interferometry and the Hubble Space Telescope have shown that a narrow jet ploughs through progressively slower and wider outflow structures, with maximum bulk gas speeds reaching 500 km s-1 (Bacciotti et al., 2000; Beristain et al., 2001) and FWHM line widths of 100–200 km s-1 (Pyo et al., 2003). The high-velocity jet shows bow-shock like structures out to several arcsecs (“HH 158”), e.g., at 3–4″ and at about 10″ distance from the central star (L00; Bacciotti et al. 2000; Dougados et al. 2000; EM98), but can be followed down to 0.1″ from the star (Bacciotti et al., 2000; Pyo et al., 2003). Recently, Bacciotti et al. (2002) measured rotation of the jet around its flow axis, which has subsequently been used to infer the origin of the jet in the inner disk (0.34 AU for the lower-velocity component, and possibly in the X-wind region at the inner-disk edge at AU for the high-velocity jet; Anderson et al. 2003; Pyo et al. 2003). The jet mass-loss rate, yr-1, is about one tenth of the accretion rate (Bacciotti et al., 2002). Shocks seem to be the principal source of heating and excitation (L00).
3 Observations
We have observed DG Tau A with Chandra for 29.6 ks on 2003 July 2. We used the ACIS-S detector in VERY FAINT mode. The data were reduced in CIAO vers. 3.0.2 following the standard analysis threads111http://cxc.harvard.edu/ciao/guides/acis_data.html. These procedures included corrections for charge transfer inefficiency and afterglow, and selection of good time intervals. Standard pixel randomization was applied but we found no significant effect on our imaging results. Although the field of view contained a number of other sources (DG Tau B, FV Tau AB, KPNO-Tau 13), the present Letter addresses only our findings on the CTTS DG Tau A.
4 Results
DG Tau A was detected at (2000) = 04, (2000) = as determined with the wavelet source detection task in CIAO. The position given in the 2MASS catalog is (2000) = 04, (2000) = . The difference, , is not significant within the systematic uncertainty of the Chandra position. We extracted counts from DG Tau A from within 19 of the stellar position in the energy range of 0.3–7 keV (this circular area contains 95% of the energy from a point source). We thus collected 391 counts, corresponding to an average count rate of ct s-1.
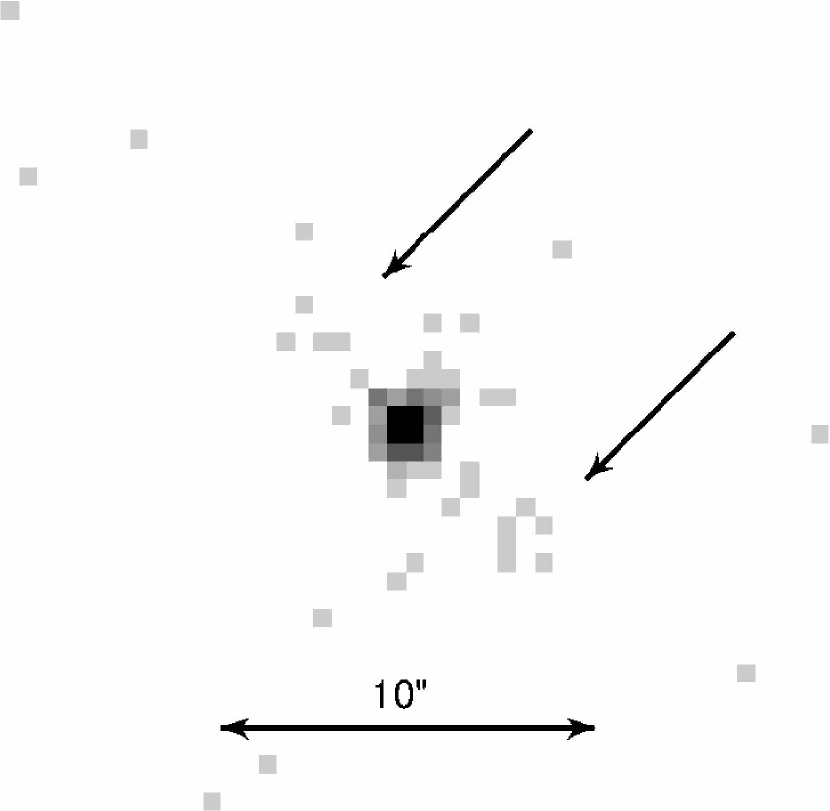
The DG Tau A image shows some irregularities out to a distance of about 5″ in the energy range of keV but not at lower or at higher energies. The region around DG Tau A, further constrained to photon energies between keV to suppress background at lower and higher energies (resulting in 191 cts around DG Tau A), is shown in Fig. 1a. We find an excess of counts along a position angle of about 45° and 225°, closely coincident with the position angle of the optical jet (, EM98). A small accumulation of soft counts at a distance of southwest of DG Tau A is coincident with a shock zone seen in optical lines after accounting for proper motion of the shock zone within the jet (Dougados et al., 2000). The extensions are aligned neither with the CCD pixel rows nor the columns.
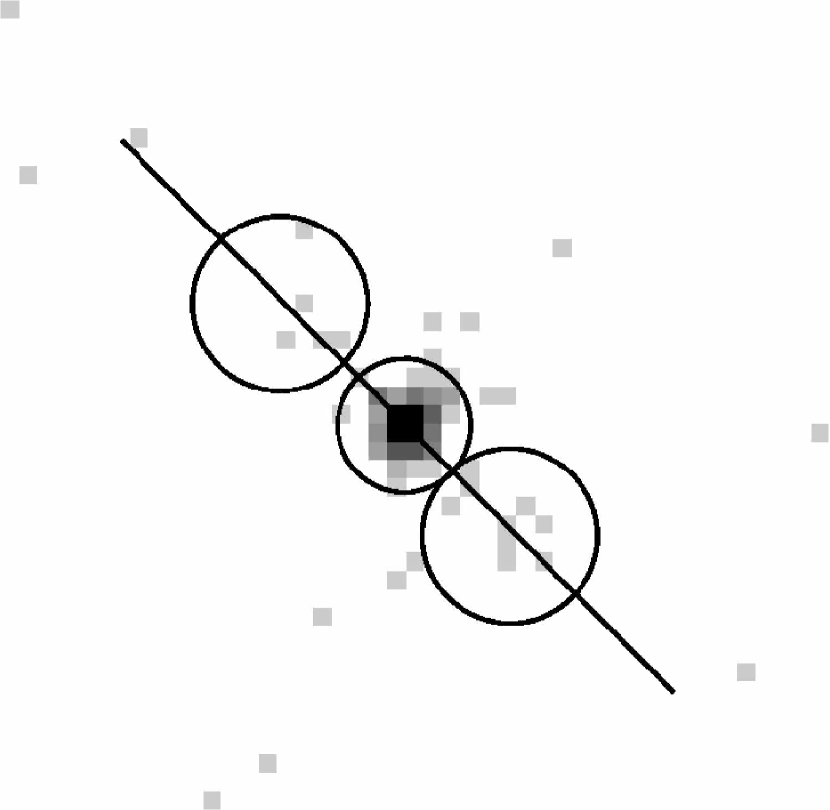
We extracted counts from two circular regions of radius , adjacent to the source area (see Fig. 1b). These latter areas combined include 18 counts in the 0.3–7 keV range, 17 of which are found in the interval 0.4–2.4 keV (and one count at 4.6 keV, compared to 274 cts for DG Tau A within 19). Some of these counts may be due to the extended wings of the stellar PSF. To estimate the expected contamination, we simulated the DG Tau A point source with the MARX222http://space.mit.edu/CXC/MARX/ software, using precisely the same boresight coordinates and satellite position angle as in the real observation but collecting a total of cts in the stellar source across the spectrum to achieve good statistics. Although DG Tau A was located about 85″ off-axis, the shape of the PSF is almost precisely circular and not significantly broadened compared to the on-axis PSF. Using the same extraction regions used for DG Tau A and its extensions, we found that only 0.46% or an average of 1.3 counts of the stellar 0.4–2.4 keV counts fall within the regions of the extensions. Also, scaling the 0.4–2.4 keV background around DG Tau A, we expect on average 0.7 background counts in the extensions. Conservatively assuming 3 cts of contamination, we find an excess of 14 counts (0.4–2.4 keV) in the extensions, corresponding to about 5 with respect to the Poisson fluctuation in the contamination.
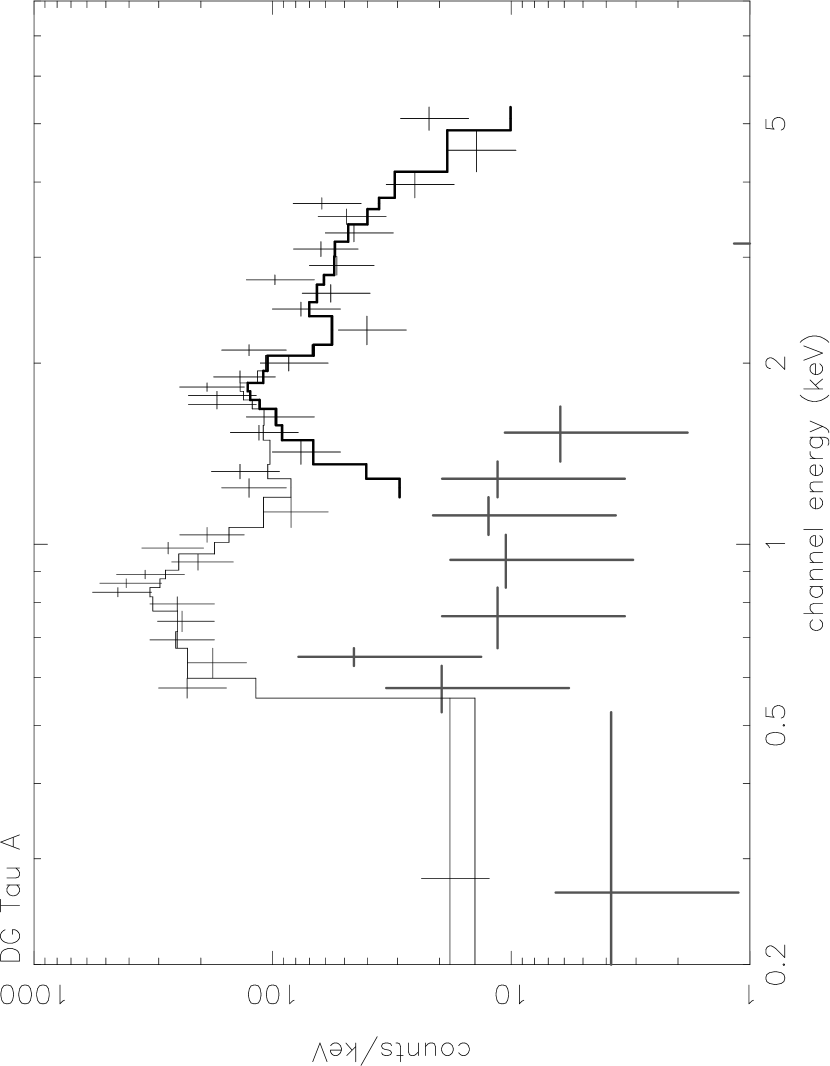
The DG Tau A spectrum shown in Fig. 2 (upper series of crosses) is peculiar. It shows a peak at keV, pointing at rather low temperatures, a trough at about 1.3 keV, a secondary peak around 1.8 keV and and an extended, shallow but bright tail up to at least 5 keV, suggesting high temperatures. We fitted thermal continuum+emission line models (based on the apec model in XSPEC, Arnaud 1996) together with a single neutral-gas absorption column density, . Abundances were either fitted as a global metallicity with respect to the solar photospheric composition, or they were fitted individually. No acceptable fit was found if two thermal components were assumed (either one temperature diverged to unrealistically high values, or a strongly absorbed, cool component with an large 0.1–10 keV X-ray luminosity , egs s-1, uncommon to T Tau stars, was added, while the reduced ). The spectrum is, however, excellently fitted by adopting different absorption column densities for the two thermal components ( for 30 degrees of freedom). Here, we have fixed the global abundance at 0.3 times the solar photospheric value given by Anders & Grevesse (1989) as is often found in active stars (Güdel, 2004), but values as high as unity do not change these parameters significantly. We thus find a composite spectrum consisting of a cool component with MK (1 errors) and cm-2, and a hot component with MK and a much increased cm-2. The best-fitting model is shown in Fig. 2 (thin histogram). We plot the contribution from the strongly absorbed hard component separately (thick histogram).
The emission measure ratio EMhot/EMcool is close to unity. For the soft and the hard components, is, respectively, erg s-1 and erg s-1, totaling erg s-1 or (using , White & Ghez 2001).
5 Discussion
Our composite spectrum requires two different sources that cannot be co-spatial: we would not expect two sources at the same position to have different . A binary with components subject to different could produce such a spectrum but no such companion has been found, despite dedicated searches (e.g., Leinert et al. 1991; White & Ghez 2001). The soft source is unusual for its rather low temperature of 2.9 MK whereas the associated is compatible with the stellar optical extinction of 2.2 mag (Muzerolle et al., 1998) based on the usual conversion of cm-2. The extended emission shows a similar spectral energy distribution (Fig. 2, gray crosses). The hard component with MK is typical for CTTS in star-forming regions (Skinner et al., 2003) although it appears to be seen through a higher absorbing column than is the stellar photosphere.
We make the following speculations. The extended, elongated features in the ACIS-S image, in particular at about 4′′ SW (Fig. 1), are soft X-rays formed in shocks in the inner regions of the jet. This corresponds to distances also reported by optical observers and is analogous to the finding reported for L1551 IRS-5 (Bally et al., 2003). The soft, low-absorption peak of the two-component stellar X-ray spectrum is unlikely to originate close to the source of the more attenuated, presumably magnetospheric, hard X-ray emission. An origin of the soft component away from the absorbed hard X-ray region may suggest that the base of the jet (within the Chandra point-spread function of the star) could be involved. We now estimate whether this hypothesis is plausible.
The gas streaming along the jet can shock-heat if colliding with a slower medium downstream. A simple model for shock-heating has been presented by Raga et al. (2002). The shock-jump conditions give for the shock temperature ,
| (1) |
while the predicted luminosity of the shock is the smaller of
| (2) | |||||
| (3) |
where is the pre-shock density, , and is the characteristic radius the bow-shock zone around its axis. These values underestimate the true X-ray luminosities and by factors of 1–3 because line emission has not been considered (Raga et al., 2002).
We distinguish between conditions close to the star (within the Chandra ACIS point-spread function of DG Tau A) and in the inner optical jet, a few arcsecs away from the star. L00 estimate cm-3 for the innermost jet at 0.22″, and cm-3 at a distance of 3.5″. The shock-zone radius is of order 0.1″ (or smaller) in the inner jet region (Bacciotti et al., 2000), and about 1″ at a distance of 3–4″ (L00), corresponding to a linear radius of cm and cm, respectively, assuming DG Tau A is 140 pc from us.
Assuming km s-1, these parameters predict erg s-1 (at both assumed distances); and erg s-1 for the inner region and erg s-1 for the outer region. Using Eq. (1), we find MK. Maximum velocities in the DG Tau jet reach 450 km s-1 in the visible jet at (Bacciotti et al., 2000), and up to 600 km s-1 close to the star (Beristain et al., 2001). In these latter cases, MK and 5.4 MK, respectively.
We have assumed shock velocities essentially equal to the jet velocities, which is acceptable if the dense jet travels into a low-density environment. Also, we have assumed a jet ploughing into a standing medium. The above luminosities are much smaller for a shock velocity of km s-1, corresponding to shocks between the fast jet and the moving adjacent medium (L00), and the low shock temperature will then produce most of the emission outside X-ray wavelengths.
Although we used only rough estimates for densities, velocities, and source sizes, the luminosities in the range of erg s-1 (and higher if line emission is accounted for) compare favorably with the total luminosity in the soft component of the stellar spectrum, erg s-1.
6 Conclusions
We have presented a first analysis of the X-ray properties of the peculiar CTTS DG Tau A. This star, classified as an optically revealed T Tau star, drives a strong jet reminiscent of protostellar analogs. It also shows a flat infrared energy distribution, indicative of a massive circumstellar disk. DG Tau A is thus one of the rare pre-main sequence stars whose jet emission can be followed essentially down to the star in the optical and the soft X-ray range. X-ray emission possibly produced in shocks at the base of the jet can therefore be detected given the low degree of photoelectric absorption by the intervening gas column.
We speculate that the anomalous X-ray spectrum composed of two components with different absorption column densities is due to two sources, one probably being of magnetospheric or coronal origin and producing hard X-rays common to T Tau stars, while the soft, little absorbed component could predominantly be produced further away in shocks close to the base of the jet. If this mechanism operates also in deeply embedded protostars, then the consequences would be far-reaching. Instead of a central point source, a linear column of X-ray sources may irradiate a large portion of the molecular environment, thus ionizing its gas and altering the cloud and disk chemistry.
Before concluding, we mention two caveats. Shock velocities are commonly smaller within optically observed jets, in the range of 70–100 km s-1 in DG Tau A (L00). Similar to the case in L1551 IRS-5, however, our data lead us to postulate collision velocities in parts of the jet corresponding to the bulk jet velocity of several 100 km s-1 perhaps against the interstellar medium at rest, or against infalling material close to the star. And second, while the extended structure in the Chandra image is suggestive of jet-shock-induced emission several arcsec away from the star, the statistics are still poor, and deeper observations are required to better confine the spectral parameters.
Combining the evidence collected here, however, does suggest that the outstanding feature of DG Tau A, its strong jet, is a contributor both to the anomalous X-ray spectrum and the faint extensions seen in the Chandra image. A similar situation may thus apply to embedded protostars although X-ray attenuation makes verification very difficult.
The excess photoabsorption of the hard radiation in DG Tau A is unexplained. Absorption could be due to disk gas if most of the magnetosphere is on the far side of the disk, or due to weakly ionized gas that streams along the magnetic field lines toward the star, or due to a highly flared inner disk. Excess X-ray absorption in the absence of excess stellar extinction by dust may also arise from uncommon gas-to-dust ratios, e.g., a lowered dust content along the line of sight toward the star due to dust evaporation in the stellar vicinity. Alternatively, an undetected companion could also account for the different in the two sources, although the difference in the intrinsic X-ray spectra would be surprising.
References
- Anders & Grevesse (1989) Anders, E., & Grevesse, N. 1989, Geochim. Cosmochim. Acta, 53, 197
- Anderson et al. (2003) Anderson, J. M., Li, Z.-Y., Krasnopolsky, R., & Blandford, R. D. 2003, ApJ, 590, L107
- Anglada (1995) Anglada, G. 1995, RevMexAA, 1, 67
- Arnaud (1996) Arnaud, K. A. 1996, in ASP Conf. Ser. 101, Astronomical Data Analysis Software and Systems V, ed. G. Jacoby & J. Barnes (San Francisco: ASP), 17
- Bacciotti et al. (2000) Bacciotti, F., Mundt, R., Ray, T. P., Eislöffel, J., Solf, J., & Camenzind, M. 2000, ApJ, 537, L49
- Bacciotti et al. (2002) Bacciotti, F., Ray, T. P., Mundt, R., Eislöffel, J., & Solf, J. 2002, ApJ, 576, 222
- Balbus & Hawley (1991) Balbus, S. A., & Hawley, J. F. 1991, ApJ, 376, 214
- Bally et al. (2003) Bally, J., Feigelson, E., & Reipurth, B. 2003, ApJ, 584, 843
- Beristain et al. (2001) Beristain, G., Edwards, S., & Kwan, J. 2001, ApJ, 551, 1037
- Blandford & Payne (1982) Blandford, R. D., & Payne, D. G. 1982, MNRAS, 199, 883
- Cohen & Bieging (1986) Cohen, M., & Bieging, J. H. 1986, AJ, 92, 1396
- Dougados et al. (2000) Dougados, C., Cabrit, S., Lavalley, C., & Ménard, F. 2000, A&A, 357, L61
- Eislöffel & Mundt (1998) Eislöffel, J., & Mundt, R. 1998, AJ, 115, 1554 = EM98
- Glassgold et al. (2004) Glassgold, A. E., Najita, J., & Igea, J. 2004, ApJ, 615, 972
- Güdel (2004) Güdel, M. 2004, A&AR, 12, 71
- Hartigan et al. (1995) Hartigan, P., Edwards, S., & Ghandour, L. 1995, ApJ, 452, 736
- Königl & Pudritz (2000) Königl, A., & Pudritz, R. E. 2000, Protostars and Planets IV (Tucson: University of Arizona Press), 759
- Lavalley-Fouquet et al. (2000) Lavalley-Fouquet, C., Cabrit, S., & Dougados, C. 2000, A&A, 356, L41 = L00
- Leinert et al. (1991) Leinert, C., Haas, M., Mundt, R., Richichi, A., & Zinnecker, H. 1991, A&A, 250, 407
- Muzerolle et al. (1998) Muzerolle, J., Calvet, N., & Hartmann, L. 1998, AJ, 116, 2965
- Pravdo et al. (2001) Pravdo, S. H., Feigelson, E. D., Garmire, G., Maeda, Y., Tsuboi, Y., & Bally, J. 2001, Nature, 413, 708
- Pyo et al. (2003) Pyo, T-S., et al. 2003, ApJ, 590, 340
- Raga et al. (2002) Raga, A. C., Noriega-Crespo, A., & Velázquez, P. 2002, ApJ, 576, L149
- Rodríguez (1995) Rodríguez, L. F. 1995, RevMexAA, 1, 10
- Shu et al. (1987) Shu, F. H., Adams, F. C., & Lizano, S. 1987, ARA&A, 25, 23
- Shu et al. (1997) Shu, F. H., Shang, H., Glassgold, A. E., & Lee, T. 1997, Science, 277, 1475
- Shu et al. (2000) Shu, F. H., Najita, J. R., Shang, H., Li, Z.-Y. 2000, Protostars and Planets IV (Tucson: University of Arizona Press), 789
- Skinner et al. (2003) Skinner, S. L., Gagné, M., & Belzer, E. 2003, ApJ, 598, 375
- White & Ghez (2001) White, R. J., & Ghez, A. M. 2001, ApJ, 556, 265