VLT-FORS1 Imaging Polarimetry of M83 (NGC 5236)
I. Search for Light
Echoes from Historical Supernovæ†
Abstract
We have used FORS1 at the ESO VLT to search for light echoes in imaging polarimetry from four historical supernovæ in the face-on nearby spiral galaxy M83 (NGC 5236). No echoes were detected around our targets (SN 1923A, SN 1945B, SN 1950B and SN 1957D). This implies that the interstellar medium in their environs is rather tenuous (a few particles per ), possibly as a result of previous supernova explosions that could have cleared the immediate vicinities of our targets. The merits and limitations of searching for light echoes in imaging polarimetry are discussed. From the photometry of the sources detected at the supernova locations, we estimate star cluster masses of 720, 400, 300 for the cluster progenitors of SN 1957D, SN 1923A, and SN 1950B, respectively, and an upper limit of few tens of solar masses for SN 1945B.
1 Introduction
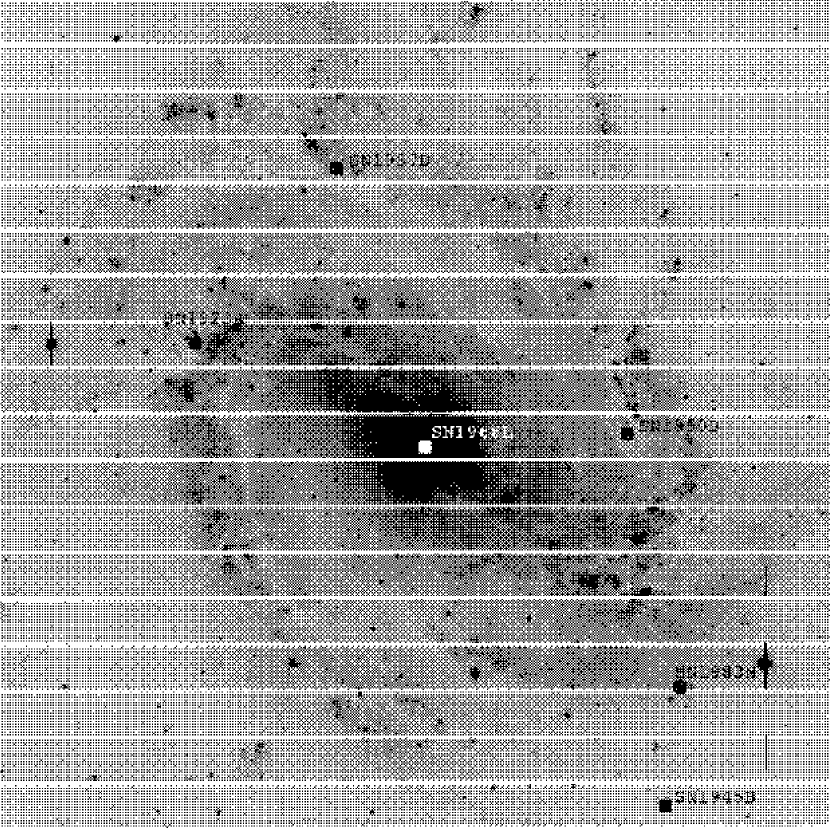
We have undertaken an observational campaign to study the optical polarization properties of the face-on, nearby spiral galaxy M83 (catalog ) (NGC 5236 (catalog )) from local (i.e. few arcseconds) to galactic (i.e. several arcminutes) scales. In this first paper of a projected series of three, we discuss our search for light echoes from four out of the six historical supernovæ known in M83, namely SN 1923A (catalog ), SN 1945B (catalog ), SN 1950B (catalog ) and SN 1957D (catalog ). Their location within the galaxy is shown in Figure 1, together with that of SN 1983N (catalog ) and SN 1968L (catalog ), which we could not observe because they fall into the gap between two adjacent pointings and onto the bright, heavily saturated galactic nucleus, respectively. With the loci of maximum polarization ranging in diameter from to , these supernovæ could have produced echoes resolvable with ground-based observations under suitable seeing conditions.
The paper is organized as follows. In section 2 we briefly summarize the main properties of light echoes and their connection with the characteristics of the supernova and of the scattering material. The observations and data reduction are described in section 3 and the resulting polarization maps for the individual historical supernovæ are presented in section 4. Finally, the conclusions are drawn in section 5.
2 Phenomenology of light echoes
Under suitable circumstances after a supernova explodes, due to light travel time effects, an echo or reflection of light from the explosion scattered by interstellar matter reaches the observers at a later date. This phenomenon is known as a “light echo”. Of course any other transient source of light, like a nova, for example, can produce an echo by the same mechanism. Echoes from supernovæ, especially type Ia, are particularly interesting because they can be produced by dust clouds several hundred parsecs from the supernova, and are, at least in principle, visible out to distances of a few tens of megaparsecs from the Sun. To date, however, only four cases of echoes from supernovæ at optical wavelengths are known: SN 1991T (catalog ) (type Ia, Schmidt et al, 1994; Sparks et al, 1999), SN 1998bu (catalog ) (type Ia, Cappellaro et al, 2001), SN 1987A (catalog ) (type II,e.g. Xu et al, 1994; Spyromilio et al, 1995) and SN 1993J (catalog ) (type II, Sugerman & Crotts, 2002). In addition, the infrared excess observed in some supernovæ has also been interpreted as due to the presence of a light echo (see, e.g., Gerardy et al, 2002, and references therein). In this paper we will only be concerned with the optical echoes, whose luminosity is produced by simple scattering, and not with the infrared ones, which are thought to originate through thermal emission by dust heated by the supernova flash (Emmering & Chevalier, 1988).
In the single scattering approximation, which we will adopt throughout this paper, the geometry of an optical echo is very simple (see, for example, Chevalier, 1986; Sparks, 1994; Sugerman, 2003; Patat, 2005). At any given time the scattering surface is the iso-delay surface for the light traveling to the observer, i.e. an ellipsoid with the supernova in one focus and the observer in the other one. In all astrophysical situations, the distance between the observer and the supernova is much larger than the one between the supernova and the scattering material and, for all practical purposes, the ellipsoid can be approximated by a paraboloid. The echo, then, crosses the interstellar medium (ISM) out to large distances from the supernova and can, in principle, be used as an effective tool to study the ISM properties (spatial distribution, density, etc; see, e.g., Xu et al, 1994, and references therein).
Given their simple geometry, Sparks (1994) proposed to use imaging polarization observations of light echoes as a purely geometrical tool to measure distances. As projected on the sky, light from the center of the echo is backscattered and is not polarized, light from the outer fringes of the echo is forward scattered and is weakly polarized, but light initially in the plane of the sky is scattered at an angle and is very highly polarized. So, when seen through a polarizer, the echo projected on the sky will have a maximum corresponding to about scattering. Given the axial symmetry of the system, the locus of maximum polarization will be a ring in the plane of the sky containing the supernova (or parts of it, if the scattering material is not distributed uniformly). Once an echo is identified in polarized light, measuring the distance to the supernova, and to its parent galaxy, is straightforward. The absolute radius of the ring of maximum polarization is , where is the age of the supernova and is the speed of light. If we now call the observed angular radius of the ring of maximum polarization, we immediately get the distance to the supernova to be . Under plausible conditions the integrated luminosity of the echo is expected to be about 10 magnitudes fainter that the supernova at maximum, so that 8-10 meter class telescopes are needed to detect these echoes in polarized light beyond the Local Group.
2.1 Unpolarized light
Placing the supernova at the origin of the coordinate system, the equation of the paraboloidal scattering surface is (see, e.g., Chevalier, 1986):
| (1) |
where and are the coordinates on the plane of the sky and is the coordinate perpendicular to it, pointing towards the observer.
Following Sparks (1994), the surface brightness as a function of wavelength of an echo at an angular distance from a supernova of apparent flux at maximum immersed in a medium of uniform density is:
| (2) |
where is the scattering optical depth of the echo111This is the optical depth through the width of the expanding echo, not the optical depth to the echo itself due to the material along the line of sight to the observer (see equation (A1)). and ( is the age of the supernova at the epoch of observations and is its distance from the Sun). The ingredients which enter in equation (2) are:
- •
-
•
The phase function which appears in equation (2) is a function of the scattering angle and is customarily parametrized in terms of ( for isotropic scattering and for pure forward scattering; Henyey & Greenstein, 1941) as:
(3) -
•
The scattering optical depth , which is derived in appendix A, is given by:
(4) where is the ratio of total neutral hydrogen surface density to color excess at solar metallicity (, Bohlin et al, 1978), is the ratio of the total to selective extinction (in the Milky way on average , e.g. Savage & Mathis, 1979), is the duration of the burst of the supernova ( for a type II plateau supernova, e.g. Patat et al, 1994), is the grain albedo ( at optical wavelengths, e.g. Mathis et al, 1977), the hydrogen number density and the oxygen abundance. We use as determined by Bresolin & Kennicutt (2002) from several HII regions in M83 (here we adopt from Allende Prieto et al, 2001). In the following, then, we will use a value of as reference for the scattering optical depth of supernova echoes in M83. As noticed in appendix A, is the effective cross section per hydrogen atom and its value is about at optical wavelengths (see also Draine, 2003).
We can now use equation (2) to compute the -band surface brightness in magnitudes per square arcseconds:
| (5) | |||||
where we have introduced the function that contains all of the information about the shape of the surface brightness profile of the echo. This function is plotted in Figure 3 with a solid line for the case of isotropic scattering () and with a dashed line for the one in which forward scattering is favored (, e.g. Draine, 2003). As discussed above, a value of was used.
2.2 Polarized light
The polarization signal expected from a light echo is linear polarization arranged in a tangential field centered at the supernova position (e.g., Sparks, 1994; Patat, 2005). If there is dust on the plane of the supernova, the radius of the maximum polarization is , where is the age of the supernova at the epoch of the observations (2001.3, in our case) and is the speed of light. At a distance of Mpc (Thim et al, 2003, from Cepheid variables) this translates into an angular radius (in arcseconds) given by:
| (6) |
The intrinsic degree of polarization is expected to be of the order of 50% or higher (e.g., Sparks, 1994; Patat, 2005). Observationally, it is, then, diluted because the components of the Stokes vector are combined vectorially inside each resolution element. Given the image quality in the final frames of (HWHM) and typical ring radii of from equation (6), we estimate that the observed polarization is reduced to about 0.6 times its intrinsic value, i.e. to 30-60%. Of course, the observed pattern needs not be a full ring if the dust is not distributed uniformly.
The echo origin of such a structure, if detected, should, then, be confirmed with spectroscopy. The spectrum of an echo is expected to be the weighted sum of the spectra of the parent supernova as it evolves with time, corrected for the scattering extinction efficiency as a function of wavelength (e.g., Patat, 2005).
3 Observations and data reduction
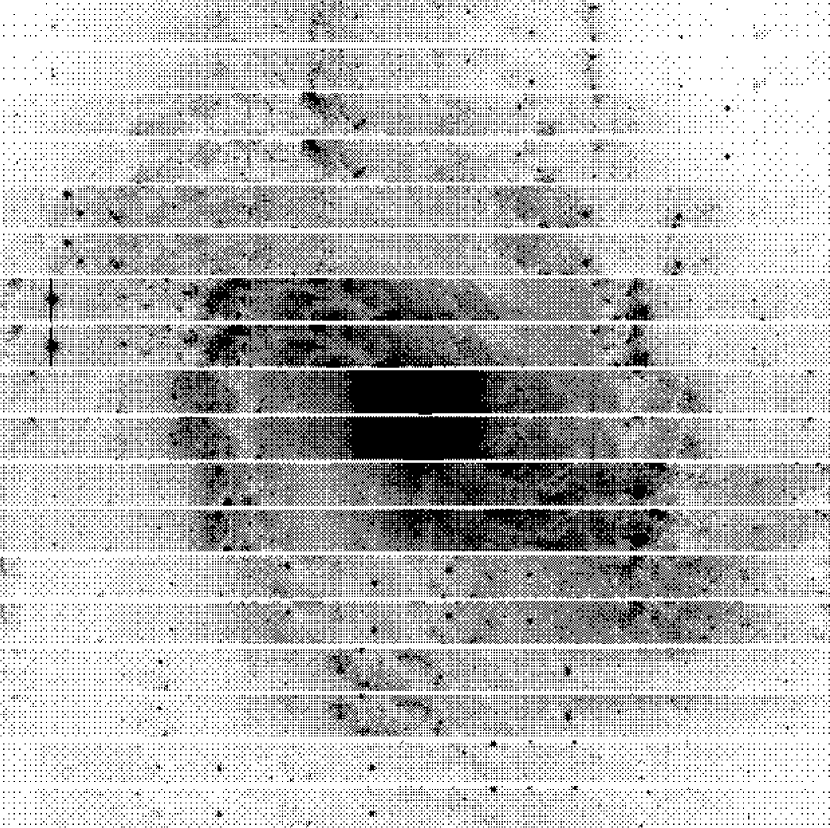
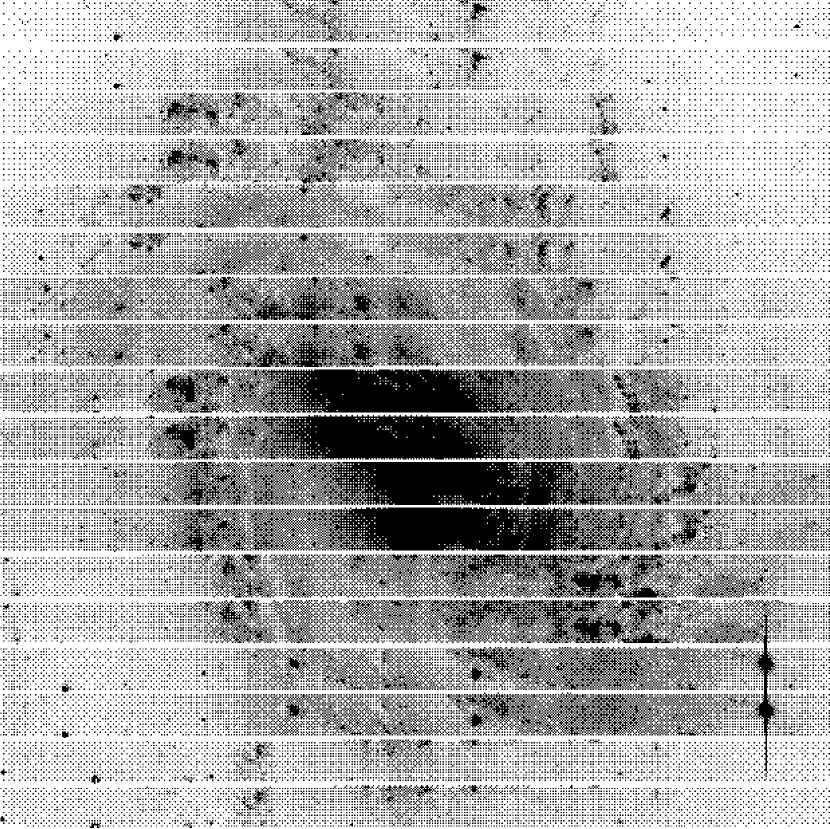
We have imaged M83 in March 2001 with the FORS1 instrument in polarimetric mode at the ESO Cerro Paranal Observatory. The instrument is described in detail in Szeifert & Jehin (2003). Polarimetry with FORS1 is performed by inserting in the light path the combination of a Half Wave Plate and Wollaston prism. The Half Wave Plate introduces a phase shift in the incoming light beam, which is equivalent to rotating the instrument as a whole. The Wollaston prism splits the incoming light in two orthogonally polarized beams. A strip mask is inserted in the focal plane to avoid the overlap of these two beams of polarized light on the CCD detector plane. As a result, every exposure covers half of the field of view in two mutually orthogonal linear polarization directions, usually referred to as ordinary and extraordinary beams. These, then, need to be combined to derive the Stokes parameters and, since they were taken simultaneously, the effects of variations in the the Earth’s atmosphere transparency are canceled (see, e.g., Appenzeller, 1967; Scarrott et al, 1983). In order to cover the entire galaxy, we have taken two sets of exposures, shifted by one slit throw (). The coordinates and rotator angle were chosen so as to place as many historical supernovæ as possible (five out of six) in the same pointing. Regrettably, SN 1968L is projected on the bright galactic nucleus, which is heavily saturated in our images, and could not be studied. Two examples of the resulting images are shown in Figure 2.
Every pointing was observed in the V band using 4 Half Wave Plate angles spaced by , i.e. 8 polarization directions. The total observing time at each Half Wave Plate position was 1.9 hours, split into 15 minute exposures for accurate cosmic ray removal. The image quality on the final stacked image is FWHM. A redundancy of the polarization directions is recommended to mitigate instrumental imperfections (improper flat-fielding, non-ideal Wollaston transmission, etc.). The astrometric solution was reconstructed with a few stars from the GSC2 (catalog ) present in the FORS1 field of view.
After de-biasing and flat-fielding with unpolarized sky flat field frames222see also http://www.eso.org/instruments/fors1/pola.html., the images for the 4 Half Wave Plate positions were carefully aligned and combined to derive the Stokes parameters and, ultimately, the polarization degree and angle with their associated errors following the procedures as discussed in Patat & Romaniello (2005).
The value of the local background for the ordinary and extraordinary beams around the position of each supernova was estimated as the minimum intensity in a square box (130 pc at 4.5 Mpc, Thim et al, 2003) centered on the supernova itself. The background shows some spatial structure even on these relatively small scales. The adoption of a single value for the background is justified by noticing that different prescriptions on how to estimate it (minimum value, median value, mode, a simple 2D model with a low-order polynomial) all lead to the same results to within the random observational uncertainties. It is still possible, though, that, because of the complex spatial distribution of the diffuse emission, we are not subtracting the “true” value of the background. This could introduce a systematic bias in the inferred degree of polarization, which is rather hard to estimate. On the other hand, the polarization angle measured with dual-beam instruments like FORS1 only depends on the ratio of normalized flux differences in the ordinary and extraordinary beams (e.g., Patat & Romaniello, 2005). As such, it is to the first order independent of the exact value used to estimate and subtract the background. The polarization pattern is, then, determined rather robustly and can be used as a good diagnostics for the presence of a light echo (tangential polarization).
Quantitatively, the typical measured background around the position of the historical supernovæ is . In the exposure time we have used, 1.9 hours for each of the Half Wave Plate angles needed to carefully derive the polarization degree () and angle (), it leads to a signal-to-noise ratio (SNR) per pixel of 4 for a source with . In turn, this corresponds to an uncertainty on and of (see, e.g., Patat & Romaniello, 2005):
| (7) |
| (8) |
where in the last equation we have used .
Finally, all of the images taken with different Half Wave Plate angles can be combined together to reach a higher signal-to-noise ratio for detection of unpolarized light. Thus, the limit in unpolarized light is or, conversely, an unpolarized emission of is detectable at an level in our data.
4 Polarization around the individual supernovæ
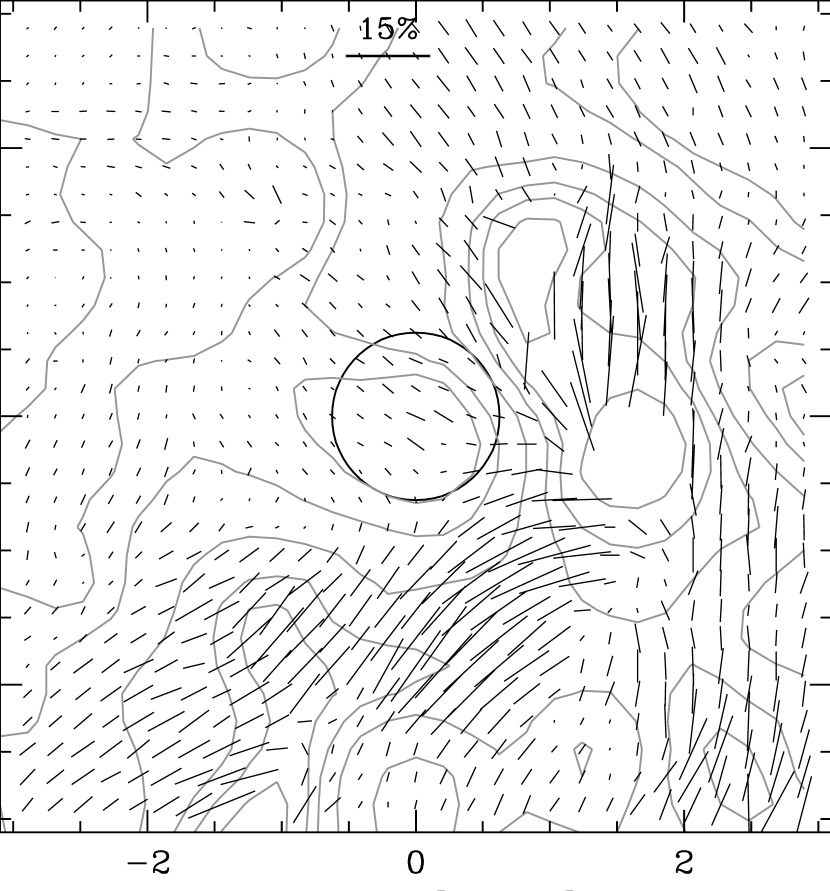
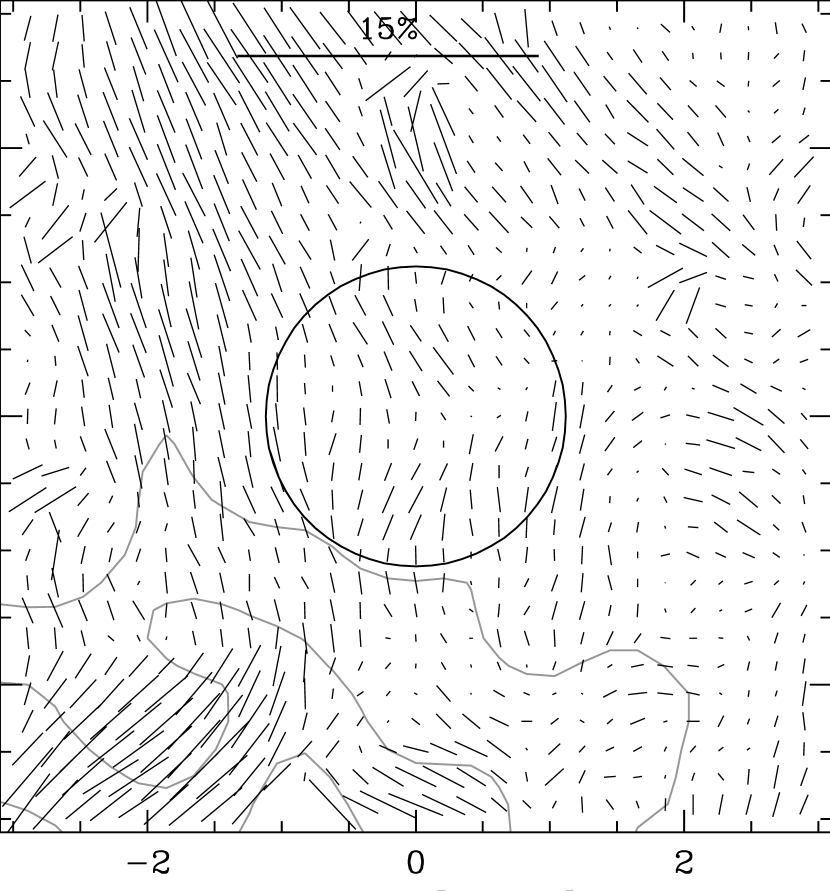
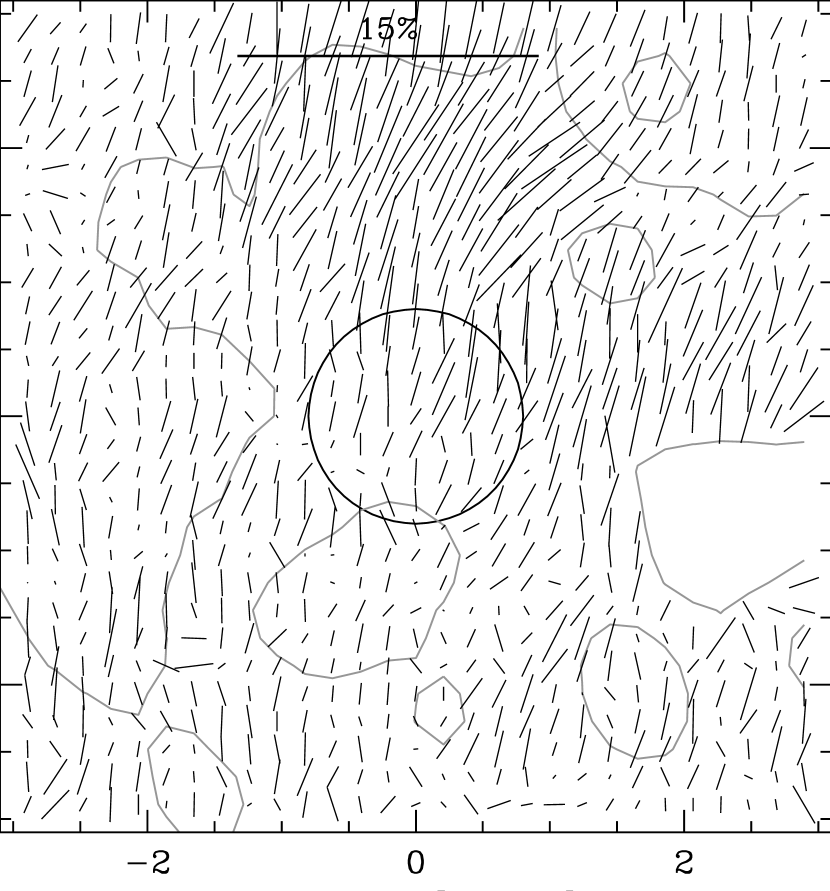
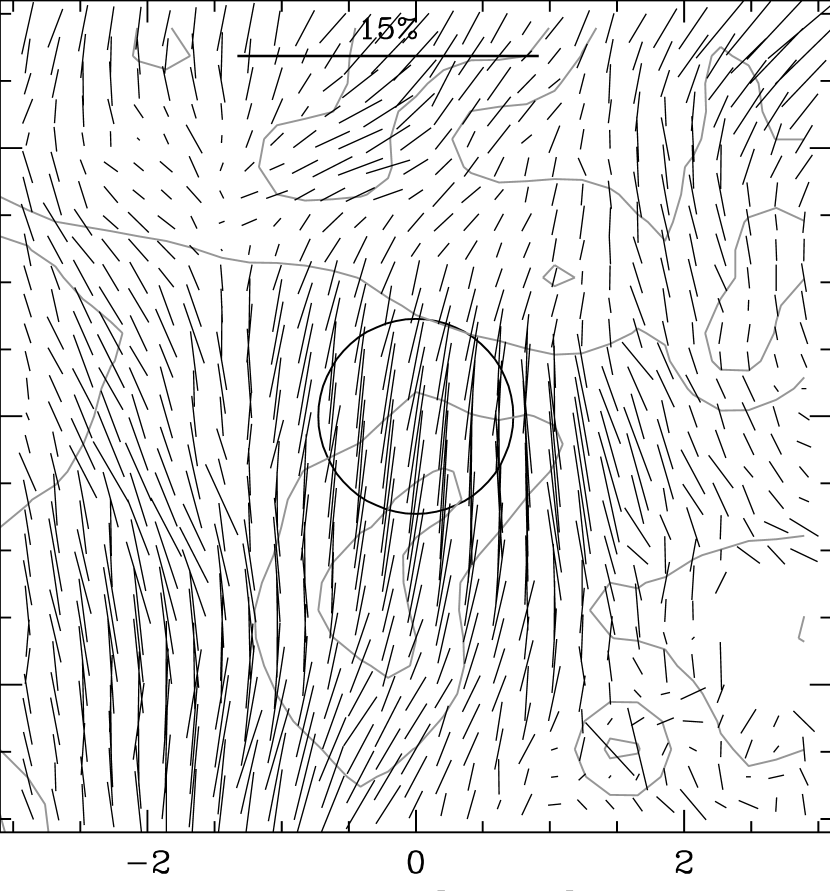
The polarization maps in the neighborhood of the four historical supernovæ we have studied in M83 are shown in Figures 4 through 7. The location where the maximum of the polarization is expected according to equation (6) is marked with a circle. Let us recall here that we do not have data for the other two historical supernovæ in M83, SN 1983N and SN 1968L, because the first one happened to be located in our images in a gap between two pointings and the latter one is projected on the the bright, heavily saturated galactic nucleus.
4.1 SN 1957D
The generally accepted value for the magnitude at maximum of SN 1957D is (e.g. Barbon et al, 1999). At a distance of 4.5 Mpc, i.e. a distance modulus of 28.3, it translates into an intrinsic magnitude of , which places SN 1957D at the very faint end of the type II supernovæ luminosity function, even fainter then SN 1987A (for reference, a “regular” type II peaks at for ; Patat et al, 1994). It is possible, then, that SN 1957D was observed after maximum and that it was, in reality, brighter than magnitude. If this were the case, then, the echo would be intrinsically brighter than reported in Table 1. For lack of better evidence, though, in the following we will adopt .
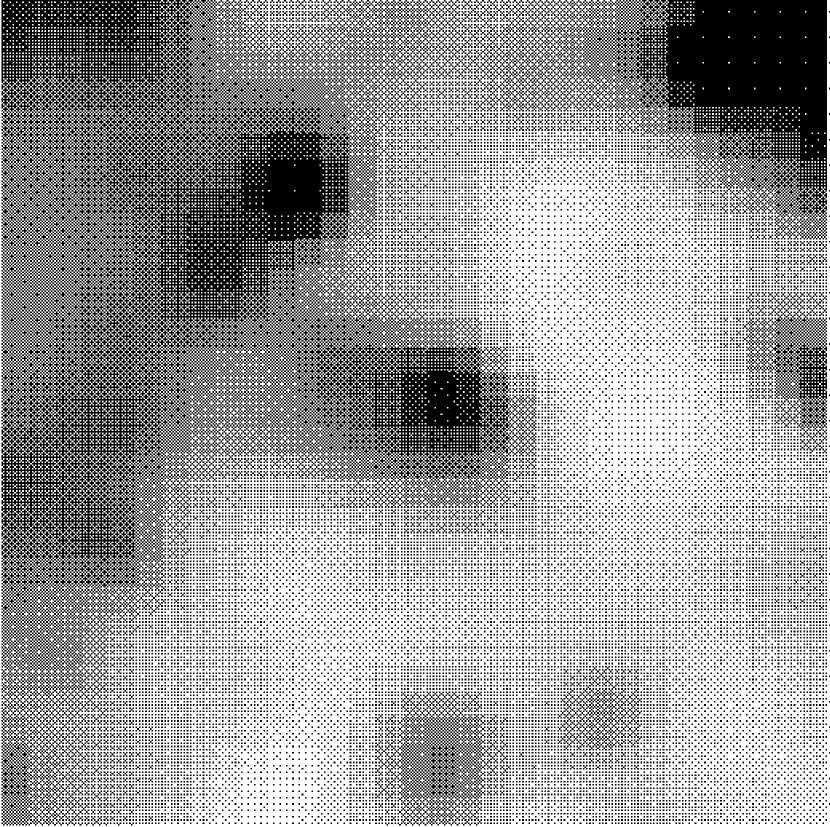
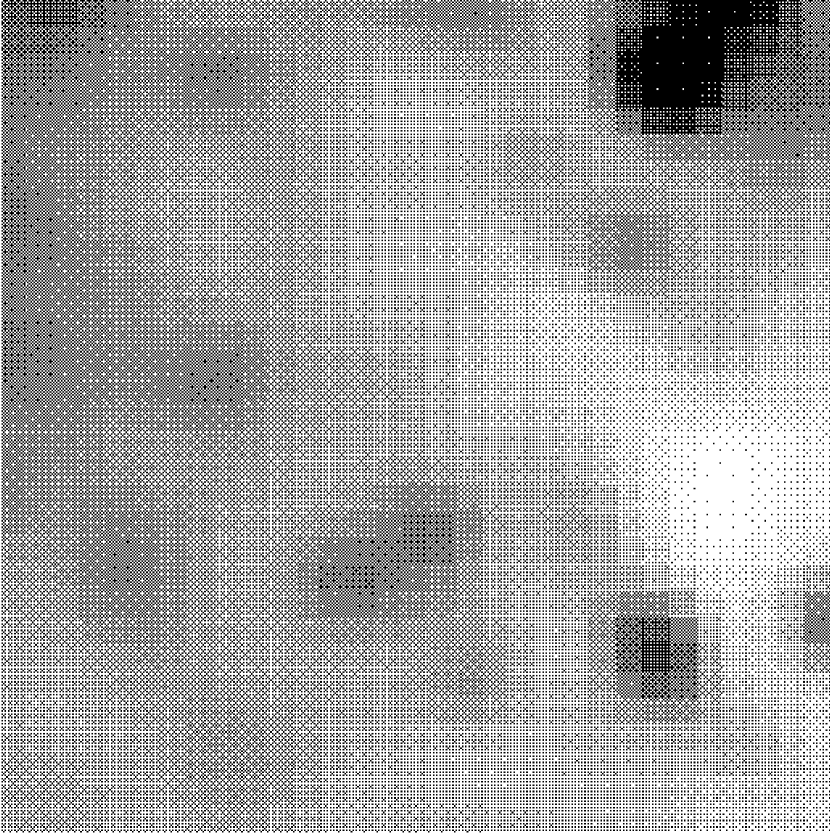
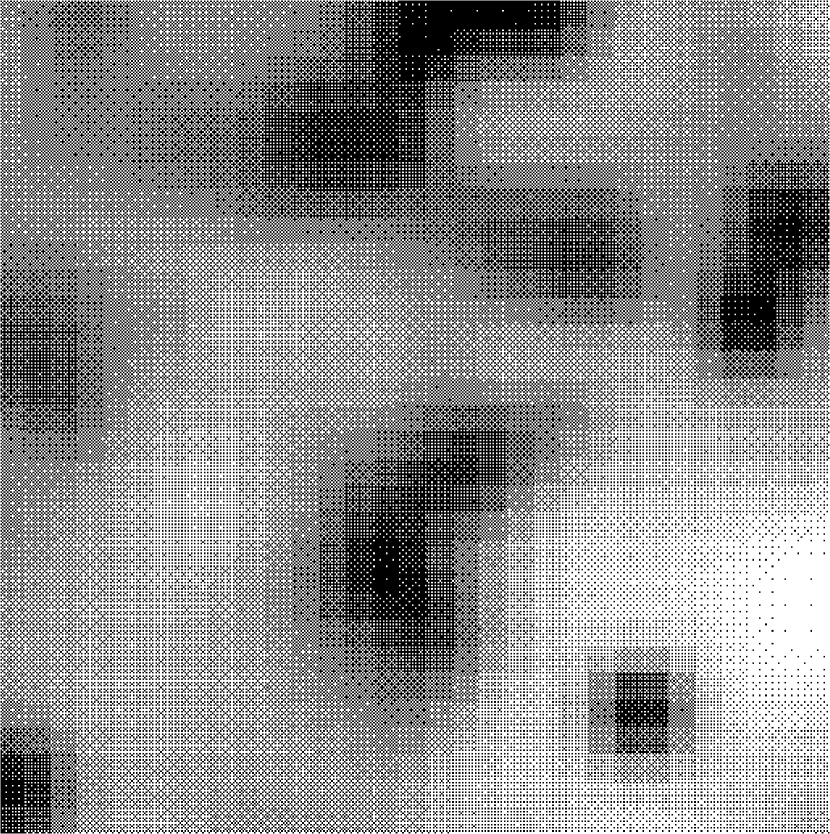
The polarization around SN 1957D is displayed in Figure 4, together with an image of the same region of on the side. Clear structures with polarization degrees of several percents are detected. However, it is not possible to attribute any of these structures to the light from the supernova being scattered by interstellar clouds, because the polarization vectors are mostly oriented radially relative to the position of the supernova itself. On the contrary, as discussed in section 2.2, the expected pattern for an echo would be tangential. These polarized emissions are most likely associated with the large-scale polarization of M83, which follows the spatial distribution of dust along the spiral arms. Its study will be the subject of a forthcoming paper (Romaniello et al, in preparation). The simplest explanation for the non-detection of an echo is that there is not enough dust in the vicinity of the supernova to produce one (in fact, Long et al, 1992, find a rather modest value of reddening to SN 1957D itself, ). We will come back to this in section 5.
A rather strong unpolarized emission is also seen at the position of the supernova (Figure 4, right panel), which is likely to be associated with the supernova remnant itself. Its total magnitude, as measured on our images, is . The detection of this compact emission is highly significant, with a signal-to-noise ratio of about 100. The most recent spectroscopy at the position of SN 1957D by Turatto et al (1989) and Long et al (1992) suggests that about 50% of the -band flux from the central source is emitted in the very broad [OIII] emission (, with the red wing of the line extending beyond the zero velocity position). Turatto et al (1989) measured a flux of for the [OIII] blend and detect several other lines (MgI , [OI] and H+[NII] [OII] ) and interpret the spectrum as that of a supernova remnant, similar to Cas A (catalog ) in the Galaxy and N132D (catalog ) in the Large Magellanic Cloud (see also Long et al, 1992). In our images the emission is spatially resolved, with a radius of , or 12 pc at 4.5 Mpc (Thim et al, 2003). This size is appreciably larger than expected for a supernova remnant (for reference, Cas A is 2 pc in radius at an age of about 300 years, Raymond, 1984), thus indicating that the remnant itself is embedded in an HII region and/or a group of stars. Actually, Long et al (1992) detected a narrow H emission component which is indicative of an HII region, and Cowan et al (1994) infer the presence of a substantially emitting HII region from the observed flattening of the spectral index of the radio flux from SN 1957D.
We have run a simple simulation to evaluate the probability that the spatial correspondence between the location of SN 1957D and the HII region is due to a chance alignment. By generating random locations for the supernova over the observed spatial distribution of the sources in its vicinity we estimate the probability of a chance alignment to be less than 20%.
Conservatively, attributing 50% of the band luminosity to the stellar component and adopting a distance modulus of 28.3, the underlying stellar cluster would have an absolute magnitude for an average visual extinction of 0.35 magnitudes (Long et al, 1992). Using Starburst99 models (Leitherer et al, 1999) for a metallicity of twice solar, as appropriate at the galactocentric distance of SN 1957D (Bresolin & Kennicutt, 2002), and a Salpeter IMF within the interval , such a magnitude corresponds to a stellar cluster of initial mass of about if SN 1957D was the “median” supernova to explode in the cluster, i.e. when the cluster was at an age of about 16 Myrs (Pennington et al, 1982). Had the cluster had a younger age, a lower cluster mass would be inferred, and viceversa. With an initial mass of and an age of 16 Myrs, the cluster should have produced about 7 supernovæ, and correspondingly released a total in kinetic energy. This energy input is enough to sweep away the ISM from the immediate vicinity of the supernova, hence justifying our non-detection of light echoes in its immediate proximity.
Finally, let us note that Boffi et al (1999) have indicated SN 1957D as a possible candidate for hosting an echo based on the observed blue and colors of a compact “feature” detected and of the nominal position of the supernova, i.e. outside of the box in the right-hand panel of Figure 4. As such, the object they identify is unlikely to be related either to the supernova, or to a possible echo.
4.2 SN 1923A, SN 1945B and SN 1950B
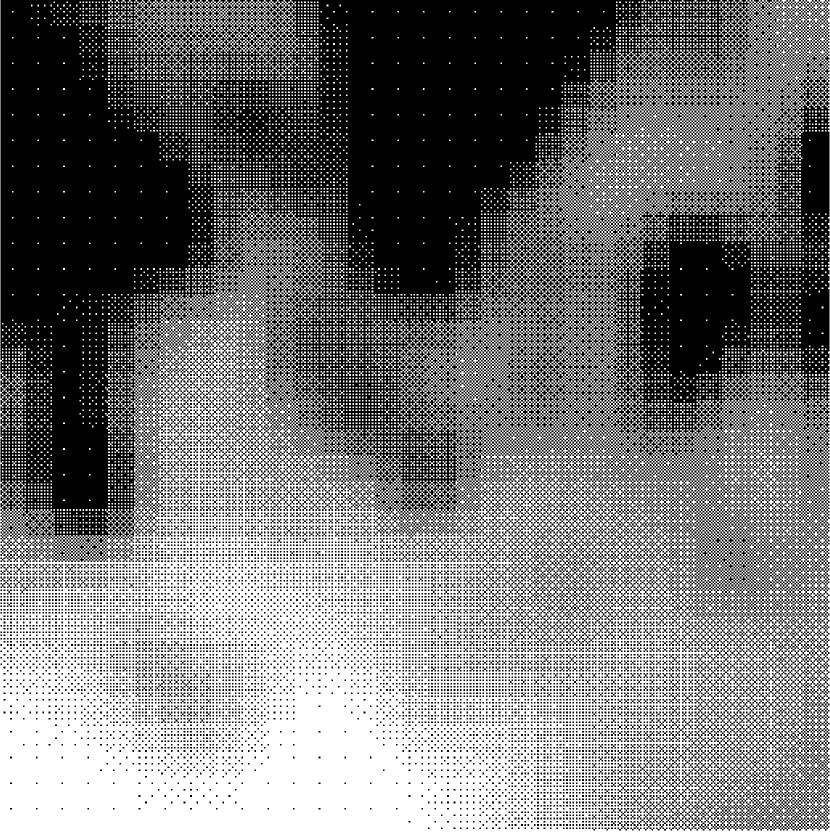
In Figures 5 through 7 we show the polarization and intensity maps for the surroundings of SN 1923A, SN 1945B and SN 1950B. Again, polarization degrees of several percents are detected, but there is no sign of a coherent circular structure for any of these three supernovæ. As we noticed in section 4.1, the simplest explanation for the non-detection of an echo is that there is not enough dust in the vicinity of the supernova to produce one. This goes in the same direction, but on larger spatial scales, as for the results of Blair & Long (2004), who did not find evidences of remnants for any of these three supernovæ.
Let us now use the magnitude measured in our images at the nominal position of the historical supernovæ to estimate the mass of the stellar population that gave birth to SN 1923A, SN 1945B and SN 1950B, again under the assumption that each of them was the ”median” one to explode among its population. As discussed above, this assumption implies an age of about 16 Myrs for the stars. The emission at the position of SN 1923A is measured to have and that at the position of SN 1950B . Fluxes were measured with aperture photometry and both detections are highly significant, at the 60 and level, respectively.
As in the case of SN 1957D, we have run a simple simulation to evaluate the probability that the spatial correspondence between the locations of SN 1923A and SN 1950B and the optical emissions detected in our images is due to a chance alignment. By generating random locations for the supernovæ over the observed spatial distribution of the sources in their vicinity we have estimated the probability of a chance alignment to be of the order of 30%. This is slightly larger than in the case of SN 1957D because the remnant itself was not detected neither for SN 1923A nor SN 1950B and, hence, we have allowed for an error-box of on the published positions of the supernovæ (Barbon et al, 1999).
Using the stellar synthesis models of Leitherer et al (1999) as for the case of SN 1957D, these magnitudes imply initial star cluster masses of about 400 and for SN 1923A and SN 1950B, respectively. For SN 1945B, on the other hand, we could only measure an upper limit for the emission at the location of the supernova (see Figure 6, right panel) of at , implying that the parent cluster contained only a few tens of solar masses.
5 Discussion and conclusions
In this paper we have presented very deep VLT-FORS1 imaging polarimetry in the V band aimed at detecting and studying the light echoes from four of the six historical supernovæ known in the face-on spiral galaxy M83. We took advantage of the multiplex capabilities afforded by the FORS1 instrument in its polarimetric mode by observing the targets simultaneously. The exposure time for each of the four Half Wave Plate angles needed to recover the polarization degree and angle was 1.9 hours.
M83 is a well suited target to search for light echoes because, being an actively star-forming galaxy (e.g. Blair & Long, 2004, and references therein), it has hosted 6 known historical supernovæ. Moreover, its proximity to the Sun (4.5 Mpc, Thim et al, 2003), makes it possible to resolve the echoes in seeing-limited observations with 8-10 meter class ground-based telescopes. In fact, the final image quality on our stacked image is (FWHM), which would allow the detection of echoes, if present, as close as a to the parent supernova (see Table 1). In spite of this and of our very deep exposures (7.6 hours for every pointing), we did not detect the characteristic tangential polarization pattern around any of the four supernovæ we have studied (SN 1923A, SN 1945 and SN 1950B, and SN 1957D). If echos were produced around the targets, then, they have to be fainter than our detection threshold in polarized light of (see section 3).
At this stage, then, we can only place an upper limit to the scattering optical depth in the vicinities of our target supernovæ, which can, then, be translated into an upper limit on the density of the interstellar material. By combining equation (5) with the values of listed in Table 1 and the echo radial profile of Figure 3, we see that the typical surface brightness expected for the echoes at a radial distance of is of about for the reference value of the scattering optical depth of . Of course, the higher , the brighter the echo. The fact that no echoes were detected above our threshold of , then, implies that the actual value of in the vicinity of the historical supernovæ has to be lower than about .
According to equation (4) a higher value of the optical depth compared to the reference value can be due to a combination of a higher effective cross section , and/or a longer duration of the burst of the supernova (), and/or higher albedo and/or high density of the interstellar medium (). Of these four quantities, we consider the latter one as the most likely to determine a variation of the value of the optical depth in different environments. In fact, a cross section of about at optical wavelengths is appropriate for typical dust (e.g. Draine, 2003, and references therein), supernovæ rarely have bursts lasting longer than 100 days (e.g. Patat et al, 1994) and the albedo in the optical is rather firmly established to be (e.g. Mathis et al, 1977). We, thus, conclude, that the non-detection of light echoes implies a rather tenuous interstellar medium around the four historical supernovæ, with a hydrogen number density lower than about .
Equation (4) makes it easy to adapt the result to different characteristics of the dust (i.e. the effective cross section , the albedo ), of the parent supernova (i.e. the duration of the burst ), or the metallicity of the interstellar medium (). In particular, we have used a typical Galactic value of for the ratio of the total to selective extinction (e.g. Savage & Mathis, 1979; Draine, 2003), which seems to be appropriate for M83 as a whole (Biossier at al, 2005). is observed to vary between about 2 and 5.5 along different lines of sight in the Milky Way and other galaxies (Draine, 2003, and references therein), which would cause the inferred value of to increase or, respectively, decrease by the same, rather mild, factor.
The energy input from previous supernovæ in these clusters could be responsible for sweeping away the ISM from the immediate vicinities of our targets. If these low values are common, detecting and characterizing light echoes, even from objects as intrinsically luminous as supernovæ in nearby galaxies, would be an almost prohibitive task in terms of telescope time.
From the photometry of the sources detected at the supernova locations, we estimate star cluster masses of 720, 400, 300 for the cluster progenitors of SN 1957D, SN 1923A, and SN 1950B, respectively, and an upper limit of few tens of solar masses for SN 1945B.
To conclude, we would like to emphasize that identifying light echoes in imaging polarimetry is advantageous because they should produce a clear signature in the form of a tangential polarized structure around the parent supernova. On the other hand, though, detailed dust modeling indicate that forward scattering is a better description of reality, rather than the simpler isotropic case (e.g. Draine, 2003, and references therein). As shown in Figure 3 light echoes from a uniform distribution of dust are expected to be much more extended in the case of forward scattering (dashed line) than in the one of isotropic scattering (solid line), in which they have a characteristic size of . Disentangling such an extended source superposed on a complex galactic background is an extremely challenging task (see also the discussion in section 3). Ultimately, background subtraction could be the main limiting factor in the detection of echoes, both in unpolarized and polarized light. Therefore, searches should be focused on the outskirts of galaxies, where the background is smoother, hence easier to evaluate and subtract.
Appendix A Derivation of equation (4)
In this appendix we derive the expression in equation (4) for the scattering optical depth through the expanding flash :
| (A1) |
where is the speed of light, is the duration of the burst of the supernova at wavelength , the space density of the dust scattering particles and is the scattering cross section. This latter quantity is related to the extinction coefficient through the albedo :
| (A2) |
where and are the extinction optical depth and cross section, respectively, and is the column density of the scattering dust.
Let us now introduce the ratio of total neutral hydrogen density to color excess at solar metallicity , and allow it to scale linearly with the oxygen abundance (James et al, 2002):
| (A3) |
where in the last passage we have used equation (A2).
References
- Allende Prieto et al (2001) Allende Prieto, C., Lambert, D.L., and Asplund, M. 2001, ApJ, 556, L63
- Appenzeller (1967) Appenzeller, I. 1967, PASP, 79, 136
- Barbon et al (1999) Barbon, R., Buondí, V., Cappellaro, E., and Turatto, M. 1999, A&AS, 139, 531
- Blair & Long (2004) Blair, W.P., and Long, K.S. 2004, ApJS, 155, 101
- Boffi et al (1999) Boffi, F.R., Sparks, W.B., and Macchetto, F.D. 1999, A&AS, 138, 253
- Biossier at al (2005) Boissier, S., Gil de Paz, A., Madore, B.F. et al 2005, ApJ, 619, L83
- Bohlin et al (1978) Bohlin, R.C., Savage, B.D., and J.F. Drake 1978, ApJ, 224, 132
- Bresolin & Kennicutt (2002) Bresolin, F., and Kennicutt, R.C. 2002, ApJ, 572, 838
- Cappellaro et al (2001) Cappellaro, E., Patat, F., Mazzali, P.A., Benetti, S., Danziger, J.I., Pastorello, A., Rizzi, L., Salvo, M., and Turatto, M. 2001, ApJ, 459, 215
- Chevalier (1986) Chevalier, R.A. 1986, ApJ, 308, 225
- Cowan et al (1994) Cowan, J.J., Roberts, D.A., and Branch, D. 1994, ApJ, 434, 128
- Draine (2003) Draine, B.T. 2003, ARA&A, 41, 241
- Gerardy et al (2002) Gerardy, C.L., Fesen, R.A., Nomoto, K., Garnavich, P.M., Jha, S., Challis, P.M., Kirshner, R.P., Höflich, P., and Wheeler, J.C. 2002, ApJ, 575, 1007
- Emmering & Chevalier (1988) Emmering, R.T., and Chevalier, R.A. 1988, AJ, 95, 152
- Henyey & Greenstein (1941) Henyey, L.C., and Greenstein, J.L. 1941, ApJ, 93, 70
- James et al (2002) James A., Dunne, L., Eales, S., and Edmunds, M.G. 2002 MNRAS, 335, 753
- Leitherer et al (1999) Leitherer, C., Schaerer, D., Goldader, J.D., Delgado, R.M. González, Robert, C., Kune, D.F., de Mello, D.F., Devost, D., Heckman, T.M. 1999, ApJS, 123, 3
- Long et al (1992) Long, K.S., Winkler, P.F., and Blair, W.P. 1992, ApJ, 395, 632
- Mathis et al (1977) Mathis, J.S., Rumpl, W., and Nordsieck, K.H. 1977, ApJ, 217, 425
- Patat (2005) Patat, F. 2005, MNRAS, 357, 1161
- Patat et al (1994) Patat, F., Barbon, R., Cappellaro, E., and Turatto, M. 1994, A&A, 282, 731
- Patat & Romaniello (2005) Patat, F., and Romaniello, M. 2004, PASP, in press
- Pennington et al (1982) Pennington, R.L., Talbot, R.J., Jr., and Dufour, R.J. 1982, AJ, 87, 1538.
- Raymond (1984) Raymond, J.C. 1984, ARA&A, 22, 75
- Savage & Mathis (1979) Savage, B.D., and Mathis, J.S. 1979, ARA&A, 17, 73
- Scarrott et al (1983) Scarrott, S.M., Warren-Smith, R.F., Pallister, W.S., Axon, D.J., and Bingham, R.G. 1983, MNRAS, 204, 1163
- Schmidt et al (1994) Schmidt, B.P., Kirshner, R.P., Leibundgut, B., Wells, L.A., Porter, A.C., Ruiz-Lapuente, P., Challis, P., and Filippenko, A.V. 1994, ApJ, 439, L19
- Sparks (1994) Sparks, W.B. 1994, ApJ, 433, 19
- Sparks et al (1999) Sparks, W.B., Macchetto, F.D., Panagia, N., Boffi, F., Branch, D., Hazen, M.L., and Della Valle, M. 1999, ApJ, 523, 585
- Spyromilio et al (1995) Spyromilio, J., Malin, D.F., Allen, D.A., Steer, C.J., and Couch, W.J. 1995, MNRAS, 274, 256
- Sugerman & Crotts (2002) Sugerman, B.E.K, and Crotts, A.P.S. 2002, ApJ, 581, L97
- Sugerman (2003) Sugerman, B.E.K 2003, ApJ, 126, 1939
-
Szeifert & Jehin (2003)
Szeifert, T., and Jehin, E.
2003, FORS 1+2 User Manual,
http://www.eso.org/instruments/fors/userman - Thim et al (2003) Thim, F., Tammann, G.A., Saha, A., Dolphin, A., Sandage, A., Tolstoy, E., and Labhardt, L. 2003, ApJ, 590, 256
- Turatto et al (1989) Turatto, M., Cappellaro, E., and Danziger, J. 1989, The Messenger, 56, 36
- Xu et al (1994) Xu, J., Crotts, A.P.S., and Kunkel, W.E. 1994, ApJ, 435, 274

| Object | ||||
|---|---|---|---|---|
| [mag] | [lyrs] | [arcsec] | [] | |
| SN 1923A | 14 | 77.8 | 1.1 | 14.2 |
| SN 1945B | 13.9 | 55.7 | 0.8 | 13.4 |
| SN 1950B | 14.5 | 51.0 | 0.7 | 13.8 |
| SN 1957D | 15 | 43.4 | 0.6 | 13.9 |