Observation and modeling of anomalous CN polarization profiles produced by the molecular Paschen-Back effect in sunspots
Abstract
We report novel spectropolarimetric observations of sunspots carried out with the Tenerife Infrared Polarimeter (TIP) in a near-IR spectral region around 15410 Å, which is known to contain two groups of prominent OH lines that show circular polarization signals of opposite polarity. Surrounding these well-known OH lines, we have discovered the presence of CN lines of the band which show anomalous polarization profiles. Although the Stokes signals of the OH lines are antisymmetric and with a sizable amplitude, the CN lines show almost negligible circular polarization. On the contrary, the linear polarization signals turn out to be much stronger in the CN lines than in the OH lines. Interestingly, these CN lines present striking antisymmetric linear polarization profiles, which we are able to explain and model via the Paschen-Back effect theory for diatomic molecules. The presence of such peculiar CN lines in the same spectral region of the OH lines may be useful to improve our empirical knowledge of solar magnetic fields via the simultaneous observation and modeling of the transverse and longitudinal Zeeman effects in two different molecular species.
1 Introduction
The observation and theoretical modeling of the Zeeman effect in molecular lines is a frequently overlooked diagnostic window, which should however be increasingly pursued because it can lead to important new insights in solar and stellar physics. The basic theory of the Zeeman effect for doublet states of diatomic molecules was developed a long time ago (Hill 1929), but it remained “forgotten” for almost half a century, probably due to the difficulty in dealing with its complicated expressions obtained using basis functions from Hund’s case (b) In the seventies, Schadee (1978) developed the theory of the Zeeman effect using basis functions from Hund’s case (a), thus leading to much more simple formulae. However, after an investigation by Illing (1981) aimed at explaining the broad-band circular polarization observed by Harvey (1973) in sunspots in the = band of the red system () of CN, the theory of the Zeeman effect in molecular lines was not applied to solar observations for more than 20 years. Recently, molecular spectropolarimetry has become again an active field of research in which new observations are being performed and modeled in terms of the Zeeman effect theory (Berdyugina et al. 2000; 2003, Berdyugina & Solanki 2001; 2002, Asensio Ramos & Trujillo Bueno 2003, Uitenbroek et al. 2004, Asensio Ramos et al. 2004a; 2004b).
Here we report full Stokes vector observations of sunspots in the same spectral region where one can find the two pairs of OH lines whose circular polarization profiles were first observed by Harvey (1985) and modeled by Berdyugina & Solanki (2001). As we shall see below, Harvey’s (1985) OH lines are surrounded by several CN lines of the band whose linear polarization profiles present an anomalous behavior.
2 Observations
On 30 July 2000 we carried out spectropolarimetric observations of two near-IR spectral regions using the Tenerife Infrared Polarimeter (TIP, Martínez Pillet et al. 1999) mounted on the German Vacuum Tower Telescope (VTT) at the Observatorio del Teide (Izaña, Spain). We were interested in accurately measuring the Stokes profiles induced by the Zeeman effect in the four prominent OH lines that were first observed by Harvey (1985). To our surprise we discovered that, in addition to such well-known OH lines, there were several enigmatic polarization signals whose identification and radiative transfer modeling is the main contribution of this Letter.
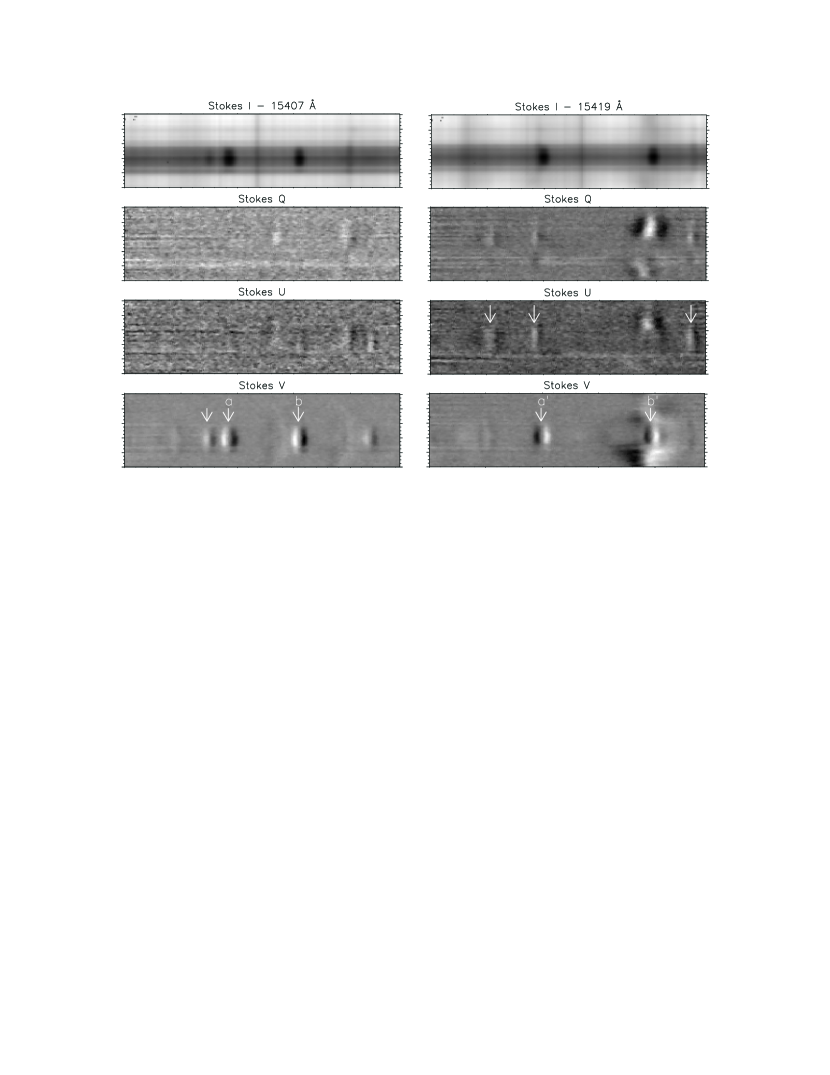
Figure 1 shows the recorded spectra in the two spectral regions we observed around 1.54 m. The slit was crossing a sunspot situated at ==, with the heliocentric angle. The four OH lines observed by Harvey (1985) are vibro-rotational lines of the = system arising in the fundamental electronic state . They can be seen in the figure as strong absorptions in the sunspot umbra, which completely disappear outside the sunspot. Even in the penumbral spectrum the absorption in the OH lines is drastically reduced. Concerning the circular polarization spectrum, we have verified that the OH lines present conspicuous antisymmetric Stokes profiles. Such two pairs of OH lines are the and circular polarization features of Fig. 1, whose Stokes V profiles have opposite sign. As shown in Fig. 1, in addition we have detected two extra circular polarization signals situated to the left and to the right of Harvey’s (1985) pair of OH lines. The left one is the P2(13/2) transition of OH, while we are presently working on the exact identification of the spectral feature located to the right hand side.
Additionally, some lines showing very conspicuous linear polarization profiles (even at the center of the sunspot umbra) are also present in this spectral region although they show very weak absorptions in the intensity spectrum. They show also very weak Stokes signals. Note that although the above-mentioned OH lines have a relatively high value of the effective Landé factor, they do not show clean and sizable Stokes and/or signals.
A detailed comparison of the exact wavelengths of these lines with the CN linelist of Kurucz (1993) indicates that they are CN lines. We find that the CN linear polarization features are more conspicuous close to the umbra-penumbra border, while the observed amplitudes become very small at the center of the umbra. Furthermore, the region of the sunspot which is closer to the disk center shows weaker polarization signals produced by these CN transitions. Additionally, the fact that the linear polarization in such CN lines is much more significant than the circular polarization is common to all the points in the sunspot.
Even more striking than the previous considerations is that the linear polarization of our CN lines do not present the typical symmetric profiles of the transverse Zeeman effect. In fact, the shape closely resembles that of the typical antisymmetric profiles of the circular polarization observed in the OH lines. As we shall see below, this curious behavior is due to the molecular Paschen-Back effect. To the best of our knowledge, this is the first time that antisymmetric linear polarization profiles induced by the Paschen-Back effect are clearly observed in molecular lines111It is of interest to mention that in his theoretical paper Illing (1981) showed a figure with computed Stokes and profiles for the complex where one can see more amplitude for than for . This behavior is clearly different to what we have found both observationally and theoretically for the =, = and = bands..
3 Physical Interpretation
The reason why the circular polarization of the two pairs of Harvey’s (1985) OH lines present opposite polarity is because they have equal but opposite effective Landé factors (Rüedi et al. 1995, Berdyugina & Solanki 2001). These OH lines are vibro-rotational lines of the = system arising in the fundamental electronic state . The -doublet P and P is located around 15419 Å and the -doublet P and P lies around 15407 Å . Such OH lines are marked in Fig. 1 as , , and , respectively. Although the state has to be described under intermediate coupling, we can safely describe it using Hund’s case (b) coupling because the total angular momentum of both lines is high enough (cf. Berdyugina & Solanki 2002). Using the formula for the Landé factor in Hund’s case (b) (Landau & Lifshitz 1982) and the well-known formula for the effective Landé factor (e.g., Landi Degl’Innocenti 1992), we end up with a change of sign for transitions between levels with = ( is the total angular momentum apart from spin) and those between levels with =:
| (1) |
where the plus sign corresponds to transitions between levels = and the minus sign to transitions between levels =. The other (weaker) OH line to the left of the OH line labeled by “” in Fig. 1 confirms this result since it is the P2(13/2) line.
The CN lines we have observed around 1.54 m belong to the electronic transition. The rotational levels of the lower electronic state can be correctly described under Hund’s case (b) coupling when we are in the Zeeman regime. The transition to the Paschen-Back regime occurs for very weak fields (77 G for the lowest rotational levels). For this reason, these lines are always in the Paschen-Back regime under the typical magnetic fields of sunspots. The rotational levels of the upper electronic state are always in the Zeeman regime because the field strength at which the transition to Paschen-Back occurs is 560 kG. However, due to the spin uncoupling, the rotational levels of the electronic state has to be described in an intermediate coupling between Hund’s case (a) and (b). The theory of the molecular Zeeman effect developed by Schadee (1978) (since the lines belong to a transition between doublet states) or the more general numerical diagonalization approach of Asensio Ramos & Trujillo Bueno (2003, 2005) have to be used for determining the magnetic properties of the CN lines around 1.54 m.
The exact wavelength of the observed CN lines are 15418.29 Å, 15419.27 Å and 15423.39 Å. These lines arise from transitions between levels with high values of the angular momentum . The first one is the Q1(27.5) line of the = band (== and ==), the second is the Q1(59.5) of the = band (== and ==) and the third one is the Q1(46.5) line of the = band (== and ==). We show in Fig. 2 the Zeeman patterns for the Q1(46.5) line for different field strengths. These Zeeman patterns indicate the wavelength shift and strength of each of the Zeeman components of the transition. The upper part shows the two components: those arising from = transitions going upwards and those arising from = going downwards. The lower part shows the component, i.e., transitions having =. The rotational and coupling constants have been obtained from Huber & Herzberg (2003).
Figure 2 shows that, even for fields as low as 50 G, the Zeeman patterns of these CN transitions are slightly perturbed by the Paschen-Back effect. This transition to the Paschen-Back regime at low fields is produced because the Zeeman splitting for such low fields is of the order of the energy separation between two consecutive levels of the lower electronic state. Therefore, the non-diagonal terms in the Hamiltonian between adjacent levels are non-negligible. When the field strength is increased, the perturbation becomes larger until arriving to field strengths as large as 30000 G, where the two components are converging to the same structure.
Although it is necessary to solve the radiative transfer equation for polarized light in order to obtain the emergent Stokes profiles, it suffices to consider the Zeeman patterns for the case of 2500 G for understanding their qualitative shape. The final profile is obtained by adding many Voigt profiles centered at each vertical line in the Zeeman pattern diagram of Fig. 2 with a relative strength given by the length of the vertical line. However, we can obtain a general idea of the shape of the profiles if we consider a Voigt profile centered at the center of gravity of each component. This way, is proportional to the difference between two profiles centered at the two components, while is proportional to the difference between a profile centered in the component and the average of two profiles centered in the components. Note in Fig. 3 that the centers of gravity of the two components tend to converge to the same wavelength shift when the magnetic field strength is increased, therefore leading to a smaller value of . This represents the fundamental reason for the observations not showing strong Stokes profiles in the CN lines even though the magnetic field is mainly vertical in the observed sunspot umbra. Using the same reasoning, it is immediately explained why Stokes is stronger than Stokes , and why Stokes presents an antisymmetric profile. To the best of our knowledge, this antisymmetric Stokes profile produced by the underlying structure of the Zeeman pattern itself has not been observed in atomic lines.
4 Theoretical Stokes Profiles
In order to show that the previous qualitative discussion based on Zeeman patterns arguments is indeed correct, we have synthesized the whole spectral region using our radiative transfer code for polarized radiation, which solves the Stokes vector transfer equation via the quasi-parabolic short-characteristics method (Trujillo Bueno 2003). The model atmosphere we have used has been obtained from the application of an inversion code of Stokes profiles induced by the molecular Zeeman effect, which will be described elsewhere. Figure 3 shows the observed Stokes profiles normalized to the surrounding quiet Sun spectrum (dotted line) and the synthetic profiles. Concerning Stokes , we recover with fairly good accuracy the depth and width of the strong OH lines, while the CN lines present a worse fit. Concerning the Stokes profiles of the OH lines, we recover the typical antisymmetric shape, but with a slight asymmetry produced by the individual Zeeman patterns. The Stokes signals produced by the CN lines are very weak and we cannot make a direct comparison between observation and modeling.
The Stokes and profiles clearly show the antisymmetric signals produced by the CN lines. The feature at 15419.27 Å is produced by the blend between OH and CN, which is difficult to fit. In fact, this blend is a massive one in which many CN lines are at similar wavelengths than the OH line and the misfit might be produced by incorrect values of the line strengths. This is reinforced by the fact that the general shape of the profile appears to be recovered in the synthetic profile. In order to avoid these uncertainties, we focus on the cleaner CN lines. Although clean, they indeed represent the contribution of several weak CN lines surrounding the strong component which produces the main signal.
The Stokes profile of the CN line at 15423.39 Å shown in Fig. 3 is very well reproduced. This line presents two lobes of about the same strength, which is correctly recovered using the corresponding Zeeman patterns. Stokes presents a very similar structure. This regularity is produced because deviations from the Zeeman regime are less important for lines between levels with high value of than for levels with low value of (the spin-rotation splitting in the state increases when increases). Concerning the line at 15418.29 Å we find a good fit to Stokes and even although the line shows quite asymmetric profiles.
5 Conclusions
We have presented spectropolarimetric observations of a sunspot at = taken with the Tenerife Infrared Polarimeter in a near-IR spectral region which contains the two groups of OH lines that were first observed by Harvey (1985). Such groups of OH lines show conspicuous circular polarization signals. Interestingly, our full Stokes-vector observations reveal the presence of hitherto undetected CN lines which show anomalous linear polarization profiles. The observed Stokes and profiles turn out to be much stronger than Stokes , even in the presence of the mainly vertical umbral fields that produce the above-mentioned OH circular polarization. Moreover, the CN linear polarization profiles present antisymmetric shapes which resemble those corresponding to the typical circular polarization profiles of the Zeeman regime. We have shown that the theory of the molecular Zeeman effect is able to explain the observed anomalous linear polarization profiles because such CN lines are in the Paschen-Back regime for the typical kG fields of sunspots.
As mentioned in Section 1, Harvey (1973) had discovered previously the existence of non-zero net circular polarization for some lines of the = band of the red system of CN, which were later explained by Illing (1981) in terms of the molecular Paschen-Back effect. However, to the best of our knowledge, this is the first time that CN lines are identified which, in spite of showing minor absorption features and negligible circular polarization amplitudes, show however conspicuous linear polarization profiles whose shape is antisymmetric. Such CN lines are of great diagnostic interest because they happen to be located in the very same spectral region where the above-mentioned OH lines show sizable circular polarization signals. Among other diagnostic applications in solar and stellar physics, this offers the possibility of inferring the three-dimensional structure of the magnetic field vector in sunspots via the simultaneous observation and modeling of the transverse and longitudinal Zeeman effects in two different molecular species.
References
- Asensio Ramos & Trujillo Bueno (2003) Asensio Ramos, A., & Trujillo Bueno, J. 2003, in Solar Polarization 3, ed. J. Trujillo Bueno & J. Sánchez Almeida, ASP Conf. Ser. Vol 307, 195
- Asensio Ramos & Trujillo Bueno (2005) Asensio Ramos, A., & Trujillo Bueno, J. 2005, ApJ, submitted
- Asensio Ramos et al. (2004a) Asensio Ramos, A., Trujillo Bueno, J., Bianda, M., Manso Sainz, R., & Uitenbroek, H. 2004a, ApJ, 611, L61
- Asensio Ramos et al. (2004b) Asensio Ramos, A., Trujillo Bueno, J., & Collados, M. 2004b, ApJ, 603, L125
- Berdyugina et al. (2000) Berdyugina, S. V., Frutiger, C., Solanki, S. K., & Livingston, W. 2000, A&A, 364, L101
- Berdyugina & Solanki (2001) Berdyugina, S. V., & Solanki, S. K. 2001, A&A, 380, L5
- Berdyugina & Solanki (2002) —. 2002, A&A, 385, 701
- Berdyugina et al. (2003) Berdyugina, S. V., Solanki, S. K., & Frutiger, C. 2003, A&A, 402, 513
- Gingerich et al. (1971) Gingerich, O., Noyes, R. W., Kalkofen, W. & Cuny, Y. 1971, Sol. Phys., 18, 347
- Harvey (1973) Harvey, J. W. 1973, Sol. Phys., 28, 43
- Harvey (1985) Harvey, J. W. 1985, in Measurements of Solar Vector Magnetic Fields, ed. M. J. Hagyard, NASA CP-2374, 109
- Hill (1929) Hill, E. L. 1929, Phys. Rev., 34, 1507
- Huber & Herzberg (2003) Huber, K. P., & Herzberg, G. 2003, in Constants of Diatomic Molecules, ed. P. J. Linstrom & W. G. Mallard, NIST Standard Reference Database Number 69 (Gaithersburg MD: NIST)
- Illing (1981) Illing, R. M. E. 1981, ApJ, 248, 358
- Kurucz (1993) Kurucz, R. 1993, Molecular Data for Opacity Calculations (Kurucz CD-ROM No. 15)
- Landau & Lifshitz (1982) Landau, L., & Lifshitz, E. 1982, Quantum Mechanics (Oxford: Pergamon)
- Landi Degl’Innocenti (1992) Landi Degl’Innocenti, E. 1992, in Solar Observations: Techniques and Interpretation, ed. F. Sánchez, M. Collados, & M. Vázquez (Cambridge: Cambridge University Press), 73
- Martínez Pillet et al. (1999) Martínez Pillet, V., Collados, M., Bellot Rubio, L. R., Rodríguez Hidalgo, I., Ruiz Cobo, B., & Soltau, D. 1999, in Astronomische Gesselschaft Meeting Abstracts, vol. 15
- Rüedi et al. (1995) Rüedi, I., Solanki, S. K., Livingston, W., & Harvey, J. 1995, A&AS, 113, 91
- Schadee (1978) Schadee, A. 1978, J. Quant. Spec. Radiat. Transf., 19, 517
- Trujillo Bueno (2003) Trujillo Bueno, J. 2003, in Stellar Atmosphere Modeling, ed. I. Hubeny, D. Mihalas, & K. Werner, ASP Conf. Ser. 288 (San Francisco: ASP), 551
- Uitenbroek et al. (2004) Uitenbroek, H., Miller-Ricci, E., Asensio Ramos, A., & Trujillo Bueno, J. 2004, ApJ, 604, 960