11email: vdtak@mpifr-bonn.mpg.de 22institutetext: Osservatorio Astrofisico di Arcetri, Largo E. Fermi 5, 50125 Firenze, Italy 33institutetext: Laboratoire Astrophysique de l’Observatoire de Grenoble, BP 53, 38041 Grenoble, France
Line profiles of molecular ions toward the pre-stellar core LDN 1544
Velocity profiles of ground state lines of H2D+, HC18O+ and N2H+, observed previously with the CSO and IRAM 30m telescopes, are modeled with a Monte Carlo radiative transfer program to study the temperature, density and velocity structure of the pre-stellar core LDN 1544. The H2D+ line is double-peaked like that of the other ions, but previous models that fit the HC18O+ and N2H+ profiles are found not to fit the H2D+ data. Matching the H2D+ observations requires at least three modifications to the model at small radii: (1) the density profile must continue to rise inward and not flatten off toward the center; (2) the gas temperature must be nearly constant and not drop inwards significantly; (3) the infall velocity must increase inward, in a fashion intermediate between ‘quasi-static’ (ambipolar diffusion) and ‘fully dynamic’ (Larson-Penston) collapse. The C18O emission indicates a chemical age of 0.1 Myr. The effects of a flattened structure and rotation on the line profiles are shown to be unimportant, at least on the scales probed by single-dish telescopes. Alternatively, the H2D+ profile is affected by absorption in the outer layers of the core, if gas motions in these layers are sufficiently small.
Key Words.:
ISM: Molecules; ISM: individual – LDN 1544; Stars: Circumstellar matter; Stars: formation1 Introduction
The formation of low-mass stars occurs in dense cores inside molecular clouds, although the actual mechanism by which these cores accumulate material is still disputed (ambipolar diffusion vs. turbulence: Shu et al. 2000; Hartmann et al. 2001). In any case, through the loss of turbulent and/or magnetic support, dense cores contract towards a ‘critical state’, after which gravitational collapse starts and infall occurs onto a central object, a ‘protostar’. Observers distinguish such protostars in Class 0 objects, where the circumstellar envelope is much more massive than the star and accretion rates are high, and Class I objects, where star and envelope have similar masses and accretion rates have dropped (see André et al. 2000 for a review). During these stages, most (99%) of the angular momentum of the core is carried away by bipolar outflows, the formation of binary stars, and magnetic fields. The remaining 1% leads to the formation of the circumstellar disks commonly observed in subsequent stages of pre-main sequence stars (Mundy et al., 2000). This scenario is convincing, but many fundamental questions remain unanswered regarding the stages before formation of a central luminous object, the so-called pre-stellar cores. Does the collapse start from a state of dynamical equilibrium? When does a rotating structure form, and how important are the effects of flattening?
Detailed kinematical studies have been carried out for the Class I object LDN 1489 (Hogerheijde, 2001) and the Class 0 object IRAM 04191 (Belloche et al., 2002). These authors used the HCO+ and CS molecules, respectively, to trace the velocity field. However, at the low temperatures (10 K) of pre-stellar cores, most neutral molecules freeze out onto dust grains. In particular, the CO and CS molecules freeze out at (H2) 105 cm-3, so that these species (as well as HCO+) trace the outer parts of the cores (Bacmann et al., 2003; Tafalla et al., 2004). The more volatile N2 molecule remains abundant at these densities, making N2H+ and N2D+ better tracers of pre-stellar core nuclei than CO and CS (e.g., Bergin & Langer 1997; Crapsi et al. 2004). However, at the very centers of the cores, where 106 cm-3, even N2 freezes out, causing N2H+ and N2D+ to disappear from the gas phase (Bergin et al., 2002; Belloche & André, 2004). One of the few molecules that do not suffer from this depletion effect is H2D+. This paper explores the use of H2D+ as kinematic tracer of the centers of pre-stellar cores. We focus on the ‘prototypical’ pre-stellar core LDN 1544 in the Taurus molecular cloud (=140 pc) which has been well characterized by observations and models. Preliminary results of this work appeared in Van der Tak et al. (2004).
The structure of this paper is as follows. After the data and the radiative program have been introduced (§§ 2, 3), we test models of quasi-static collapse mediated by ambipolar diffusion, which fit previous observations of LDN 1544, in spherical (§ 4) and axial (§ 5) symmetry. More general spherically symmetric free-fall models are discussed in § 6. Sect. 7 tests the adopted molecular abundance structure of the core against chemical models. The possibility of dynamic rather than quasi-static collapse is considered in § 8. The sensitivity of the results to the adopted collisional cross sections for H2D+ is examined in § 9. Sect. 10 lists the conclusions and future prospects of this work.
2 Data
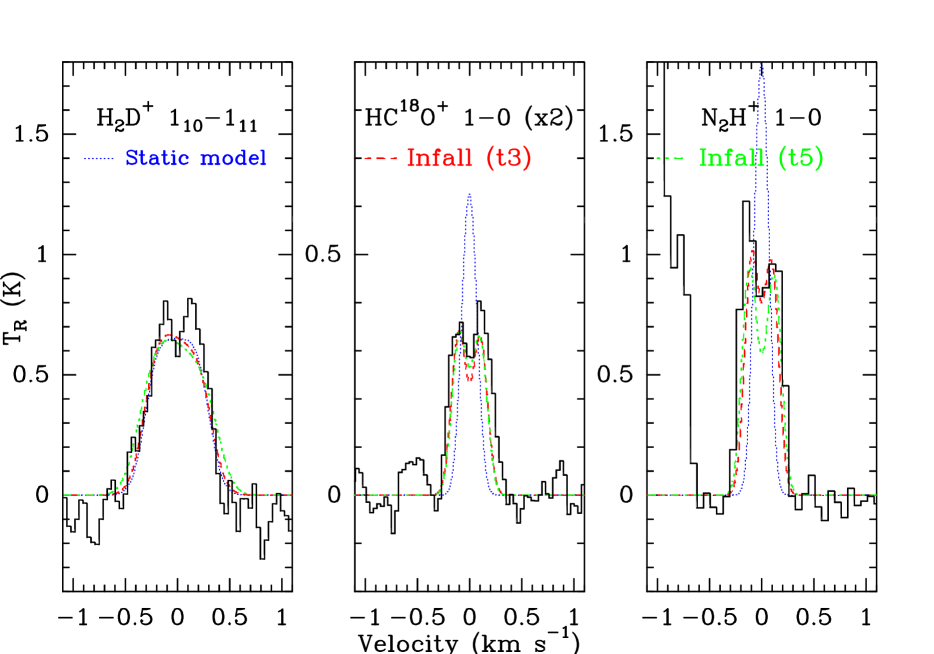
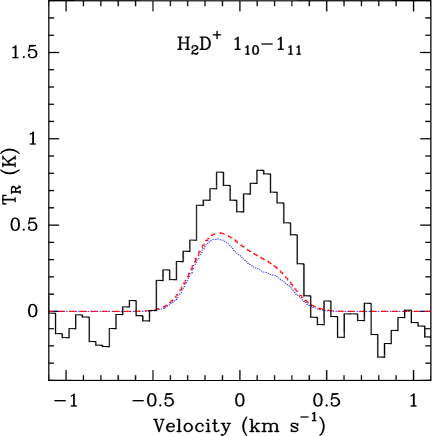
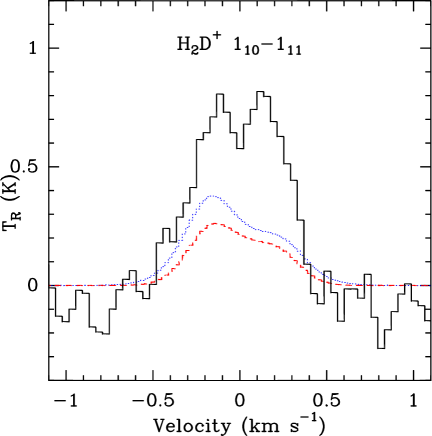
The line profile of H2D+ observed toward the ‘dust peak’ of LDN 1544 in October 2002 (Caselli et al., 2003) suggested a double-peaked shape but was of poor quality with low signal to noise. Therefore the source was included in our December 2003 CSO observations, which will be presented by Caselli et al. (in prep.). The left panel of Figure 1 shows the combined data at the central position, which has an rms noise level of =0.11 K per 0.04 km s-1 channel. In this spectrum, the H2D+ line profile is clearly double-peaked, like the profiles of the HC18O+ and N2H+ 1–0 lines, observed by Caselli et al. (2002a) and shown in the central and right panels of the figure. To quantify the similarity between these lines, we fitted two Gaussians to the profiles and found that each line is well described by two thermal components at =7–10 K, separated by 0.26 km s-1 (Table 1).
| Line | |||
|---|---|---|---|
| km s-1 | km s-1 | km s-1 | |
| H2D+ (110–) | 7.07(3) | 0.29(7) | 0.28–0.34 |
| 7.38(3) | 0.27(4) | ||
| HC18O+ (1–0) | 7.04(1) | 0.18(3) | 0.10–0.12 |
| 7.28(1) | 0.23(3) | ||
| N2H+ (1–0, =10–11) | 7.08(1) | 0.19(1) | 0.11–0.13 |
| 7.33(1) | 0.20(2) | ||
| a Thermal line width at =7 and 10 K. | |||
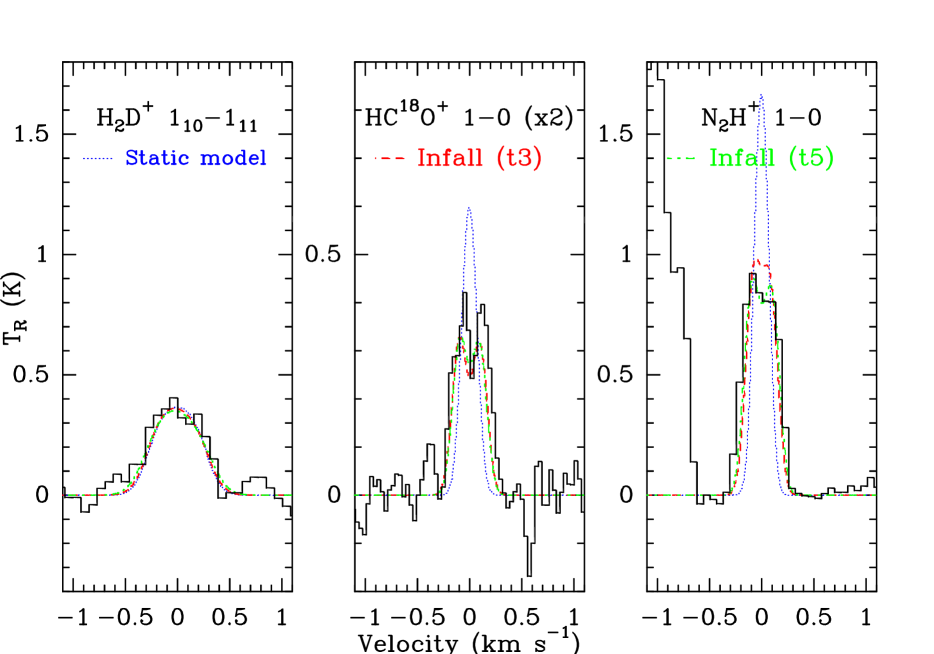
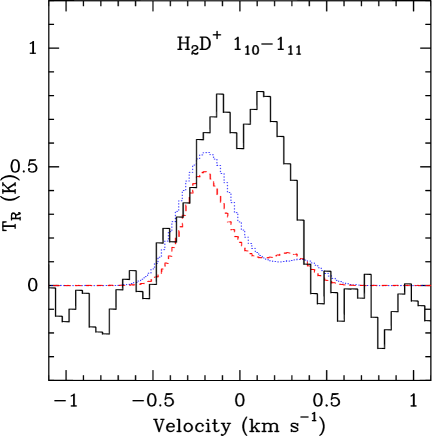
The H2D+ line has also been detected at positions 20′′ offset from the dust peak, where the line is only half as strong, suggesting a centrally peaked H2D+ abundance (Caselli et al., 2003). Figure 2 shows the line profiles of H2D+ and of HC18O+ and N2H+ (from Caselli et al. 2002a), as averages of observations taken at 20′′ North, South, East and West offsets. For H2D+ and N2H+, neither these ‘average offset’ spectra appear double-peaked, nor the individual spectra. In contrast, the average HC18O+ spectrum at the offset position is clearly double-peaked.
The H2D+ line profile towards the dust peak could be affected by absorption in the outer parts of the core, as seen in the =1–0 lines of CS and HCO+ (Tafalla et al., 1998) and N2H+ (Williams et al., 1999). Absorption is not seen for DCO+ 2–1 (Caselli et al., 2002a) but this may be an excitation effect. Analogously, the low H2D+ intensity and lack of strong central absorption at the offset position may be an excitation effect. To clarify these points, detailed radiative transfer models have been run for H2D+, as described in the following sections.
3 Model setup
The line profiles of H2D+, HC18O+ and N2H+ toward LDN 1544 have been modeled with the Monte Carlo program by Hogerheijde & van der Tak (2000)111http://www.mpifr-bonn.mpg.de/staff/fvandertak/ratran/, which can treat spherical and axisymmetric geometries. For HC18O+ and N2H+, we use molecular data from the database by Schöier et al. (2005)222http://www.strw.leidenuniv.nl/moldata/. For H2D+, collisional rate coefficients have not been calculated, so we use scaled radiative rates (Black et al., 1990), which probably have an uncertainty of a factor of 3–10. Section 9 investigates the sensitivity of the model results to the adopted rate coefficients.
Modeling of the N2H+ =10 line concentrates on the lowest frequency =1011 hyperfine component, which has an optical depth of only 3.7% of the total transition. We treat this line as if it were an isotopic version of N2H+: molecular excitation and line formation are calculated with the N2H+ abundance reduced by 27. Similarly, to model the HC18O+ =10 line, an oxygen isotope ratio of 16O/18O=500 was adopted. We do not model H13CO+ spectra because the line profile is complicated by hyperfine structure (Schmid-Burgk et al., 2004).
4 Spherically symmetric models

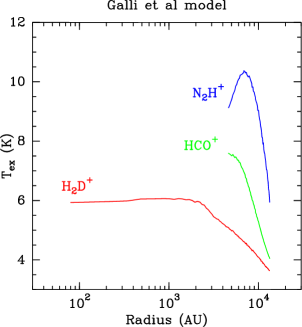
The spherical models have inner and outer radii of 80 and 13000 AU, on a 100-point grid, logarithmically spaced. Figure 3 shows the adopted temperature and density structure, taken from Galli et al. (2002), as well as the adopted molecular abundance profiles. For HCO+ and N2H+, we use abundance profiles from Caselli et al. (2002b) (Model 3 with a low ionization rate and a high sticking coefficient, which fits their data best), and assumed zero abundance inside =2500 AU. The distribution of HC18O+ has a central hole because its chemical precursor, CO, freezes out onto dust grains at (H2)105 cm-3. The N2H+ distribution continues further inward and has a hole at smaller radii, where N2 freezes out. The assumption of an N2H+ ‘hole’ of 2500 AU was already needed by Caselli et al. (2003) to reproduce the large H2D+ abundance at the center of LDN 1544. For H2D+, we initially assumed a central abundance of 110-9, dropping by a factor of 5 at a radius of 20′′ (2800 AU) (Van der Tak et al., 2004) as suggested by the observations of Caselli et al. (2003).
For the velocity field, we first adopt static models, with zero velocity at all radii, and second models with ‘infall’ velocity fields. There are several competing theories for the velocity field of collapse onto a protostar. Here we consider models by Ciolek & Basu (2000), which assume that protostellar collapse is quasi-static and regulated by magnetic pressure. Specifically, we model their simulations ‘t3’ and ‘t5’ which correspond to times of 2.660 and 2.684 Myr after the start of core collapse. At earlier times, the infall speed is very low, while later times are implausible due to the short time spent in these phases. We consider these specific infall models because they are known to reproduce observations of HCO+ and N2H+ toward LDN 1544 (Caselli et al., 2002a). Sections 6 and 8 treat more general collapse models. Note that the velocity field in the simulations by Ciolek & Basu is not spherically but axially symmetric with an axis ratio of 0.3 (see their Figure 4). Adopting these velocity fields in spherical symmetry is therefore a simplification; however, the assumed profiles are quite similar to those of collapsing Bonnor-Ebert spheres, as recently shown by Myers (2005). Section 5 will present fully consistent, two-dimensional models with the velocity field of Ciolek & Basu. For the turbulent broadening, Doppler parameters between 0.05 and 0.25 km s-1 were tried. Smaller values of are overwhelmed by thermal broadening; larger values do not fit the data. Variations of with radius are considered in Section 9.
Figure 1 shows that the total widths of the H2D+, HC18O+ and N2H+ ground-state lines can be matched using either velocity field. The best-fit static model has =0.15 km s-1, while =0.05 km s-1 gives the best fits with the infall models. However, the observed double-peaked line shape rules out the static model, both at the dust peak and at the 20′′ offset position. Using =0.05 km s-1 the infall models can reproduce the HC18O+ and N2H+ line profiles at both positions (Figure 2). The data do not allow to decide between the ‘t3’ and ‘t5’ solutions. However, none of these models reproduces the double-peaked H2D+ profile seen at the central position.
One reason for the lack of a central dip in the synthetic H2D+ spectrum may be that the model has H2D+ abundant at the core center, where infall velocities are low according to Ciolek & Basu (2000). Therefore we have tested the possibility that H2D+ has a shell-type distribution like HC18O+ and N2H+. The H2 molecule is too light to freeze out on dust grains and cause depletion of H2D+, but instead, conversion into D2H+ and D in the gas phase (e.g., H2D+HDD2H+H2) may cause a central H2D+ hole. Formation of multiply deuterated H is expected at the temperature and density of the center of LDN 1544 (Roberts et al., 2003; Walmsley et al., 2004). Support for these theories comes from the recent detection of D2H+ towards the pre-stellar core LDN 1689N (Vastel et al., 2004).
We have run models with the H2D+ abundance set to zero inside inner radii of 500–2500 AU (in steps of 500 AU), but none of these models gives a double-peaked H2D+ line profile. The problem is that the Ciolek & Basu (2000) models predict infall velocities of 0.1 km s-1 at the radii where H2D+ is abundant, much less than the observed peak separation of 0.26 km s-1 (Table 1). Increasing the outer radius of the H2D+ shell from 3000 AU to 6000 AU gives too strong line intensities at the offset position, but does produce double-peaked H2D+ profiles at the center. However, the two peaks are not equally bright as observed, but the blueshifted peak is twice as strong as the redshifted one, a phenomenon known as ‘infall asymmetry’. Therefore it seems that the H2D+ line shape cannot be explained with the physical and geometrical structure adopted so far. Before changing the adopted physical structure of the core, we explore deviations from the hitherto assumed spherical symmetry.
5 Axisymmetric models
Maps of dust continuum and molecular line emission of LDN 1544 show a flattened structure (Ward-Thompson et al., 1999; Caselli et al., 2002a). For example, the 1300 m dust continuum, which should be representative of the surface density distribution, has a major axis of 25 (21000 AU), an axis ratio of 1.7, and a position angle of 45∘ for the major axis. Therefore we explore the effects of flattened geometry on the line profiles.
We have constructed two-dimensional radiative transfer models with inner and outer radii of 70 and 20000 AU, on a 3030 grid, logarithmically spaced in both and . The density structure is as described by Ciolek & Basu (2000): an ‘infall disk’ with a flaring angle of 15∘ and an inclination of 74∘. We adopt a time of 2.660 Myr, which gives the best fit to millimeter-wave dust continuum observations (Ciolek & Basu, 2000). The radial infall velocity is zero at cloud center and edge, and peaks at 0.14 km s-1 at a radius of 0.03 pc. For the gas and dust temperatures, we tried a uniform value of 10 K (as in the model of Ciolek and Basu) and the radial distribution by Galli et al. (2002) (assumed vertically isothermal). The abundance profiles of N2H+, HC18O+ and DCO+ were again taken from Caselli et al. (2002b), Model 3, and for H2D+, we used the profile described in § 4.
These models reproduce the observed spatial distribution of the DCO+ 2–1 and N2H+ 1–0 lines (Caselli et al., 2002a), and also predict the correct line shape for HC18O+ and N2H+. However, they predict a single-peaked H2D+ line, which is not observed (Fig. 4).
Another possible cause of the double peaked H2D+ line profile is rotational motion of the central part of the core. For example, Belloche et al. (2002) found the Class 0 object IRAM 04191 to rotate at an angular rate of 3.910-13 s-1 inside a ‘centrifugal radius’ of 3500 AU. We have added rotation to the velocity field by Ciolek & Basu (2000), while keeping the density and temperature structure from the previous models. Rotation rates between =110-13 and 210-12 s-1 were tried, inside =3000 and 6000 AU. Larger values of are ruled out by the lack of a velocity shift of the H2D+ profiles at the offset positions, and also by the interferometric observations of N2H+ 1–0 by Williams et al. (1999). We find that the H2D+ line profile is hardly changed from the non-rotating case for =3000 AU. For =6000 AU, the H2D+ line is considerably broadened, and the total width of the observed H2D+ profile limits to 510-13 s-1. None of these models predict double-peaked line shapes. In general, both flattening and rotation appear unimportant for LDN 1544 on the scales probed by single-dish observations.
6 Alternative temperature and density structures
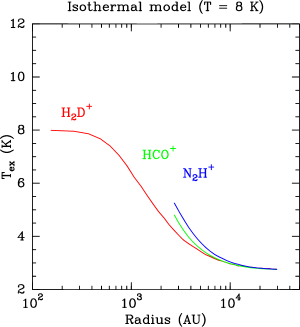
The reason that the models in §§ 4 and 5 do not indicate H2D+ self-absorption may be that the H2D+ excitation temperature is almost constant in the range of radii (3000 AU) where H2D+ is abundant (H2D+/H2 = 10-9). In particular, the models from § 4 with Galli’s temperature distribution have =5.8–5.6 K inside =3000 AU (Fig. 5, top), while the isothermal models of § 5 have =8.8–8.2 K at these radii.
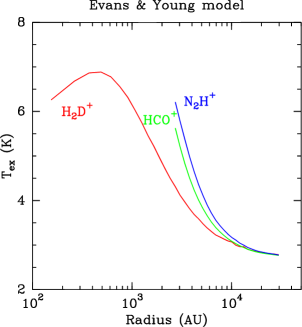
In search of an excitation temperature gradient, we went back to spherically symmetric models and adopted the density and dust temperature distributions by Evans et al. (2001), with gas temperatures calculated by Young et al. (2004). In these models for LDN 1544, the density continues to rise toward the center, rather than flattening off as in the model of Ward-Thompson et al. (1999). As a consequence, drops from 6.9 to 5.5 K at radii of 500-2500 AU (Fig. 5, middle).
Combining this physical structure with velocity field ‘t3’ from Ciolek & Basu (2000), the H2D+ profile remains single peaked. This result holds also when adopting constant infall speeds up to 0.2 km s-1. Larger infall speeds are inconsistent with the HC18O+ and N2H+ data. Even an inward increasing velocity profile, with =104 AU and =0.1 km s-1, fails to produce a double peak (Fig. 6). Adopting =103 AU and =0.2 km s-1, which mimics the ‘t5’ velocity field (Caselli, 2003) does not change this result appreciably. Furthermore, applying central holes in the H2D+ abundance distribution, with radii of 500-1500 AU, changes the total intensity of the line, but not its shape.
To prevent from dropping off at the very center, we took the more drastic step of forcing a uniform , while keeping the density power law structure by Evans et al. Values of =6 K, 8 K, 10 K and 12 K were tried. Fig. 5 (bottom) shows the profile for =8 K. The H2D+ profiles for these models show a classic ‘infall asymmetry’ for abundances 10-9, or a broad peak for lower abundances. The observed profile with two peaks of equal strength is not reproduced. Leaving the dust temperature unchanged or setting it equal to makes no difference to these results.
7 Self-consistent chemical model
The rate of formation of H2D+ by the reaction of H with HD depends mainly on the cosmic-ray ionization rate which is not expected to change within the pre-stellar core. However, the main destruction channel of H2D+ is the reaction with CO, the abundance of which is expected to decrease significantly at low temperatures and high densities due to freeze-out on dust grains. The models so far take depletion into account in a simplified way by considering ‘jumpy’ H2D+ abundance profiles. This section considers models that compute the abundances of H and its isotopomers self-consistently across the LDN 1544 core. For that we adapted the model of H chemistry in young protoplanetary disks developed by Ceccarelli & Dominik (2005). These models ignore the effect of dynamics on the chemistry. Briefly, the model computes the abundances of H, H2D+, D2H+ and D by solving the chemical network for these species, which is mostly governed by the CO depletion and the cosmic-ray ionization rate (Roberts et al. 2003; Walmsley et al. 2004; see the detailed discussion in Ceccarelli & Dominik 2005). The model uses the ‘fast’ rate for the H + HD reaction (Roberts et al., 2003) and 920 K for the binding energy of CO on the grain surface (Bergin & Langer, 1997). The papers by Roberts et al. and Walmsley et al. discuss the uncertainties of the other relevant chemical reation rates such as the dissociative recombination of H2D+, D2H+ and D. The role of cosmic rays is twofold: on the one hand, they set the ionization degree in the gas, and therefore the total abundance of H and its isotopomers in the region where CO is depleted. The larger the ionization degree, the larger the absolute abundance of H in all its isotopic forms. Second, the cosmic rays regulate the desorption of CO molecules from icy grain mantles back into the gas phase. The model includes ‘spot heating’ of grains by cosmic ray impacts, but no non-thermal desorption mechanisms which are much less effective (Shen et al., 2004). The larger the cosmic-ray flux, the higher the CO gas-phase abundance, and the lower the abundance of the deuterated forms of H.

The model assumes that at time =0, all CO is in the gas phase, so that the CO abundance is equal to the canonical value with respect to H2 (e.g., Frerking et al. 1982). As time passes, the CO molecules condense out onto the grain mantles and disappear from the gas phase. The time scale of the CO depletion is set by the density and temperature, which are taken equal to those computed in the models of Galli et al. and Evans et al., previously described. The result is a zone where the increased CO depletion leads to an enhanced H2D+/H ratio, namely an increased H2D+ abundance (see also Caselli et al. 2003 and Ceccarelli et al. 2004). Our computed H2D+, D2H+ and D abundances coincide with those calculated by Roberts et al. (2003) and Walmsley et al. (2004) when the same densities are considered.
Figure 7 shows an example of the computed H2D+, D2H+ and D abundance profile across LDN 1544. Also shown is the electron fraction, which equals the total ionization. In these highly shielded regions, most charge comes from molecules, not from metals, which are also expected to be highly depleted (Caselli et al., 2002b). Note that in the very inner region, the H2D+/H and D2H+/H abundance ratios have a ‘plateau’, whereas the D/H abundance ratio keeps increasing. The result is a ‘hole’ in the H2D+ and D2H+ abundances, because D becomes the charge carrier when the CO depletion is larger than 30. The result that D is the dominant ion at the centers of pre-stellar cores was found before by Roberts et al. (2003) and Walmsley et al. (2004); adopting the temperature and density structure from Young et al. (2004) for LDN 1544, it happens at AU. The H2D+ line profiles computed from these models depend on two major parameters: the cosmic-ray ionization rate and the time (for the CO depletion). We ran models varying both parameters for the two physical structures of the core, the Galli et al. and Evans et al. structure respectively. We considered ages of 0.05, 0.1 and 1.0 Myr, and fixed the cosmic-ray ionization rate at the canonical value of 310-17 s-1 (Van der Tak & van Dishoeck, 2000). The model does not consider any shielding of cosmic rays, as in Caselli (2003).
Since the central CO–free zone grows in time, the strengths of isotopic CO lines constrain the chemical age. With the velocity field of Ciolek & Basu (2000), we calculate an intensity for the C18O 1–0 line in the 22′′ beam of the IRAM 30m telescope of 4.3 K for =0.05 Myr, 3.5 K for 0.1 Myr and 1.5 K for 1.0 Myr. The observed strength of 5 K (Caselli et al., 2002a) thus suggests an age of 0.1 Myr for LDN 1544. It is not clear if these ages are compatible with our assumption of a static cloud. Models including both chemistry and dynamics (e.g., Rodgers & Charnley 2003; Aikawa et al. 2005) are needed to address this issue.
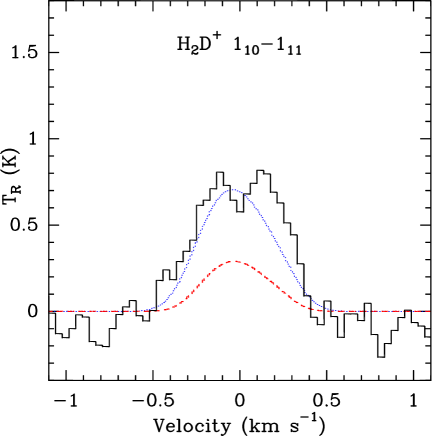
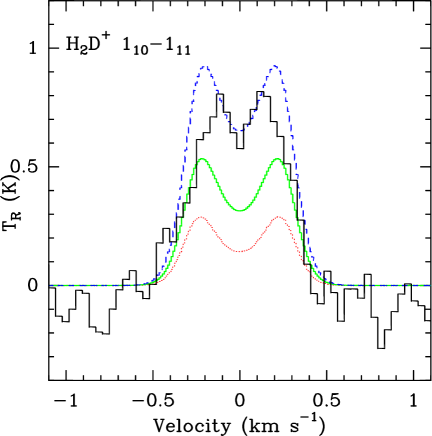
To model the H2D+ line profile, we assume an ortho/para ratio of unity as appropriate for low temperatures and high densities, although the exact amount of molecular depletion may make a factor of 2 difference (Pagani et al. 1992; Walmsley et al. 2004). Figure 8 shows the H2D+ line profiles calculated for a constant infall velocity of 0.2 km s-1 and for the Ciolek & Basu velocity field. The synthetic profiles are double peaked, but show strong infall asymmetry while two peaks of equal strength are observed. The strong self-absorption makes the emission 50% weaker than observed. At the offset position, the emission is also predicted to be asymmetric, and also 50% weaker than observed.
These models seem to overestimate the depletion of CO and the abundance of H2D+. Chemical ages 0.05 Myr do not seem plausible, but the age is uncertain through the dust opacity coefficient, which makes the density uncertain by a factor of two. Alternatively the gas temperature (which controls the emission) is higher than the dust temperature (which controls the depletion). The binding energy of CO to the grain surface may also have been overestimated, so that CO does not stick to the surface as well as assumed. We have not considered the reduced cosmic-ray ionization rate which previous studies of the LDN 1544 core indicate in this source (Caselli et al. 2002b; Tafalla et al. 2004), since the CO depletion would be even higher, implying a worse match to the data.
8 Alternative kinematics
The infall model by Ciolek & Basu (2000) is a magnetically mediated, ‘quasi-static’ collapse with relatively slow infall velocities. The collapse may instead be ‘dynamic’ which means that the gas never reaches equilibrium. The most extreme case is the Larson-Penston collapse (e.g., Zhou 1992) where the velocity reaches many times the sound speed. We modeled the H2D+ line with such a velocity profile, but find that emission is predicted at much higher velocities than observed.
Hydrodynamic simulations by Hunter (1977) show the existence of a continuum of solutions between the extreme static and dynamic cases. The solutions for the density at time and radius are
and the velocity (directed inward) follows
where is the sound speed, and is a dimensionless parameter. The Larson-Penston collapse has while for the quasi-static (Shu) collapse.
As examples of infall models ‘intermediate’ between quasi-static and fully dynamic collapse, we have run models for Hunter’s cases 11b and 11d which have and respectively. The gas and dust temperatures in these models are equal at 10 K, corresponding to a sound speed of 0.19 km s-1. Fig. 9 presents synthetic line profiles for Model 11d. Results are shown for the case of a constant H2D+ abundance and of an inner hole in the H2D+ distribution. These models have peaks at the observed velocities, but with ‘infall asymmetry’: the blueshifted peak is stronger than the redshifted one. The results of Model 11b are similar, but with this asymmetry more pronounced.
9 Effect of the collisional rate coefficient
Another potentially important parameter for the H2D+ line formation is the collisional rate coefficient (CRC). To quantify the sensitivity of our model results on the CRC, we have run models with the CRC increased and decreased by factors of 3 and 10. These models use the power-law density profile from Evans et al. (2001), the temperature profile from Young et al. (2004) and the H2D+ abundance profile from Ceccarelli & Dominik (2005). Since the previous sections indicate that the details of the infall velocity field play a minor role for our models, we simplify the kinematics to a ‘step function’ in , the turbulent line width. The observations suggest that is larger in the (emitting) central part of the core than in the (absorbing) outer layers, so we adopt =0.1 km s-1 at radii 103 AU and =0 outside this radius. The model does not include any systematic radial motions, but the increased at the center is presumed to arise in infall. This setup implies the existence of infall motions, while the results do not depend on the specific infall model. Note that thermal broadening is added to the turbulence at all radii.
Figure 10 shows the results of models with the CRC increased by factors of 3 and 10 above the value from Black et al. (1990). The line strength is seen to scale with the CRC; this trend continues for the models with the CRC decreased below ‘standard’ which are not shown. The shape of the H2D+ profile is seen not to depend on the CRC: both the emission from the core and the absorption in the outer layers scale with the CRC. For the adopted model parameters, the best fit to the observed H2D+ profile would be obtained by increasing the CRC by a factor of 5. However, this number depends critically on several parameters, particularly (H2), and the H2D+ abundance. This is why we refrain from recommending a value for the CRC at this point. Even though (H2) and can be obtained from other observations (as we have done), the H2D+ abundance cannot. Therefore, for the time being, H2D+ abundances can only be determined to factors of 10 accuracy. We recommend theoretical calculations of the CRC of H2D+ to improve this situation.
The fact that the simplified kinematics give a better fit to the observed H2D+ profile than the models in Section 6 implies that the infall motions toward LDN 1544 are very small, in good agreement with the conclusion from Williams et al. (1999) that the infall speed is much smaller than the thermal, rotational and gravitational speeds in this source. The observed intensity at the 20′′ offset position of =0.4 K is well reproduced by the same model that fits the central spectrum. The model predicts a 20% absorption at the line center, which the present data do not rule out. However, better spectra at offset positions are needed to confirm this prediction.
10 Conclusions
Radiative transfer modeling of line profiles of H2D+, HC18O+ and N2H+ in the pre-stellar core LDN 1544 shows that previous descriptions of the temperature, density and velocity structure, that reproduce HC18O+ and N2H+ data, do not fit H2D+ data, which probe smaller radii. At least two modifications are required at these radii, which affect H2D+, but not HC18O+ or N2H+.
First, to make the excitation temperature of H2D+ increase inward, the density cannot flatten off as proposed by Ward-Thompson et al. (1999), but must continue to increase as in the models by Evans et al. (2001). In addition, only very small inward decreases of the gas temperature are allowed. Observations of NH3 toward a sample of pre-stellar cores also suggest a constant kinetic temperature with radius (Tafalla et al. 2002, 2004). The same result is obtained from observations of CO isotopes toward the pre-stellar core B 68 (Bergin et al., 2005), suggesting that current models of pre-stellar cores either underestimate the dust temperature because of changes in the dust opacity, or overestimate the gas-grain thermal coupling because of grain growth. However, the NH3 and CO observations probe larger radii than H2D+, and interferometric observations of NH3 would be valuable.
Second, the infall velocity needs to increase with radius down to small radii. If cloud collapse is quasi-static and mediated by ambipolar diffusion, the central region supported by thermal pressure, where the infall speed drops to zero, must be smaller than in the models by Ciolek & Basu (2000). Alternatively, the collapse may be ‘mildly’ dynamic, indicated by values of 1–3 for the parameter (Hunter, 1977; Foster & Chevalier, 1993). Highly supersonic infall velocities, as well as large-scale rotation, are ruled out.
Alternatively, the central dip on the H2D+ profile is due to absorption in the outer parts of the core, as seen for CS, HCO+ and N2H+. However, such absorption is not seen for DCO+ 2–1, nor in H2D+ at offset positions. Also, to produce an absorption as narrow as observed, the outer layers of LDN 1544 must have essentially zero infall and turbulent motions, consistent with evidence from CS, HCO+ and N2H+ (Williams et al., 1999). To test this ‘absorption’ hypothesis, sensitive mapping of the H2D+ line and of DCO+ 1–0 are needed.
In the future, making full use of H2D+ as kinematic probe requires maps at higher sensitivity and spatial and spectral resolution than the CSO can offer. Other single-dish telescopes (JCMT, APEX) can fulfill some of these requirements, but not all. Therefore, for a real breakthrough, interferometric observations will be crucial. The SMA will enable case studies, but only ALMA will have the sensitivity to probe many pre-stellar cores within reasonable times. The interpretation of the data will require good observational constraints of the gas temperature and density. In addition, theoretical calculations of the collisional rate coefficients of H2D+ are urgently needed.
If the current observations cannot be matched with any of these modifications, then we speculate that the doubled-peaked H2D+ line profile in LDN 1544 is caused by the presence of two protostellar condensations, orbiting each other, in the core center. We may be witnessing the birth of a binary protostellar system. Once again, interferometer observations are required to test this hypothesis.
Acknowledgements.
The authors thank Malcolm Walmsley, Arnaud Belloche, Neal Evans and the anonymous referee for useful comments on the manuscript, Glenn Ciolek and Kaisa Young for sending their model results in electronic form, and Aurore Bacmann and Antonio Crapsi for help with the observations. P.C. acknowledges support from the MIUR grant ‘Dust and molecules in astrophysical environments’.References
- Aikawa et al. (2005) Aikawa, Y., Herbst, E., Roberts, H., & Caselli, P. 2005, ApJ, 620, 330
- André et al. (2000) André, P., Ward-Thompson, D., & Barsony, M. 2000, Protostars and Planets IV, 59
- Bacmann et al. (2003) Bacmann, A., Lefloch, B., Ceccarelli, C., et al. 2003, ApJ, 585, L55
- Belloche & André (2004) Belloche, A. & André, P. 2004, A&A, 419, L35
- Belloche et al. (2002) Belloche, A., André, P., Despois, D., & Blinder, S. 2002, A&A, 393, 927
- Bergin et al. (2002) Bergin, E. A., Alves, J., Huard, T., & Lada, C. J. 2002, ApJ, 570, L101
- Bergin & Langer (1997) Bergin, E. A. & Langer, W. D. 1997, ApJ, 486, 316
- Bergin et al. (2005) Bergin, E. A., Maret, S., & van der Tak, F. F. S. 2005, in The Dusty and Molecular Universe, ed. A. Wilson (ESA-SP 577), 185–190
- Black et al. (1990) Black, J. H., van Dishoeck, E. F., Willner, S. P., & Woods, R. C. 1990, ApJ, 358, 459
- Caselli (2003) Caselli, P. 2003, Ap&SS, 285, 619
- Caselli et al. (2003) Caselli, P., van der Tak, F. F. S., Ceccarelli, C., & Bacmann, A. 2003, A&A, 403, L37
- Caselli et al. (2002a) Caselli, P., Walmsley, C. M., Zucconi, A., et al. 2002a, ApJ, 565, 331
- Caselli et al. (2002b) —. 2002b, ApJ, 565, 344
- Ceccarelli & Dominik (2005) Ceccarelli, C. & Dominik, C. 2005, A&A, submitted
- Ceccarelli et al. (2004) Ceccarelli, C., Dominik, C., Lefloch, B., Caselli, P., & Caux, E. 2004, ApJ, 607, L51
- Ciolek & Basu (2000) Ciolek, G. E. & Basu, S. 2000, ApJ, 529, 925
- Crapsi et al. (2004) Crapsi, A., Caselli, P., Walmsley, C. M., et al. 2004, A&A, 420, 957
- Evans et al. (2001) Evans, N. J., Rawlings, J. M. C., Shirley, Y. L., & Mundy, L. G. 2001, ApJ, 557, 193
- Foster & Chevalier (1993) Foster, P. N. & Chevalier, R. A. 1993, ApJ, 416, 303
- Frerking et al. (1982) Frerking, M. A., Langer, W. D., & Wilson, R. W. 1982, ApJ, 262, 590
- Galli et al. (2002) Galli, D., Walmsley, M., & Gonçalves, J. 2002, A&A, 394, 275
- Hartmann et al. (2001) Hartmann, L., Ballesteros-Paredes, J., & Bergin, E. A. 2001, ApJ, 562, 852
- Hogerheijde (2001) Hogerheijde, M. R. 2001, ApJ, 553, 618
- Hogerheijde & van der Tak (2000) Hogerheijde, M. R. & van der Tak, F. F. S. 2000, A&A, 362, 697
- Hunter (1977) Hunter, C. 1977, ApJ, 218, 834
- Mundy et al. (2000) Mundy, L. G., Looney, L. W., & Welch, W. J. 2000, Protostars and Planets IV, 355
- Myers (2005) Myers, P. C. 2005, ApJ, in press; astro-ph/0501127
- Pagani et al. (1992) Pagani, L., Salez, M., & Wannier, P. G. 1992, A&A, 258, 479
- Roberts et al. (2003) Roberts, H., Herbst, E., & Millar, T. J. 2003, ApJ, 591, L41
- Rodgers & Charnley (2003) Rodgers, S. D. & Charnley, S. B. 2003, ApJ, 585, 355
- Schmid-Burgk et al. (2004) Schmid-Burgk, J., Muders, D., Müller, H. S. P., & Brupbacher-Gatehouse, B. 2004, A&A, 419, 949
- Schöier et al. (2005) Schöier, F. L., van der Tak, F. F. S., van Dishoeck, E. F., & Black, J. H. 2005, A&A, 432, 369
- Shen et al. (2004) Shen, C. J., Greenberg, J. M., Schutte, W. A., & van Dishoeck, E. F. 2004, A&A, 415, 203
- Shu et al. (2000) Shu, F. H., Najita, J. R., Shang, H., & Li, Z.-Y. 2000, Protostars and Planets IV, 789
- Tafalla et al. (1998) Tafalla, M., Mardones, D., Myers, P. C., et al. 1998, ApJ, 504, 900
- Tafalla et al. (2004) Tafalla, M., Myers, P. C., Caselli, P., & Walmsley, C. M. 2004, A&A, 416, 191
- Tafalla et al. (2002) Tafalla, M., Myers, P. C., Caselli, P., Walmsley, C. M., & Comito, C. 2002, ApJ, 569, 815
- Van der Tak et al. (2004) Van der Tak, F. F. S., Caselli, P., Walmsley, C. M. Ceccarelli, C., Bacmann, A., & Crapsi, A. 2004, in The Dense Interstellar Medium in Galaxies (Springer-Verlag), 549–552
- Van der Tak & van Dishoeck (2000) Van der Tak, F. F. S. & van Dishoeck, E. F. 2000, A&A, 358, L79
- Vastel et al. (2004) Vastel, C., Phillips, T. G., & Yoshida, H. 2004, ApJ, 606, L127
- Walmsley et al. (2004) Walmsley, C. M., Flower, D. R., & Pineau des Forêts, G. 2004, A&A, 418, 1035
- Ward-Thompson et al. (1999) Ward-Thompson, D., Motte, F., & André, P. 1999, MNRAS, 305, 143
- Williams et al. (1999) Williams, J. P., Myers, P. C., Wilner, D. J., & di Francesco, J. 1999, ApJ, 513, L61
- Young et al. (2004) Young, K. E., Lee, J., Evans, N. J., Goldsmith, P. F., & Doty, S. D. 2004, ApJ, 614, 252
- Zhou (1992) Zhou, S. 1992, ApJ, 394, 204