11email: braun@astron.nl 22institutetext: National Radio Astronomy Observatory, Socorro, NM 87801, USA
22email: nkanekar@aoc.nrao.edu
Tiny H i Clouds in the Local ISM
We report deep, high spectral resolution WSRT H i 21cm observations of four high latitude compact radio sources, that have revealed a new population of tiny, discrete clouds in the diffuse ISM, with peak optical depths %, H i column densities of 0.4–8 cm-2 and core temperatures of 20–80 K. Imaging detections confirm these low column densities and imply linear core dimensions of a few thousand AU, assuming a distance of 100 pc. The physical origin of these tiny H i structures and their distribution in the ISM is at present unknown. Further observations will be required to determine whether they are a ubiquitous component of the ISM.
Key Words.:
ISM: clouds – ISM: bubbles – Stars: winds, outflows – (Galaxy:) solar neighbourhood1 Introduction
Despite more than three decades of H i 21cm absorption & emission studies, we still do not have a good understanding of the physical characteristics of the atomic component, one of the most important phases of the interstellar medium (ISM). Crucial observational lacunae include the morphology of neutral hydrogen “clouds”, the time-scales of their formation and destruction (i.e. whether they are transient or relatively stable structures), the H i column density distribution function, the nature of the equilibrium between “cold” and “warm” phases, etc. In recent times, there have been several indications of a surprising degree of small-scale structure in the atomic ISM. Perhaps the first of these was the observation of spatially variable H i absorption towards compact radio sources (e.g. Dieter et al. diet76 (1976); Davis et al. davi96 (1996); Faison et al. fais98 (1998)). In the most extreme cases, for example towards 3C138, there is evidence for changes of as much as = 0.1 in the H i opacity on transverse scales of 20 AU (Faison et al. fais98 (1998)). The simplest interpretation of these observations requires large variations in the volume density, n cm-3, assuming that all of the other relevant variables (specifically, the pathlength and the temperature) are kept fixed. However, as argued by Deshpande (desh00 (2000)), realistic ISM structure functions can lead to large variations of with small angular offsets, simply from statistical fluctuations in the effective pathlength with position. Further evidence for small-scale atomic structure stemmed from searches for time variability in the H i absorption seen toward pulsars (e.g. Frail et al. frai94 (1994)). However, the early claims for ubiquitous and significant time variations in have not been confirmed in more recent studies. (e.g. Johnston et al. john03 (2003); Stanimirovic et al. stan03 (2003)). A third line of evidence has come from observations of Na I observation toward nearby pairs of stars (eg. Watson & Meyer wats96 (1996); Points et al. poin04 (2004) and references therein), suggesting discrete absorption features in the local ISM with highly variable properties on scales of hundreds of AU. However, Points et al. (poin04 (2004)) note that Na I is not the dominant ion in diffuse clouds and it is thus possible that the above structures are not distinct physical entities but merely reflect fluctuations in local physical conditions, such as the temperature, pressure, electron density, etc.
2 Observations
We have recently undertaken a series of extremely sensitive H i absorption observations towards bright compact extra-galactic radio sources near the North Galactic Pole (NGP), with the Westerbork Synthesis Radio Telescope (WSRT). The initial motivation for these observations was the detection of H i absorption from a Warm Neutral Medium (WNM), even for temperatures as high as 104 K. Such an experiment was prompted by the detection of wide H i absorption by Kanekar et al. (kane03 (2003)), with velocity spreads corresponding to an equivalent temperature of 3500 K; these observations reached a optical depth sensitivity of per 1 km/s velocity channel. The NGP region was chosen to ensure that the lines-of-sight through the Galactic disk might be as short as possible and, therefore, relatively simple. Sensitive, high velocity resolution absorption spectra were acquired towards 3C286 (14.7 Jy, 12 hr integration), 3C287 (7 Jy, 9 hr), 4C+32.44 (5 Jy, 11 hr), and B2 1325+32 (1.4 Jy, 11 hr), by observing in an in-band frequency-switching mode, utilising a 1 MHz throw every 5 minutes inside a total bandwidth of 2.5 MHz, with a channel width of 0.5 km/s. The in-band frequency switching allowed exceptionally good band-pass calibration while providing 100% of observing time on-source. We achieved RMS optical depth sensitivities of 1.8 (for 3C286), 2.9 (for 3C287) and 4.0 (for 4C+32.44) at 1 km/s velocity resolution. These are the most sensitive H i 21cm absorption measurements of which we are aware. A somewhat lower sensitivity ( per 1 km/s) was obtained towards B2 1325+32, due to its lower flux density. Finally, we also used the simultaneously acquired total power spectra of the WSRT single dishes to derive sensitive H i emission profiles (with effective integration times of more than 100 hr) towards all four sources. The flux scale is based on the SEFD of the WSRT dishes at 1400 MHz of 30010 Jy/Beam. We emphasise that only a constant term has been subtracted from each spectrum (both absorption and emission) and not even a first order polynomial, let alone a higher order spectral baseline.
3 Results
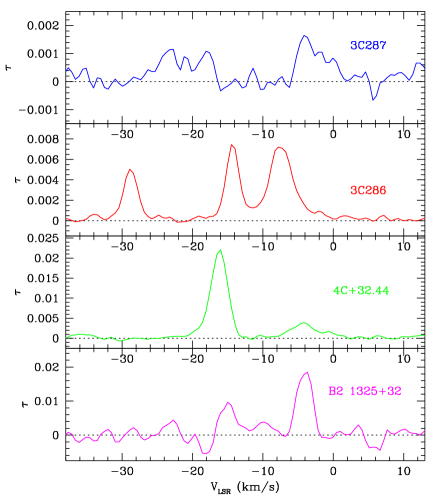
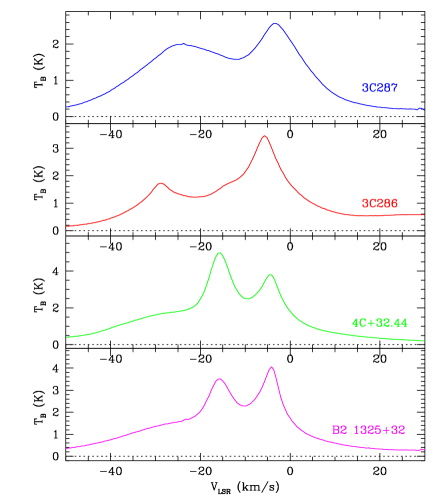
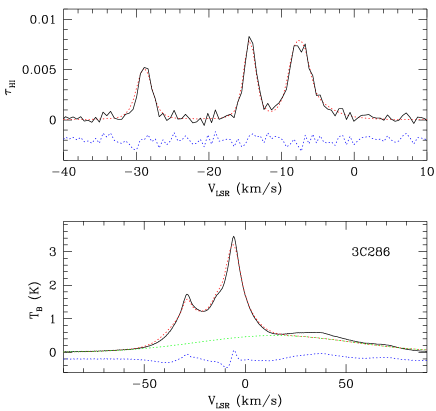
Since the primary motivation for the experiment was a search for broad, shallow absorption along “simple” high latitude lines of sight, we were surprised to find instead that multiple, narrow (FWHM 2–3 km/s) absorption features were detected at discrete line-of-sight velocities, with peak opacities in the range 0.1–2%. A representative cool phase spin temperature of K (corresponding to a thermal FWHM of 2.2 km/s) yields extremely low H i column densities, 0.4–8 cm-2, for these components. The detection of discrete absorption features was particularly surprising since the peak emission brightness seen in these directions (with the 35′total power beam) is only between 2 and 5 K. The absorption and emission spectra towards the four sources are compared in the top and bottom panels of Figure 1. It is striking that moderately nearby lines-of-sight (separation between 3C286 and 4C+32.44) show essentially uncorrelated absorption spectra, and only weakly correlated emission features. Only in the case of 4C+32.44 and B2 1325+32, which have an angular separation of only , is there a hint of similar velocity components having been detected. In all cases, the emission spectra show wide wings extending out to km/s, while the absorption is restricted to the velocity range to km/s. The very broadest emission in the spectra of Fig. 1(b) is actually due to so-called stray radiation, H i emission attenuated by 30 to 40 dB, but still detected in the far side-lobes of the telescope response when the bright Galactic plane happens to be above the local horizon.
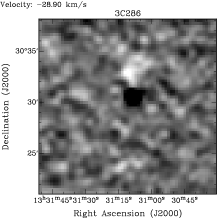
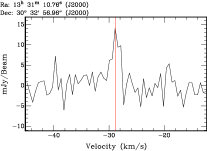
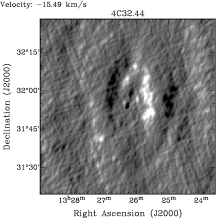
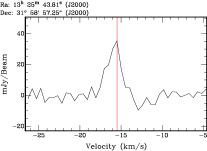
The same WSRT observations that provided the absorption spectra also allow an interferometric imaging search for emission counterparts. Cubes of H i line emission were produced at a range of angular resolutions (15, 30, 60 and 120″). Obtaining sufficient brightness sensitivity to achieve detections in emission typically required smoothing to 60″. At those velocities where total power emission exceeding about 1 K is seen in Fig. 1, compact emission clumps of 2–3 K brightness are detected at apparently random locations in the field, superposed on the poorly-sampled (by the interferometer) diffuse background emission. One such emission clump, immediately adjacent to the 3C286 line-of-sight is shown in Fig. 2(a). The intrinsic angular size of these clumps appears to be about 30″, while their FWHM line-widths are 1–2 km/s, corresponding to temperatures of 20–80 K. A representative peak column density for the clumps in the 3C286 field is N cm-2. At an assumed distance of, say, 100 pc, the clumps would have a size of AU, with a central volume density of cm-3.
An even more interesting emission structure is detected in the 4C+32.44 field. The line-of-sight toward this background source appears to intersect a 15′diameter shell of H i emission, as shown in Fig.2(b). Image quality is limited in Fig.2(b) by a non-ideal configuration and no primary beam correction has been applied. Although it may be a chance superposition, this apparent shell contains the G0III star HD 116856 at = (13:25:55.835,+31:51:40.629). The measured parallax of this star places it at pc, where the shell would have a diameter of pc. The stellar proper motion = (+14.73,43.40) mas/yr is directed to the SE. Peak N cm-2 is seen in this structure, with FWHM line-widths of 2–3 km/s. It seems possible that this structure is associated with the termination shock of a stellar wind.
4 Cloud models
Various approaches are used in the literature to constrain physical conditions from an analysis of H i emission and absorption spectra (eg. Kanekar et al. kane03 (2003), Heiles & Troland heil03 (2003)). An exhaustive comparison of the various methods is beyond the scope of the current paper, but will be addressed in Braun & Kanekar (brau05 (2005)). We simply note from the outset that while it is always possible to model both H i absorption and emission profiles as arising from the sum of multiple Gaussians, it is far from clear whether a plausible combination of physical conditions might exist along any real line-of-sight that would produce such an artificially simplistic observable (ie. very long, yet iso-thermal, and non-turbulent path-lengths). In fact, the most sensitive observations of both emission and absorption lines (cf. Fig. 1) show profiles that appear to be semi-Lorentzian, with narrow line-cores that merge smoothly into broader wings. As more sensitive data become available, an increasing number of broader Gaussians becomes necessary to fit such profiles.
Motivated by the non-Gaussian line profiles we have explored some simple, spherically symmetric, isobaric two-phase cloud models of the form:
| (1) |
| (2) |
where we further relate volume density to temperature using a constant thermal pressure = 1500 cm-3K. The gas temperature was allowed to vary between T and T, yielding an assumed thermal velocity dispersion of . The predicted H i absorption and total power emission spectra were calculated for a “cloud” placed at the central velocity of each observed feature in an attempt to simultaneously reproduce the observed spectra shown in Fig. 1. The most important free parameters in this process were the cloud scale-length, , the cloud distance, (which most strongly influences the predicted total power emission) and an impact parameter, . This last parameter was used to allow for the likely circumstance that each spherical model cloud may not be penetrated exactly on-axis by the background absorber. The two power-law indices of the scaled radius, and determine the characteristic line shapes in the cold core and warm halo respectively. Although these were, in principle, also free parameters, it was found that only minor variations from “standard” values of about =1/4 and =1/8 were needed. Our arbitrary choice of a transition temperature of 4000 K to separate the cool and warm phases is also non-critical. Comparable fits are possible with other choices of the transition temperature within a broad range. The broad-band ( 90 km/s FWHM) stray radiation contribution to the emission spectra is approximated by a simple Gaussian, rather than a physical component.
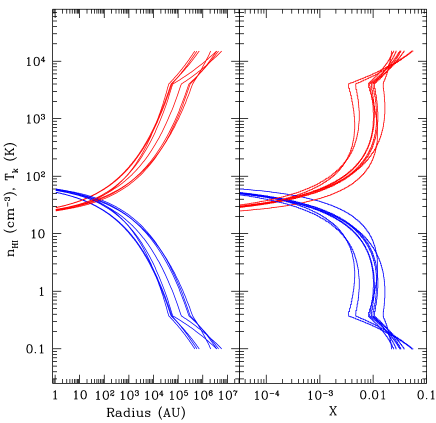
An illustration of the simultaneous emission and absorption line fitting is shown in the top panel of Fig. 3 for the 3C286 line-of-sight. A formal least squares fit has not been carried out here, but merely a -by-eye to illustrate the possibilities of this approach. The bottom panel of the figure shows the entire set of density and temperature profiles as well as the fractional distribution functions for the modelled clouds along all four lines-of-sight. This illustrates the basic similarities of the modelled features, although the apparent scale-lengths do vary by about an order of magnitude. The apparent distance used in reproducing the spectra was about 10 pc, and the typical half-density radius was 100 AU, although these were not very well-constrained given the very low angular resolution of our total power data (35 arcmin). These modelling results can be easily scaled to other assumed thermal pressures by a linear scaling of together with an inverse linear scaling of both and . For example, with a typical thermal pressure of only 150 cm-3K, comparable fits would be obtained at apparent distances of 100 pc and typical half-density radii of 1000 AU. Variations from the idealised spherical cloud symmetry would have a similar impact on apparent distances and sizes. The preserved quantity in these scalings is the distribution of column density over temperature (or more precisely line-width). The fractional column density at a particular density and temperature with respect to the total line-of-sight column density is plotted in the lower right panel of Fig. 3. Column densities of the cool cores are typically only a few percent of those in the warm envelopes. The total column densities of the modelled clouds vary between 5–35 cm-2. While it should be emphasised that the current attempts are fairly simplistic, it is interesting that we obtain scale lengths quite similar to those of the structures seen directly in emission in Fig 2. We also stress that our cloud model “temperatures” may not be wholly thermal in nature, but are likely to include a non-thermal, turbulent contribution.
5 Discussion
The narrow absorption features of Fig. 1 have the lowest column densities that have ever been detected in the CNM, two orders of magnitude lower than the mean CNM column density cm-2 of the “classical” McKee-Ostriker (mcke77a (1977)) model (see also Stanimirovic & Heiles stan05 (2005)). Our current results thus suggest that even the most diffuse regions of the Galaxy are populated by hitherto undiscovered, tiny distinct structures of very high density and temperature contrast. This implies substantial injection of fluctuation power on very small scales, whose source is presently unclear. The detection of a narrow shell-like structure with small transverse separation from a G0III star in one of our fields suggests that the stellar winds of intermediate mass stars might play a role in the formation of these tiny clumps, whenever such stars find themselves within a diffuse atomic structure. More distributed sources of energy injection might also lead to thermal condensation in a turbulent flow as discussed by Audit & Hennebelle (audi05 (2005)). These authors also demonstrate that local pressure equilibrium is still approximately preserved in the vicinity of condensations, despite a wide range of associated gas temperatures, consistent with the isobaric two-phase cloud models we develop in §4. The density and temperature distribution functions of our model clouds, Fig. 3 bottom right, also compare very favourably with those of Audit & Hennebelle (their Fig.8) in the highly turbulent regime.
We emphasise that the physical origin of these tiny H i structures and their general importance in the ISM is still unknown. Their very low column densities should cause them to evaporate rapidly (e.g. McKee & Cowie mcke77b (1977)). Perhaps the first issue that needs to be clarified is whether they are truly ubiquitous in the ISM. We plan to address this with high sensitivity WSRT absorption spectra towards a larger sample of bright high-latitude sources. Sensitive total power emission spectra with both higher angular resolution and a lower stray-radiation contribution using the Green Bank Telescope or Arecibo would also be invaluable. Clearly, more work needs to be done to fully characterise the nature of sub-structure in the diffuse ISM.
Acknowledgements.
The WSRT is operated by ASTRON with support from the Netherlands Foundation for Scientific Research (NWO).References
- (1) Audit, E., Hennebelle, P., 2005, A&A, 433, 1
- (2) Braun, R., Kanekar, N., 2005, in preparation
- (3) Davis, R. J., Diamond, P. J., Goss, W. M., 1996, MNRAS, 283, 1105
- (4) Deshpande, A. A., 2000, MNRAS, 543, 227
- (5) Dieter, N. H., Welch, W. J., Romney, J. D., 1976, ApJ, 206, L113
- (6) Faison, M., Goss, W. M., Diamond, P. J., Taylor, G. B., 1998, AJ, 116, 2916
- (7) Frail, D. A., Weisberg, J. M., Cordes, J. M., Mathers, C., 1994, ApJ, 436, 144
- (8) Heiles, C., Troland, T. H. 2003, ApJS, 145, 329
- (9) Johnston, S., Koribalski, B., Wilson, W., Walker, M., 2003, MNRAS, 341, 941
- (10) Kanekar, N., Subrahmanyan, R., Chengalur, C., Safouris, V. 2003, MNRAS, 346, L57
- (11) McKee, C. F., Cowie, L. L. 1977, 215, 213
- (12) McKee, C. F., Ostriker, J. P. 1977, 218, 148
- (13) Points, S. D., Lauroesch, J. T., Meyer, D. M. 2004, PASP, 116, 801
- (14) Stanimirovic, S., Weisberg, J. M., Hedden, A., Devine, K. E., Green, J. T. 2003, ApJ, 598, L23
- (15) Stanimirovic, S., Heiles, C. 2005, in preparation
- (16) Watson, J. K., Meyer, D. M., 1996, ApJ, 473, L127