A Highly Collimated, Young and Fast CO(2-1) Outflow in OMC1 South
Abstract
We present high angular resolution ( 1′′), sensitive CO(2-1) line observations of the region OMC1 South in the Orion Nebula made using the Submillimeter Array (SMA). We detect the CO(2-1) high velocity outflow that was first found by Rodríguez-Franco et al. (1999a) with the IRAM 30 m. Our observations resolve the outflow, whose velocity-integrated emission has a deconvolved width of 0.”89 0.”06 (390 AU) and a projected length of 48′′ (21,000 AU) with very high redshifted and blueshifted gas with velocities of about 80 km s-1. This outflow is among the most collimated ( 3∘) and youngest outflows (600 yr) that have been reported. The data show that this collimated outflow has been blowing in the same direction during the last 600 yr. At high velocities, the CO(2-1) outflow traces an extremely collimated jet, while at lower velocities the CO emission traces an envelope possibly produced by entrainment of ambient gas. Furthermore, we also detect for the first time a millimeter wavelength continuum source possibly associated with a class I protostar that we suggest could be the possible exciting source for this collimated outflow. However, the bolometric luminosity of this source appears to be far too low to account for the powerful molecular outflow.
1 Introduction
The OMC1-S (Orion Molecular Cloud 1 South) region is a young,
compact (40′′40′′) and highly active star formation
zone located about 100′′ south
of the Orion-KL region. At least three powerful molecular
outflows have been suggested to emanate from here. The first is a low velocity (10 km s-1)
bipolar SiO(5-4) outflow with a length of 30′′ in the NE(blueshift)-SW(redshift)
orientation, and that is centered at the position R.A.[J2000]=05:
35:12.8 and Dec.[J2000]=-05:24:11
(Ziurys, Wilson & Mauersberger 1990). A second quite extended ( 3′), collimated, low
velocity (5 km s-1) bipolar CO outflow, oriented
NE (blueshift)-SW (redshift) has been reported by Schmid-Burgk et al. (1990),
and its center is associated with the continuum radio
source 134-411 (Zapata et al. 2004a, 2004b).
Finally, there is a high velocity bipolar CO outflow, with a length of 0.07 pc (0.5′) and
velocities of 140 km s-1 towards the NW and 88 km s-1
to the SE (Rodríguez-Franco et al. 1999a, 1999b).
The center of this high velocity outflow was proposed to be
20′′ north of the 1.3 mm continuum source
FIR 4 (Rodríguez-Franco et al. 1999b). As all these outflows were detected with
single dish observations of modest angular resolution,
their relation is not clear.
There are also several relatively large Herbig-Haro outflows of length up to 2′ that appear to emanate from the vicinity of this region (HH 202, HH 269, HH 529, HH 203/204, HH 530, HH 625 and possibly HH 528) and that were found by Bally, O’Dell & McCaughrean (2000) and O’Dell & Doi (2003) at optical wavelengths. In particular, the HH 625 object is the first optical flow of the Orion Nebula that has been associated with an embedded molecular outflow (O’Dell 2003 and O’Dell & Doi 2003). This object was first detected by O’Dell & Wong (1996) and then they found associated faint features in molecular hydrogen (H2) seen in the infrared by Kaifu et al. (2000) and Stanke, McCaughrean & Zinnecker (2002). It is oriented toward P.A.=325 (blueshifted gas) in good agreement with the direction (P.A.= 310) of the high velocity molecular outflow found by Rodríguez-Franco et al. (1999b).
In this Letter, we present new sensitive and high angular resolution ( 1′′) CO J=21 observations of the OMC1-S region that allow us to resolve the CO outflow first reported by Rodriguez-Franco et al. (1999a), and to propose a possible exciting source.
2 Observations
The observations were made with the SMA333The Submillimeter Array (SMA) is a joint project between the Smithsonian Astrophysical Observatory and the Academia Sinica Institute of Astronomy and Astrophysics, and is funded by the Smithsonian Institution and the Academia Sinica. during 2004 September 2. The array was in its ”extended” configuration, which includes 21 independent baselines ranging in projected length from 16 to 180 meters. The phase reference center of the observations was R.A.[J2000]05:35:14 and Dec.[J2000]-05:24:00. The frequency was centered on the CO(2-1) line at 230.53 GHz in the upper sideband, while the lower sideband was centered at 220.53 GHz. The SMA digital correlator was configured with a band of 32 channels over 104 MHz, which provided 3.25 MHz (4.29 km s-1) resolution. The zenith opacity measured () with the NRAO tipping radiometer located at the Caltech Submillimeter Observatory was 0.04. The average system temperature was 250 K. The continuum image was constructed by averaging the line-free channels in the upper side band. The phase and amplitude calibrators were quasars 0423-013 and 3C120, with density fluxes of 2.3430.006 Jy and 0.5630.003 Jy, respectively. The uncertainty in the flux scale is estimated to be 20%, based on the SMA monitoring of quasars. Observations of Callisto provided the absolute scale for the flux density calibration. Further technical descriptions of the SMA and its calibration schemes are found in Ho, Moran & Lo (2004).
The data were calibrated using the MIR software package. The calibrated data were imaged and analyzed in the standard manner using the MIRIAD and AIPS packages. We weighted the data using the ROBUST parameter of INVERT set to 5, searching for a maximum sensitivity in each continuum and line image. The resulting continuum image rms was 11 mJy beam-1, at an angular resolution of with PA = , while the line image rms noise was 120 mJy beam-1 for each channel. All images were corrected for the primary beam response.
3 Discussion
3.1 Continuum Emission
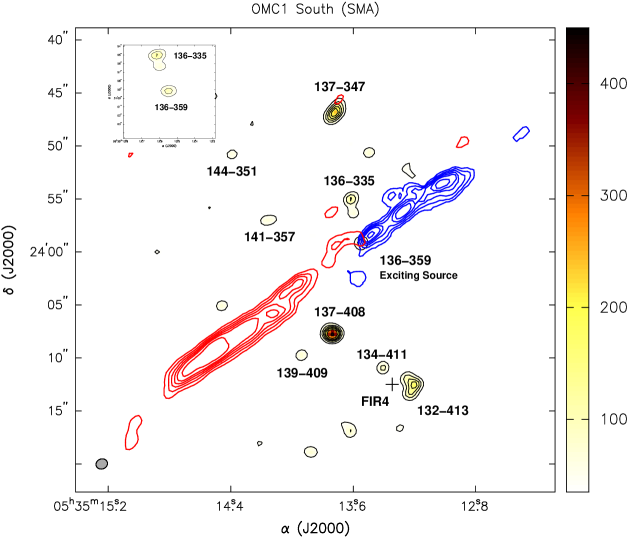
In the OMC1-S region we found a total of nine 1.3 mm continuum sources (see Figure 1), seven of them (134-411, 136-359, 136-335, 137-347, 139-409, 144-357 and 144-351) have been detected previously at other wavelengths by Ali Depoy (1995); Feigelson et al. (2002) ; Gaume et al. (1998); Mezger, Zylka & Wink (1990) ; Mundy et al. (1986); Schulz et al. (2001); Muench et al. 2002; Lada et al. 2004; Smith et al. (2004); Robberto et al. (2004); and Zapata et al. (2004a, 2004b). The source 132-413 is first reported here and does not have counterparts at other wavelengths. The source 137-408 is first reported here, but possibly is associated with the FIR4 source. To refer to these sources we adopted a position-based nomenclature after the convention of O’Dell Wen (1994). The nature of these continuum sources, and their 7 mm counterparts recently detected with the VLA, will be discussed in a future paper (Zapata et al. 2005, in preparation).
With our angular resolution and sensitivity we detect for the first time the millimeter counterpart of the source 136-359 (see Figure 1). This source is well centered on the axis of the collimated CO J=21 outflow as described below, and resides at the base of the blueshifted jet. We therefore suggest that 136-359 may be the likely exciting source of the bipolar molecular outflow. The source is located at the position R.A. [J2000]05:35:13.550 and DEC. [J2000]-05:23:59.14, has a deconvolved size 0.6′′ and an integrated continuum flux at 1.3 mm of 116.29.0 mJy.
This source has near- and mid-infrared counterparts (Gaume et al. 1998, Lada et al. 2000; Lada et al. (2000, 2004); Smith et al. 2004 and Robberto et al. 2005). This object is also coincident within 0.1′′ with a 1.3 cm continuum source (136-359; Zapata et al. 2004b) and a water maser with low velocity emission reported by Gaume et al. (1998).
Figure 2 shows the spectral energy distribution (SED) of 136-359 combining data from the centimeter, millimeter and infrared wavelengths. We fitted the SED with two modified blackbody functions of the form Bν(Td)(1-), where is the dust optical depth, and, Bν(Td) is the Planck function at the dust temperature Td. The opacity was assumed to vary with frequency as =, where =6.0 10-4 and is the frequency at which the optical depth is unity. From the fit (dotted line), we derive that the dust component has a temperature of 83 K and that is equal to 0.13. The temperature derived for the other component is 870 K. This hot component might represent a more evolved and hot inner core. We note that this dust temperature is higher than the typical dust temperatures (30 K) observed in other young protostars also associated with collimated outflows (VLA 1613, André et al. 1993; L1448-mm, Bachiller et al. 1990; HH24-mm, Chini et al. 1993). This suggests that the dust associated with 136-359 is being strongly heated, possibly either by internal or external sources.
The grain opacity spectral index for this source is rather small. Similar small values have been found in a few other sources (e.g. Kitamura et al. 2002, and Williams, Fuller & Sridharan 2004) and are usually attributed to growth and evolution of the dust grains within dense, dusty regions. An alternative possibility is that we are detecting not dust emission, but optically-thick free-free emission. However, if interpreted this way, the large flux densities observed would imply significant photoionization and the presence of an early B-type star, a result inconsistent with the bolometric luminosity of the source (note, however, that as will be discussed below, the possibility of a luminous star is suggested by the large mechanical power of the outflow). Finally, the dust emission itself could be optically thick. Additional high angular resolution observations of this source in the far-infrared and submillimeter regions may favor one of the possibilities.
From the millimeter wavelength flux, and the parameters obtained from our fit we estimate a total dust and gas mass for 136-359 of 0.16 M⊙ assuming optically thin dust emission, the Raleigh-Jeans approximation, a gas-to-dust ratio of 100, and a typical dust opacity per gram of = 0.006[/245 GHz]β where is 0.13 (see Hildebrand et al. 1983).
We integrated the fit of the SED to 136-359 and obtained a bolometric luminosity equal to 8 L⊙. We estimate that 136-359 has a ratio of Lbol/L1.3mm= 1.2 105 2.0 104. Moreover the source is visible at mid-infrared wavelengths (8.8 m). We propose that 136-359 may be a class I source (see André, Ward-Thompson, & Barsony, 1993).
3.2 CO J=21 Collimated Outflow
Figure 1 shows the spatial distribution of the integrated CO J=21 emission of the blue (-80 to -26 km s-1) and redshifted (22 to 82 km s-1) components of the bipolar outflow. Our map clearly resolves the structure of the outflow. The red component shows a deconvolved width of 0.”89 0.”06 and a length of 30′′ (390 AU 13,200 AU at the distance of 440 pc), while the blue component shows a deconvolved width of 0.”65 0.”02 and a length of 18′′ (280 AU 7900 AU). The P. A. of the outflow is 304.4∘∘, and we estimate a collimation angle of 3∘. Only a handful of outflows with similarly small collimation angles have been reported in the literature (HH 211, Gueth & Guilloteau 1999; HH 212, Zinnecker, McCaughrean & Rayner 1998, and Lee et al. 2000; HH111, Cernicharo & Reipurth 1996; IRAS 11590-6452, Bourke et al. 1997; VLA1623, Yu & Chernin 1997; IRAS 04166+2706, Tafalla et al. 2004). This outflow is also one of the youngest low-mass outflows known, having a dynamical age of = 0.1pc/160 km sec-1 = 600 yrs (uncorrected for projection).
Following Su, Zhang & Lim (2004), we estimate a mass of 0.52 M⊙ for the redshifted component of the outflow and a mass of 0.20 M⊙ for the blueshifted component. We used the ratio of the flux densities of 12CO[J=21] and 13CO[J=21], assuming LTE conditions, an excitation temperature of 80 K, an abundance ratio of 13CO/H2 equal to 8.5 10-5 (Frerking, Langer & Wilson 1982) and an isotopic ratio [12CO]/[13CO] = 70.5 (Wilson Rood 1994) for the appropriate galactocentric distance of Orion. The rest of the derived parameters are shown in Table 1. As can be seen in this Table, the large mechanical luminosity of the , much larger than the bolometric luminosity of 136-359, strongly suggesting that the true exciting s ource could be an obscured, high luminosity object.
This outflow is indeed extremely powerful for the low bolometric mass derived for the proposed exciting star. From our results and those of Rodriguez-Franco et al. (1999) we estimate a mechanical force of about 0.03 M⊙ km s-1 (years)-1. After the observational correlation for mechanical force as a function of bolometric luminosity shown in Figure 3 of Beuther et al. (2002b), we find that a bolometric luminosity of about 104 solar luminosities is expected for the exciting source. This value is three orders of magnitude larger than the bolometric luminosity of 8 solar luminosities derived from the spectrum of 136-359 (see Fig. 2).
We believe that the mechanical force estimate is reliable, and that the discrepancy could be explained if 136-359 is not the true exciting source. One possibility is that the far-infrared and submillimeter emissions of the source are much larger than the value interpolated in our fit. This could be possible if the centimeter data has a high contamination of free-free emission. If this is the case, possibly this source is more likely associated with a class 0 source and the total luminosity can be increased to 20L⊙. However, even with this increased bolometric luminosity this outflow remains as one of most efficient outflows.
Another possibility is that 136-359 is not the true exciting source but just a line-of sight star, part of the cluster but not the true exciting object.
The exciting object would be a high luminosity, extremely obscured object. Its bolometric luminosity would come out in the far-infrared, possibly as an extended source difficult to detect in the available observations. Finally, 136-359 may be a post-FU Ori object that reached much higher luminosities in the past, when the outflow was generated. If this is the case, the outflow should start to disappear close to the central source in a timescale of decades, as it moves away from the central source. In summary, we do not have a clear explanation for the large mechanical luminosity of the outflow and the apparent low bolometric luminosity of the source at its center.
In Figure 1 we can also observe that the CO J=21 redshifted integrated emission is stronger and wider but becomes detectable at a greater distance ( 5′′) as compared to the blueshifted component. This suggests that the excitation of the CO molecule on opposite sides of the outflow is different, possibly due to anisotropic ambient cloud conditions. More observations at high angular resolution with different molecular probes sensitive to different cloud properties will be quite important for studying the higher excitation material closely associated with the driving source.
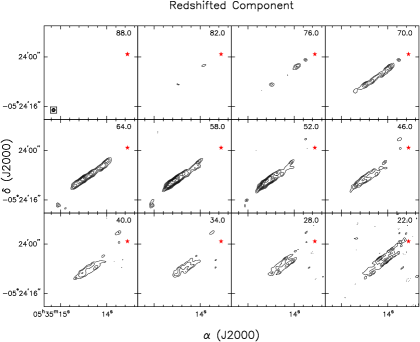
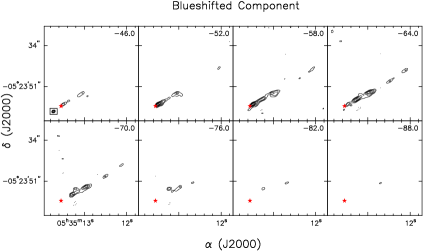
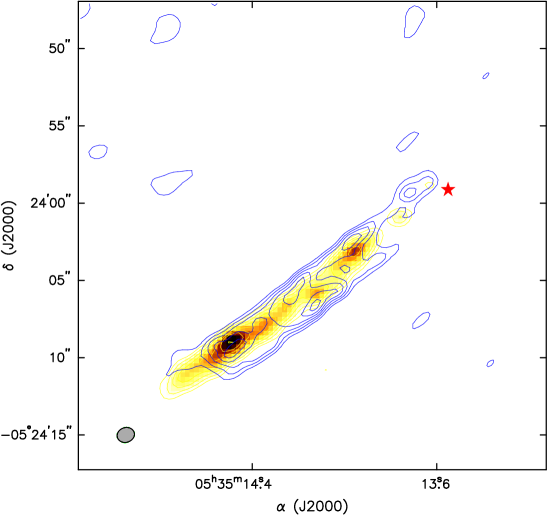
Figures 3 show the channel maps of the CO J=21 emission for the red and blueshifted components, respectively. The greatest radial velocities are quite symmetric, reaching up to 80 km s-1 from the ambient cloud velocity which is taken to be 5 km s-1. The range of the outflow velocities, the central position of the outflow, and the orientation are in good agreement with the single-dish results of Rodríguez-Franco et al. (1999b). On the redshifted side, there is a tendency for the gas to be located further from the exciting source with increasing velocity. However, the highest velocities are also found closer to the center. Furthermore, it is clear that for the CO redshifted emission, the higher velocities trace an extremely well collimated jet-like structure, while the shifted lower velocities trace a more extended envelope that is consistent with a cylindrical shell, limb-brightened on the outer surface (see figure 4). These tendencies are less obvious at the blueshifted velocities possibly because of their fainter emission.
The spatial structure of the high and low velocity gas of the bipolar outflow as a function of the radial velocities (Position-Velocity Diagram) along the major axis is shown in figure 5. The blue and redshifted components show that the CO emission covers the same velocity range ( 50-90 km s-1) along the entire jet. In the blueshifted component, the acceleration to the terminal velocity seems to be taken place immediately upon ejection (in a region of ). A complete discussion on the possible ejection mechanisms of the molecular outflows is given in Bachiller (1996) and Lee at al. (2000). This behavior has also been observed in the molecular outflow IRAS 04166+2706 (Tafalla et al. 2004). For the red component, there is also evidence that the molecular gas is decelerated along the jet, probably via interaction with the ambient gas.
References
- (1) Ali, B. & Depoy, D. L. 1995, AJ, 109, 709
- (2) André, P., Ward-Thompson, D., & Barsony, M. 1993, ApJ, 406, 122
- (3) Bachiller, R. 1996, ARA&A, 34, 111
- (4) Bally, J., O’Dell, C. R., & McCaughrean, M. J. 2000, AJ, 119, 2919
- (5) Beuther, H., Schilke, P., Sridharan, T. K., et al. 2002b, A&A, 383, 892
- (6) Bourke, T. L., Garay, G., Lehtinen, K. K., Koehnenkamp, I., Launhardt, R., Nyman, L., May, J., Robinson, G. & Hyland, A. R., 1997, ApJ, 476, 781
- (7) Cernicharo, J., & Reipurth, B. 1996, ApJ, 460, L57
- (8) Chini, R., Krug̈el, E., Haslam, CGT., Kreysa, E., & Lemke, R. 1993, A&A, 272, L5
- (9) Feigelson, E. D., Broos, P., Gaffney, J. A., Garmire, G. Hillenbrand, L. A., Pravdo, S. H., Townsley, L., & Tsuboi, Y. 2002, ApJ, 574, 258
- (10) Frerking, M. A., Langer, W. D., & Wilson, R. W. 1982, ApJ, 262, 590
- (11) Gaume, R. A., Wilson, T. L., Vrba, F. J., Johnston, K. J., & Schmid-Burgk J. 1998, ApJ, 493, 940
- (12) Gueth, F., & Guilloteau, S. 1999, A&A, 34, 571
- (13) Ho, P. P. T, Moran, J. M., & Lo, K. Y. 2004, ApJL, 616, L1
- (14) Hildebrand, R. H. 1983, QJRAS, 24, 267
- (15) Kaifu, N., et al. 2000, PASJ, 52, 1
- (16) Kitamura, Y. et al. 2002, ApJ, 581, 357
- (17) Lada, C. J., Muench, A. A., Haisch, K. E., Jr., Lada, E. A., Alves, J. F., Tollestrup, E. V., & Willier, S. P. 2000, AJ, 120, 3162
- (18) Lada, C. J., Muench, A. A., Lada, E. A., & Alves, J. F. 2004, AJ, 128, 1254
- (19) Lee, C.-F., Mundy, L. G., Reipurth, B., Ostriker, E. C., & Stone, J. M. 2000, ApJ, 542, 925
- (20) Mezger, P. G., Zylka, R., & Wink, J. E. 1990, A&A, 228, 95
- (21) Muench A. A., Lada E. A., Lada C. J., & Alves J., 2002, ApJ, 573, 36
- (22) Mundy, L. G., Scoville, N. Z., Baath, L. B., Masson, C. R., & Woody, D. P. 1986, ApJ, 304, L51
- (23) O’Dell, C. R., & Wen, Z. 1994, ApJ, 436, 194
- (24) O’Dell, C. R., & Wong K. 1996, AJ, 111, 846
- (25) O’Dell, C. R. 2003, RMxAC, 18, 800
- (26) O’Dell, C. R. & Doi, T. 2003, AJ, 125, 127 (Erratum: 2003, AJ, 125, 2753)
- (27) Robberto, M., Beckwith, S. V. W., Panagia, N., Patel, S. G., Herbst, T. M., Ligori, S., Custo, A., Boccacci, P., & Bertero, M., 2005, AJ, 129, 153
- (28) Rodríguez-Franco, A., Martín-Pintado, J. & Wilson, T.L., 1999a, A&A 344, L57
- (29) Rodríguez-Franco, A., Martín-Pintado, J. & Wilson, T.L., 1999b, A&A 351, 1103
- (30) Schulz, N. S., Canizares, C., Huenemoerder, D., Kastner, J. H., Taylor, S. C., & Bergstrom, E. J. 2001, ApJ, 549, 441
- (31) Schmid-Burgk, J., Güsten, R., Mauersberger, R., Schulz, A., & Wilson, T. L. 1990, ApJ, 362, L25
- (32) Smith, N., Bally, J., Shuping, R. Y., Morris M., & Hayward, T. 2004, ApJ, 610, L120
- (33) Stanke, T., McCaughrean, M. J., & Zinnecker, H. 2002, A&A, 392, 239
- (34) Su, Y., Zhang, Q., & Lim, J. 2004, ApJ, 604, 258
- (35) Tafalla, M., Santiago, J., Johnstone, D., Bachiller, R. 2004, A&A, 423, L21
- (36) Wilson, T. L., & Rood, R. T. 1994, ARA&A, 32, 191
- (37) Williams, S. J., Fuller, G. A., & Sridharan, T. K. 2004, A&A, 417, 115
- (38) Yu, T., & Chernin, L. M. 1997, ApJ, 479, 63
- (39) Zapata, L. A., Rodríguez, L. F., Kurtz, S. E., & O’Dell, C. R. 2004a, AJ, 127, 2252
- (40) Zapata, L. A., Rodríguez, L. F., Kurtz, S. E., O’Dell, C. R. & Ho, P. T. P. 2004b, ApJ, 610, 121
- (41) Zinnecker, H., McCaughrean, M. J., & Rayner, J. T. 1998, Nature, 394, 862
- (42) Ziurys, L. M., Wilson, T. L. & Mauersberger, R., 1990, ApJ, 356, 25
| Masa | Momentum | Energy | Mechanical Luminosity | ||
|---|---|---|---|---|---|
| Component | [M⊙] | [M⊙ km s-1] | [1046 erg] | [L⊙] | |
| Blueshifted | 0.20 | 16 | 1.3 | 170 | |
| Redshifted | 0.52 | 42 | 3.3 | 440 | |
| Total | 0.72 | 58 | 4.6 | 610 |
Note. — To calculate the energy and momentum we use a velocity of 80 km s-1.