-ENHANCED INTEGRATED LICK/IDS SPECTRAL INDICES
AND MILKY WAY AND M31 GLOBULAR CLUSTERS
AND EARLY-TYPE GALAXIES
Abstract
All 25 Lick/IDS spectral indices have been computed for the integrated light of simple stellar populations over broad ranges of age and metallicity and with effects from horizontal-branch stars fully implemented. Our models employ -enhanced isochrones at the sub-solar metallicity regime, but solar-scaled ones at solar and super-solar metallicity. We have also employed the updated response functions of Houdashelt et al. at the solar and super-solar metallicity regime, so that we could assess the light-element enhancement phenomena seen from metal-rich early-type galaxies. For Balmer indices a significant response was noted for H and H when -elements are enhanced, but H is rather -sensitive. We also find that our 5 and 12 Gyr models of H and H overlap in the metal-poor regime because of changing populations of blue horizontal-branch stars. Furthermore, for populations younger than 1 Gyr, Balmer lines become weaker in the metal-poor regime because the main-sequence turnoff is hotter than 10,000 K. We present models at fixed [Fe/H] (rather than fixed heavy element mass fraction ) and compare to Milky Way globular clusters that have independently estimated mean [Fe/H] and [/Fe]. Comparison of our models with observations of Milky Way and M31 globular clusters in index-index space are favorable, tracing the observations at a model age of 12 Gyr without any zero-point shifts that are needed by some other models. The metallicity range of M31 globular clusters is similar to that of their Galactic counterparts. We also verify Beasley et al.’s recent hypothesis of the existence of young and intermediate-age star clusters in M31. Contrary to the literature values, the Milky Way globular cluster NGC 6553 appears more metal-rich than NGC 6528 from metal indices. We present H and H Lick/IDS indices for the Lick/IDS sample of galaxies. We confirm the well-known enhancement of Mg and Na relative to Fe and Ca among early-type galaxies, and its increase with increasing velocity dispersion. There are distinct differences between globular clusters and galaxies in diagrams involving CN1 and CN2, hinting that the globular cluster environment may be a special one in terms of the amount of N incorporated into stars.
1 INTRODUCTION
Lick IDS spectral feature indices (Worthey et al., 1994) are measurements of the depths of some of the more obvious absorption blends in the spectra of stars and galaxies. They have been widely used to derive the mean age and mean chemical compositions of stellar systems such as star clusters and galaxies. Models for these indices, when compared with observations, can shed light on the ages and chemical compositions of objects as small (and local) as globular clusters to objects as large (and cosmological) as giant elliptical galaxies. As new model ingredients become available it is essential to continue to validate the use of the integrated Lick IDS spectral indices for age and metallicity estimation, especially for distant, unresolved stellar systems. One way is through the satisfactory confirmation of age and metallicity of the Milky Way globular clusters (GCs) with their independently acquired age and metallicity (e.g., Gibson et al. 1999).
In order to compute the theoretical integrated Lick IDS spectral indices for simple stellar populations (SSPs; clusterlike populations characterized by a single age and a single abundance at birth), two components are generally needed. They are (1) stellar evolutionary tracks or isochrones and (2) some connection to observable quantities such as synthetic stellar fluxes or empirically derived index fitting functions. The fitting functions of Worthey et al. (1994)111 See also Worthey & Ottaviani (1997) for H, H, H, H. have been built upon the Lick stellar library of Milky Way stars. Because of the empirical nature of the fits, we expect that the fitting functions follow the abundance pattern of the stars to which they were fit. That is, in the metal-poor regime ([Fe/H] 0.0) they should represent stars of [/Fe] +0.3 dex and at the solar and super-solar metallicity regime they represent stars of [/Fe] 0.0.
Bearing this in mind, we employ -enhanced isochrones at subsolar metallicities (in this work isochrones, Kim et al. 2002) in order to make SSP models that are more compatible with the -element enhanced fitting functions. By the same token, we compute our models using solar-scaled isochrones in the solar and super-solar metallicity regime. Also, in order to make a straightforward comparison with observational data, we present our model results as a function of [Fe/H] instead of as a function of total metallicity, [Z/H] (cf. Trager et al. 2000a; Thomas, Maraston, & Bender 2003a; hereafter TMB03a).
Besides basic checking of our models with wide variety of data, some of the issues that we are addressing in this study are the following: (1) the sensitivity of the bluer Balmer indices, H and H, to -enhancement may be higher than for H (Thomas, Maraston, & Korn 2004), (2) young and intermediate-age star clusters may be present in M31 (Beasley et al. 2004, 2005; Burstein et al. 2004), (3) there may be CN anomaly between GCs and early-type galaxies (Burstein et al. 1984), (4) the overall Mg enhancement in early-type galaxies is seen to depend on velocity dispersion (Worthey 1998, Worthey, Faber, & González 1992), and (5) there may be a Ca underabundance in early-type galaxies compared to the solar mixture (Thomas, Maraston, & Bender 2003b; Cenarro et al. 2004).
In the following section, we describe our models in detail. In 3 we compare models with recent observations of Milky Way and M31 globular clusters and early-type galaxies. Section 4 summarizes and concludes our work.
2 STELLAR POPULATION MODELS
The present models are direct descendents of an evolutionary population synthesis code that was developed to study the stellar populations of globular clusters and early-type galaxies (Lee, Yoon, & Lee 2000; Lee, Lee, & Gibson 2002). In this work, we have taken advantage of a recent emergence of the isochrones with an -mixture [this mixture has O, Ne, Na, Mg, Si, P, S, Cl, Ar, Ca, and Ti enhanced and Al and Mn depressed relative to Fe, C, N, K, Cr, and Ni: cf. Kim et al. (2002)]. This mixture may not track the halo abundance exactly, but it should be fairly closely compatible with the stellar library that was the basis of Worthey et al. (1994)’s fitting functions, at least at the metal-poor end. We assume that the the behavior of the library is roughly: [/Fe] = +0.3 for [Fe/H] 1.0, [/Fe] goes from +0.3 to 0.0 as [Fe/H] does from 1.0 to 0.0, and [/Fe] = 0.0 for [Fe/H] 0.0 (e.g., Wheeler, Sneden, & Truran 1989).
Following earlier work (Lee et al. 2000, 2002), we take into account the detailed systematic variation of horizontal-branch (HB) morphology with age and metallicity. The post-red giant branch evolutionary tracks by Yi, Demarque, & Kim (1997) are coupled to the isochrones. In order to reproduce the observational HB morphology of Milky Way globular clusters, a value of was taken, where is the scaling factor in the Reimers (1975) formula for stellar mass loss. The value of the helium enrichment parameter, Y/Z = 2, was assumed. The standard Salpeter (1955) initial mass function was adopted for calculating the relative number of stars along the isochrones. The investigated age range is from 1 Gyr to 12 Gyr and the metallicities cover [Fe/H] .
The strength of spectral line indices is calculated with either
| (1) |
or
| (2) |
where is an index bandpass and and are the flux in the index bandpass and the pseudocontinuum flux in the index bandpass (Worthey et al. 1994; Worthey & Ottaviani 1997). First, for each star (or bin of stars along an isochrone) with a given metallicity, temperature, and gravity, we find the average flux values within both pseudocontinuum regions for each index from the stellar model atmospheres. We have employed the stellar model atmospheres of Lejeune, Cuisinier, & Buser (1997, 1998) in this study to place . We derive at the center of each index bandpasses by linear interpolation in wavelength. Second, we calculate either the equivalent width (EW; e.g., for H) or the magnitude (Mag; e.g., for Mg2) using Worthey et al. (1994) and Worthey & Ottaviani (1997) fitting functions, where the index value is given as a function of stellar [Fe/H], temperature, and gravity. This allows one to solve for . Finally, we sum and over all bins in the isochrone and compute the integrated strengths of spectral feature indices using equations (1) and (2).
We want to stress that our models are presented at fixed [Fe/H] so that it can be compared directly to observed integrated cluster spectral feature indices in the cases where the cluster has independently-measured mean [Fe/H] and [/Fe]. Thomas & Maraston (2003) and Maraston et al. (2003) have recently investigated the impact of -enhanced stellar evolutionary tracks on stellar population models using the evolution of Salasnich et al. (2000). One should realize, however, that because their models are provided at fixed total metallicity [Z/H], they find that -enhanced tracks are hotter than solar-scaled ones, mostly owing to the lower opacities of -enhanced stellar atmospheres at fixed total metallicity [Z/H]. The situation is opposite for models given at fixed [Fe/H]: the -enhanced tracks are cooler at a given [Fe/H] (cf. Figures 2 and 3 of Kim et al. 2002).
In order to investigate -enhancement at solar and super-solar metallicities where many massive elliptical galaxies reside, we employ scaled-solar isochrones, but include modifications to the Lick IDS index strengths based on the updated response functions (RFs) by Houdashelt et al. (2002) which we describe in detail in the following.
Recently, Houdashelt et al. (2002; hereafter HTWB02) repeated and expanded the earlier work of Tripicco & Bell (1995; hereafter TB95) on the sensitivity of each Lick spectral index as the abundances of individual chemical elements are varied. They used revised and updated spectral line lists, including TiO bands that were not included in TB95. In addition, they added the age-sensitive H and H indices222The tables of spectral index response to abundance changes are available at the http://astro.wsu.edu/hclee/HTWB02. Also, please refer to section 3.3 in Worthey (2004) to find the differences between TB95 and HTWB02..
HTWB02’s experiments, like those of TB95, are done only at solar metallicity and only for three evolutionary phases. We apply this treatment at the solar and super-solar regime (in our tabulated models, the [Fe/H] = 0.0 and +0.5 entries are modified). Hence, even though our default models at [Fe/H] = 0.0 and +0.5 have isochrones with [/Fe] = 0.0, with the help from HTWB02 we can appraise -element enhancement phenomena in the limit where the abundance mixture does not feed back to change isochrone shape or number distribution. We do not, however, apply this treatment at the sub-solar regime because we assume that the regular fitting functions follow the Milky Way abundance pattern.
For metal-rich indices, we include enhancement effects from the chemical elements O, Na, Mg, Si, Ca, and Ti, while elements C, N, and Cr track Fe in a scaled-solar fashion. This (1) accommodates the general observational trends seen from globular cluster stars (e.g., Fig. 14 of Ramírez & Cohen 2003) and (2) mimics the -mixture of the isochrones (Fig. 1 of Kim et al. 2002). Detailed studies for the C- and N-sensitive indices are under way and will be presented elsewhere. Therefore, and despite the fact that we know this does not fit all observations, the model indices CN1, CN2, G4300, C24668 that we present in this paper assume approximately scaled-solar behavior for C and N.
3 COMPARISON WITH OBSERVATIONS
3.1 COMPARISON WITH MILKY WAY GLOBULAR CLUSTERS
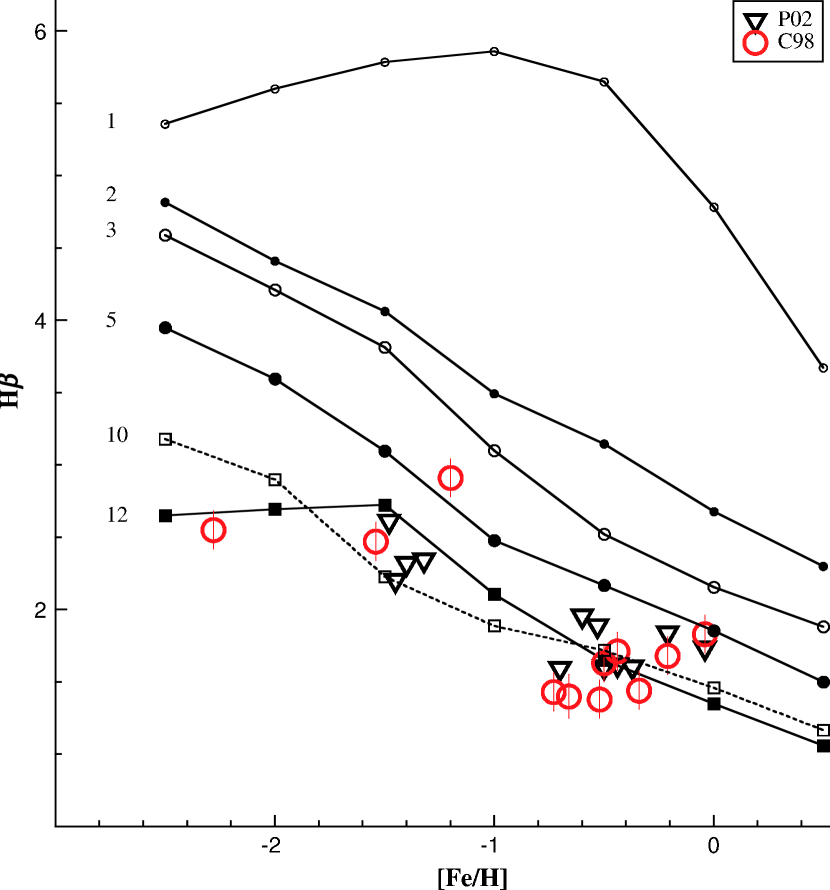
Having discussed the theoretical aspects of generating the integrated -enhanced Lick spectral indices in 2, we now provide empirical checks of our models using Milky Way GCs. In this work, we use two datasets for the Milky Way GCs. One is from Cohen, Blakeslee, & Ryzhov (1998)333In this work, we use Table 2 in Beasley et al. (2004) who remeasured the original Cohen et al. spectra with careful consideration of flux and wavelength calibration. Beasley et al. even managed to measure some of previously unmeasured Lick indices which reside at the shorter wavelength range, such as H, H, Ca4227, G4300, Fe4383, Fe4531 as well as their errors. Due to its large uncertainty we do not use NGC 6171 (M107, [Fe/H] = 1.04) index data. We use original C98 data for TiO2 since Beasley et al. did not measure this index. and the other is from Puzia et al. (2002)444It is Puzia et al.’s Table D that is used in this study. For H and H, their Table C is used.. We use the Harris (1996) compilation555http://physun.mcmaster.ca/harris/mwgc.dat for [Fe/H] of the Milky Way GCs. Figures 16 show [Fe/H] vs. Lick indices in order to take advantage of independent measurements of mean [Fe/H] and [/Fe] of the Milky Way GCs.
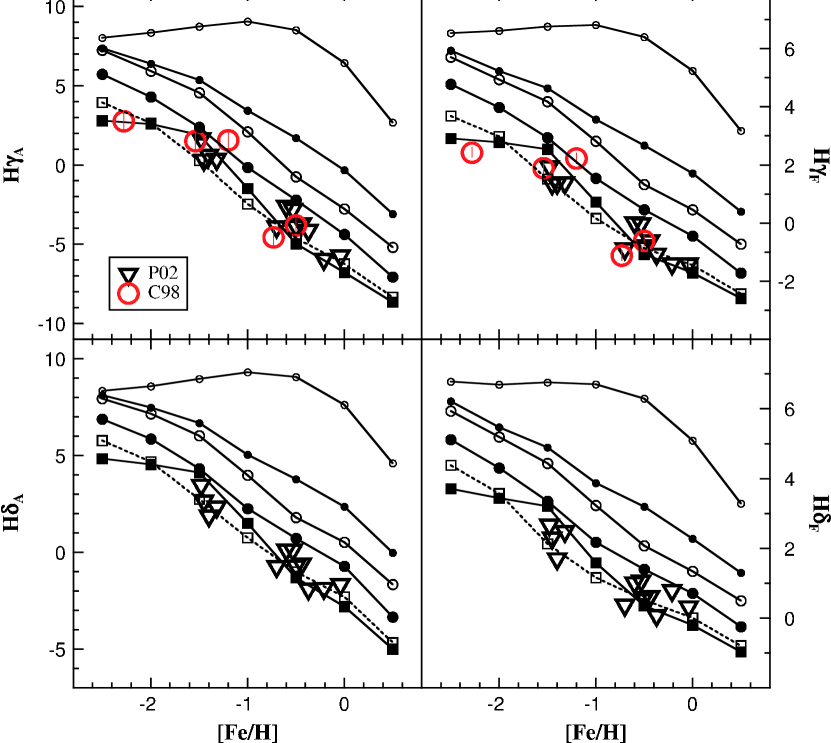
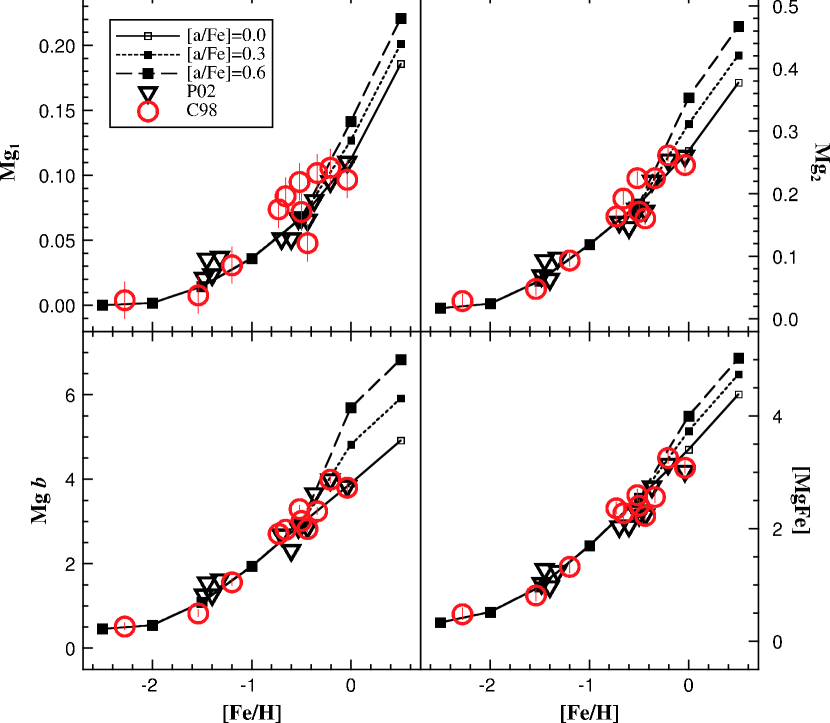
For models in Figures 1 and 2, [/Fe] = +0.3 dex isochrones are employed at [Fe/H] = 2.5, 2.0, 1.5, and 1.0, while [/Fe] = +0.15 dex isochrones are used at [Fe/H] = 0.5, and, finally, solar-scaled isochrones with HTWB02 response functions of [O,Na,Mg,Si,Ca,Ti/Fe] = +0.3 dex are applied at [Fe/H] = 0.0 and +0.5. The effects from blue HB stars are clear as 10 Gyr and 12 Gyr lines are compared at the metal-poor regime. It is also noted that Balmer lines become weaker with decreasing metallicity at 1 Gyr because the main-sequence turnoff becomes hotter than 10,000 K in metal-poor populations.
In Figures 1-6, the data of Cohen et al. (C98, circles) are, from the left666In Figure 2, in the upper panel for H, C98 data are, from the left, NGC 6341, NGC 6205, NGC 6121, NGC 6838, and NGC 6356., and with [Fe/H] values (Harris, 1996) noted in parentheses, NGC 6341 (M92; 2.28), NGC 6205 (M13; 1.54), NGC 6121 (M4; 1.20), NGC 6838 (0.73), NGC 6539 (0.66), NGC 6760 (0.52), NGC 6356 (0.50), NGC 6624 (0.44), NGC 6440 (0.34), NGC 6553 (0.21), and NGC 6528 (0.04). Those of Puzia et al. (P02, triangles) are, from the left, NGC 6218 (M12; 1.48), NGC 6626 (M28; 1.45), NGC 6981 (M72; 1.40), NGC 6284 (1.32), NGC 6637 (0.70), NGC 6388 (0.60), NGC 6441 (0.53), NGC 6356 (0.50), NGC 6624 (0.44), NGC 5927 (0.37), NGC 6553 (0.21), and NGC 6528 (0.04). There are 4 GCs in common between C98 and P02. They are NGC 6356 ([Fe/H] = 0.50), NGC 6624 ([Fe/H] = 0.44), NGC 6553 ([Fe/H] = 0.21), and NGC 6528 ([Fe/H] = 0.04). It is useful to note that the latter two are among the most metal-rich Galactic globular clusters because it would be interesting to find if even more metal-rich GCs than these exist in other galaxies.
From Figures 1 and 2, where we compare C98 and P02 datasets of Milky Way GCs with our Balmer line models, we find a good overall agreement and clear emergence of horizontal-branch morphology effects. We see that (1) our models of Balmer lines satisfactorily trace the observational data of Milky Way GCs at 12 Gyr without zero-point shifts throughout the metallicity range, (2) C98’s most metal-poor cluster, M92 ([Fe/H] = 2.28) is well matched with our models, (3) C98’s M13 ([Fe/H] = 1.54, HB Type777HB Type is defined as [(B R) / (B + V + R)], where B and R are the number of HB stars left and right of the instability strip, respectively, while V is the number of RR Lyrae stars (Lee, Demarque, & Zinn, 1994). = 0.97) and P02’s M12888The most metal-poor GC in the P02 sample. ([Fe/H] = 1.48, HB Type = 0.92) with comparable metallicity and similar HB morphology are rather satisfactorily reproduced from our model Balmer line indices, (4) C98’s M4 ([Fe/H] = 1.20, HB Type = 0.07) consistently shows strong H, H, and H as expected from its HB morphology (Lee et al. 2000).
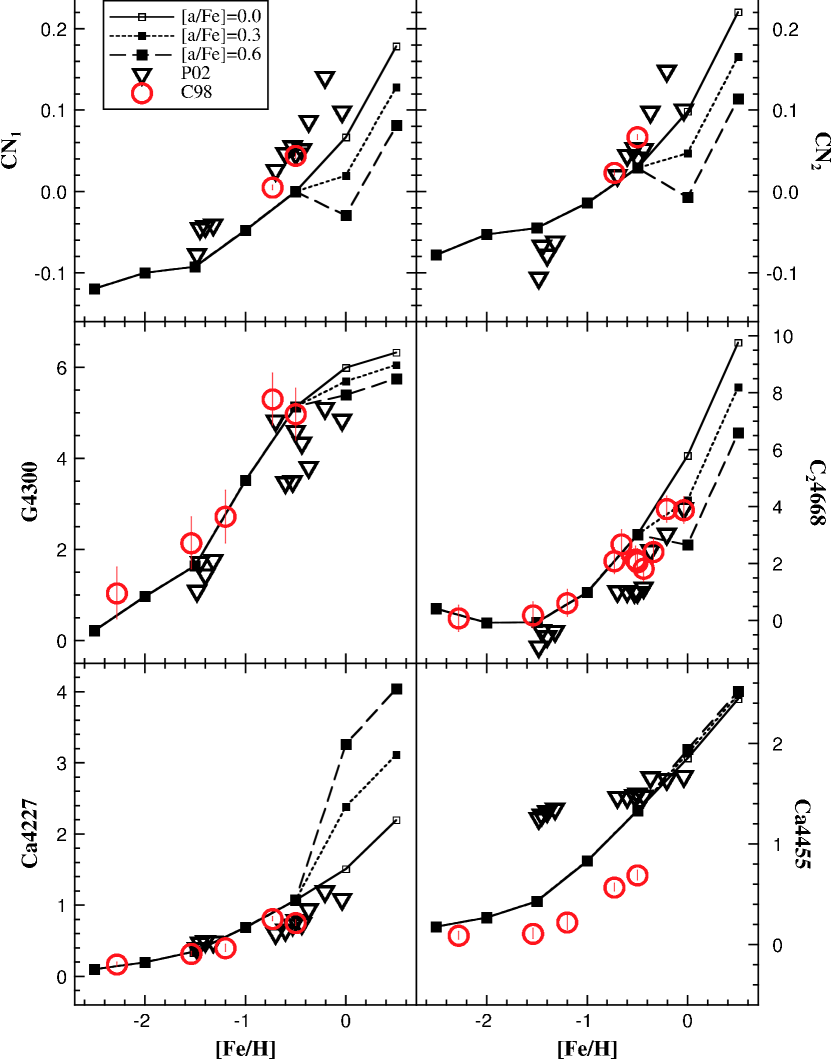
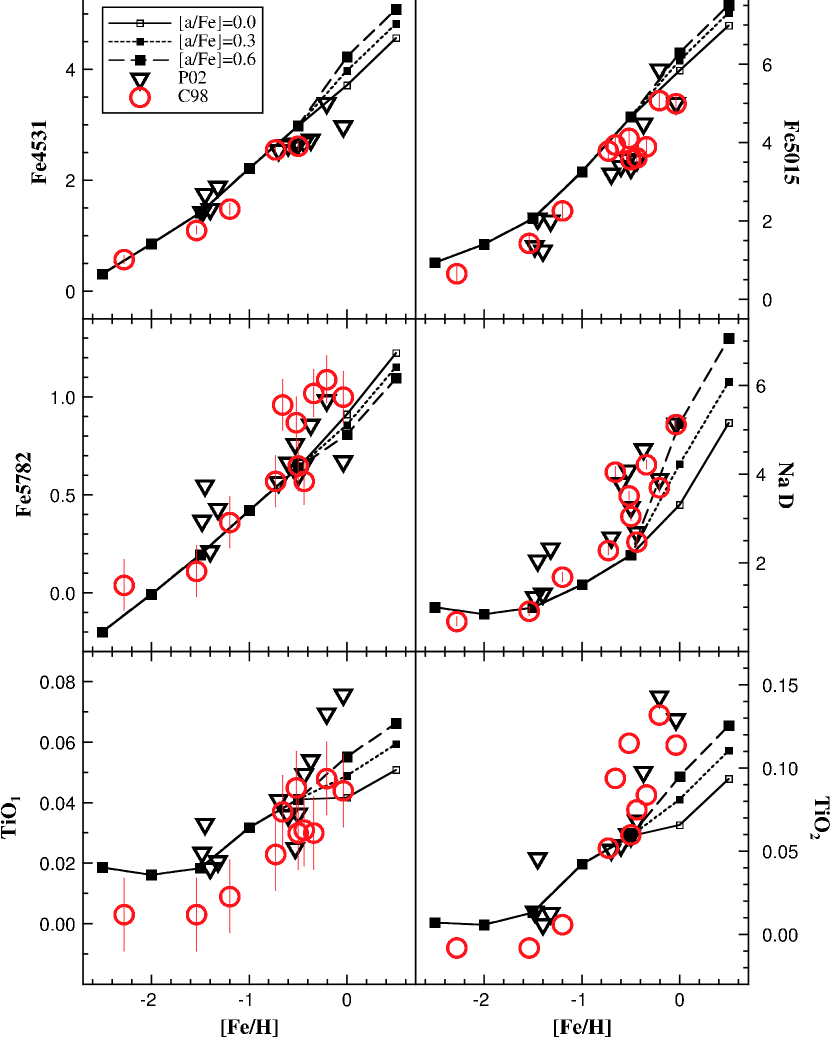
In Figures 36, 12 Gyr models for non-Balmer indices are shown. At [Fe/H] = 0.0 and +0.5, HTWB02 response functions of [/Fe] = 0.0 (solid lines; our default model without HTWB02 treatment), +0.3 (dotted lines), +0.6 dex (dashed lines) are, respectively, employed on top of the solar-scaled isochrones.
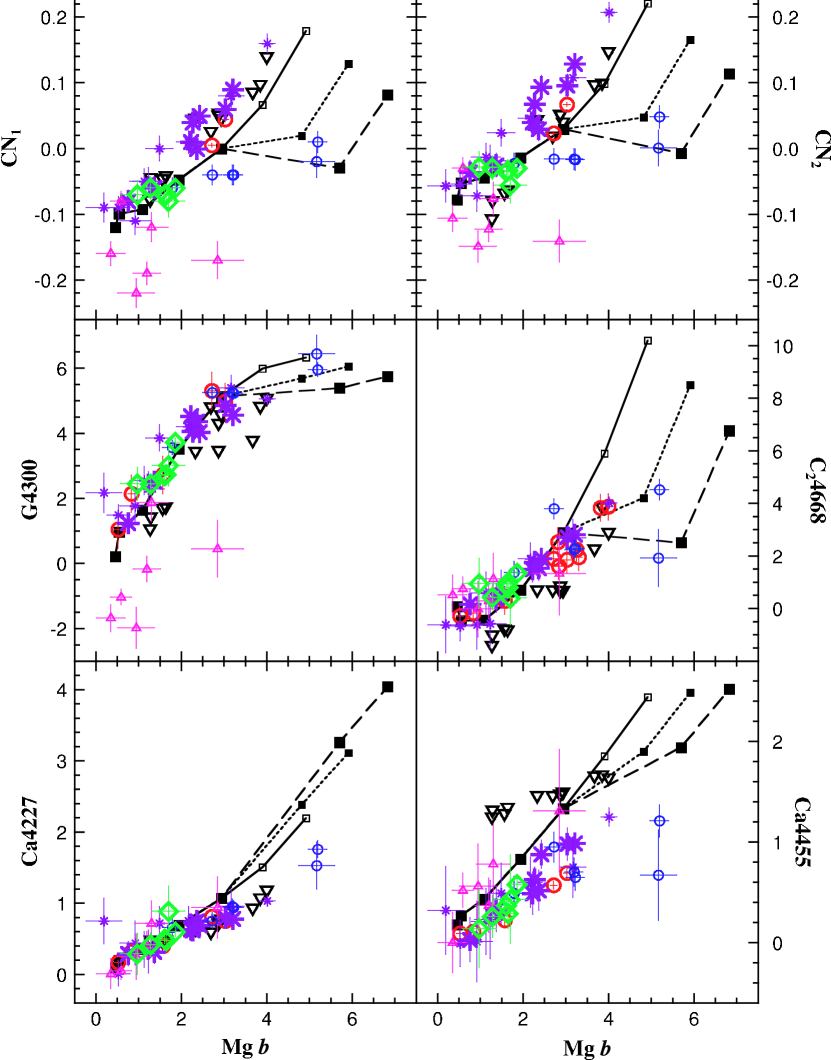
For each metal index we first concentrate on the sub-solar metallicity regime to check our use of -enhanced isochrones for the comparably -enhanced Milky Way GCs (e.g., Carney 1996). Secondarily, we inspect the sensitivity of integrated Lick metal line indices on -enhancement as we employ HTWB02 response functions at the solar and super-solar metallicity regime. To clarify our thinking we have divided the Lick metal line indices into four groups. They are (1) CN-sensitive indices CN1, CN2, G4300, and C24668, calcium-sensitive index Ca4227, and Ca4455, (2) iron-sensitive indices Fe4383, Fe5270, Fe5335, Fe5406, and Fe5709, (3) Mg-sensitive indices Mg1, Mg2, and Mg , and (4) mixed-sensitivity Fe4531, Fe5015, and Fe5782, Na-sensitive Na D, and TiO1 and TiO2.
CN1, CN2: In the top left panel of Figure 3, Milky Way GCs are systematically 0.03 mag stronger than our models in CN1. In CN2, the data tilt against our models, being weaker at the metal-poor end but stronger at the metal-rich end compared to our models (similar to TiO2 in Figure 6). The CN1 and CN2 mismatch may originate from intrinsic differences between globular cluster stars and galactic field halo stars on that our models are based (e.g., Langer, Suntzeff, & Kraft 1992). The Milky Way GC stars, down to main sequence turn-off, are known to be generally different from the field halo stars in the sense that the former show some phenomena such as CH-CN bimodality (e.g., Cannon et al. 1998; Harbeck, Smith, & Grebel 2003). As TMB03a suggested, nitrogen enhancement rather than that of carbon might be helpful to alleviate the discrepancy between models and the data. Also, it is noted in Tables 2 and 3 of Worthey et al. (1994) that the fitting functions for CN1 and CN2 are not valid below [Fe/H] = 1 due to lack of stars in the sample over which one could model a fit. We are left, then, with too many possible explanations for CN index drift.
According to TB95 and HTWB02, both CN1 and CN2 are heavily sensitive to C and N. In this study, however, as we employ the HTWB02 treatment at the solar and super-solar metallicity regime we do not include C- and N-enhancement (see 2). Hence, as depicted in Figure 3 both CN1 and CN2 (also G4300 and C24668) decrease with increasing -enhancement mostly due to O and Mg.
G4300: The middle left panel of Figure 3 shows that our models of G4300 competently trace C98 data, but not for some of metal-rich P02 GCs. Opposite to TMB03a models, and conceivably because we do not include C-enhancement, G4300 decreases a bit with increasing -enhancement, mostly due to O. G4300 is a C- and O-sensitive index according to TB95 and HTWB02.
C24668: The middle right panel of Figure 3 depicts that our models illustriously track C98 points, while P02 GCs show a poor match as already seen in Fig. 2 of TMB03a. This is primarily a C-sensitive index, but responds negatively to O-enhancement. Contrary to TMB03a, possibly because we do not take into account C-enhancement, C24668 decreases with increasing -enhancement mostly due to increased O.
Ca4227: The bottom left panel of Figure 3 shows that both C98 and P02 are slightly weaker than our models at the metal-rich ([Fe/H] 0.5) regime. Ca4227 is a highly (Ca)-sensitive index. In fact, it is the only Ca-sensitive Lick index according to TB95 and HTWB02. Without considering the effects from C- and N-enhancement, Ca4227 significantly increases with increasing -enhancement mostly due to Ca as manifested in Figure 3 at the super-solar metallicity regime contrary to TMB03a.
Ca4455: Some notable mismatch is seen between Milky Way GCs and our models for Ca4455 in the bottom right panel of Figure 3. NGC 6356 ([Fe/H] = 0.50) is the only common GC between C98 and P02 (C98 = 0.69 Å, P02 = 1.48 Å). We suspect that P02’s measurements are maybe erroneous because it is seen in Figure 10 that C98 extensively overlap with M31 GCs. One possibility is that Ca4455 generally requires large systematic corrections to get from modern CCD spectra back to the original Lick/IDS system (Worthey, 2004). Ca4455 is misnamed in the sense that it is not an - or Ca-sensitive index at all (TB95; HTWB02). It is actually an -insensitive index as demonstrated in Figure 3.
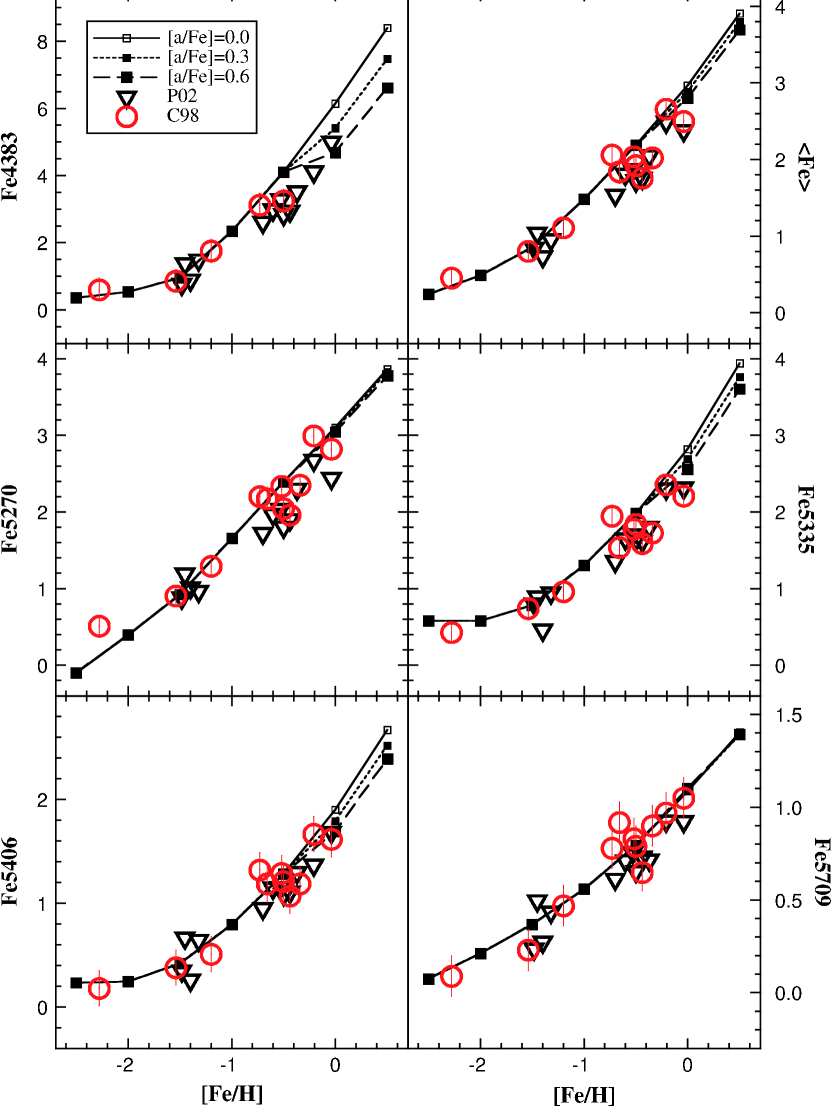
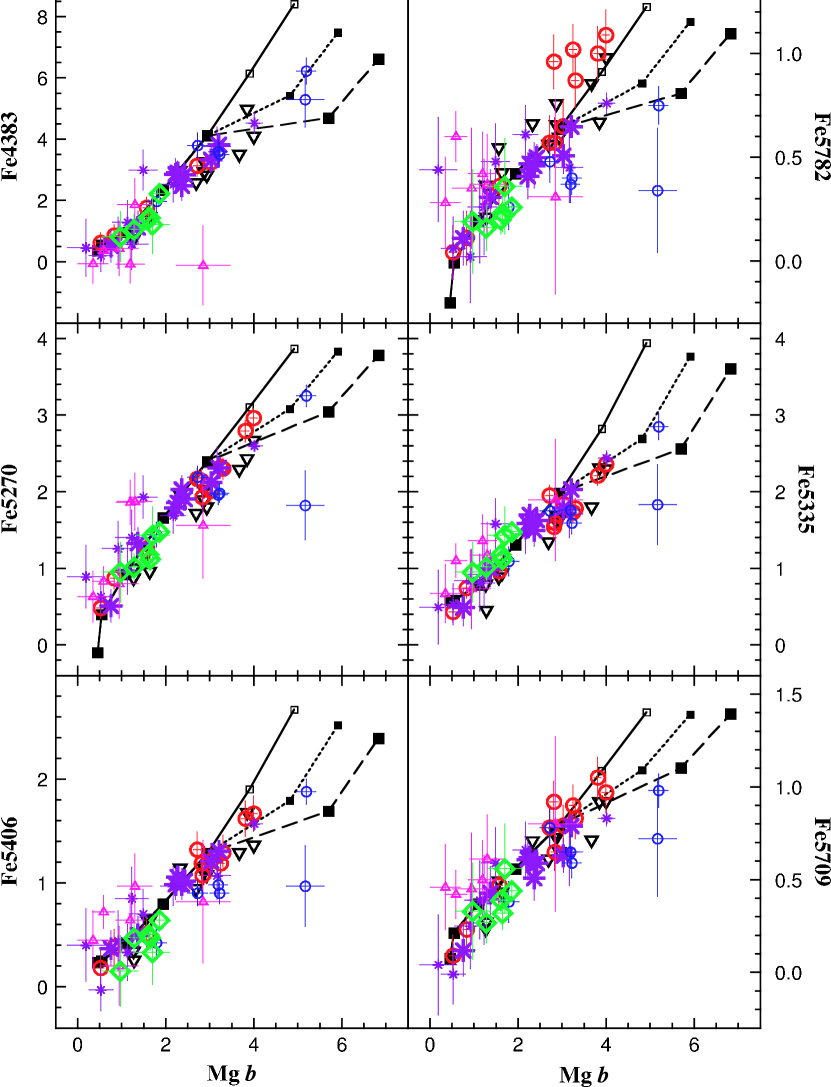
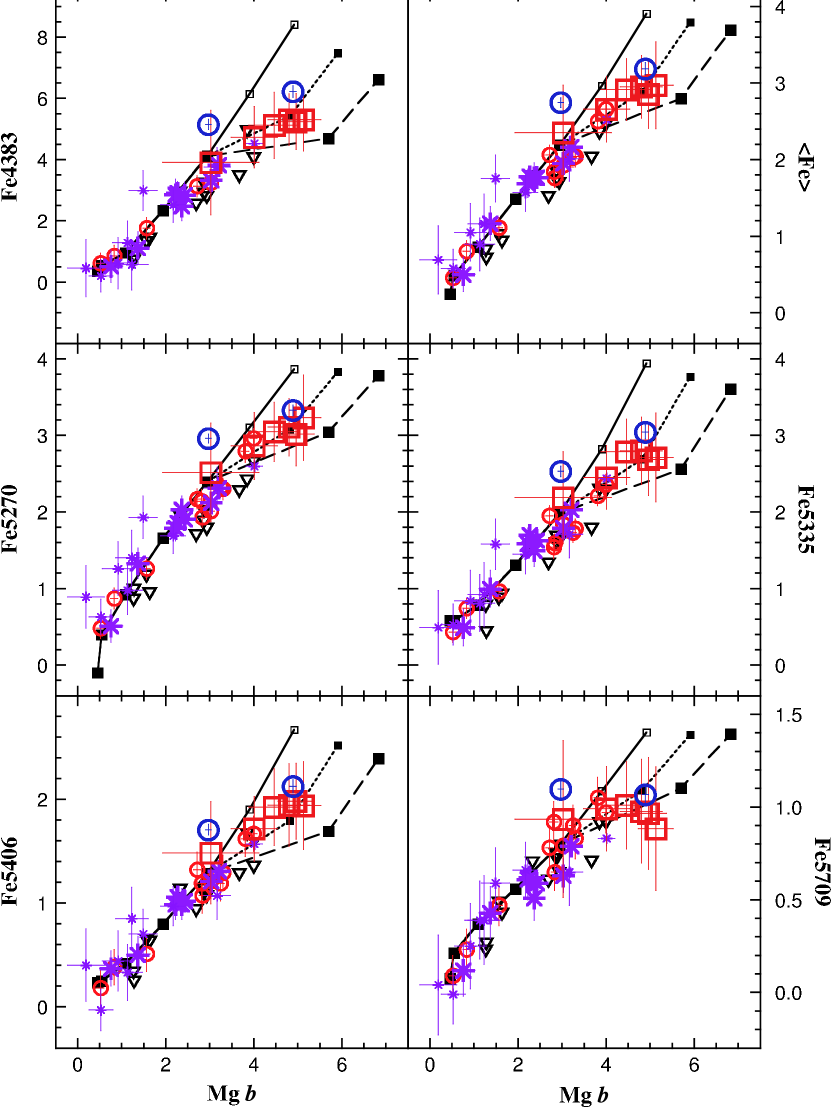
Fe4383: From the upper left panel of Figure 4, it is seen that Milky Way GCs are rather well traced by our models of Fe4383 though some appear mildly weaker (by 0.5 Å) at around [Fe/H] = 0.5 compared to our models. Nevertheless, this index is a promising substitute for the popularly used Fe5270 and Fe5335 if shorter wavelengths are available. Fe4383 an -anti-sensitive index. It decreases with increasing -enhancement, just as predicted by HTWB02. According to TB95, it is the most Fe-sensitive index (but according to HTWB02, that honor is bestowed upon Fe5335).
Fe5270, Fe5335, Fe999Fe = (Fe5270 + Fe5335)/2., Fe5406, Fe5709: The rest of Figure 4 depicts that both C98 and P02 are fairly well tracked by our models of these Fe-sensitive line indices. It is particularly interesting to note that C98’s NGC 6553 and NGC 6528 (the last two most metal-rich GCs) seem to suggest that NGC 6553, because it has slightly stronger indices, may be slightly more metal-rich than NGC 6528, contrary to usual literature values101010Barbuy et al. (2004) present [Fe/H] = 0.15 for NGC6528 and [Fe/H] = 0.20 for NGC6553, for instance.. Mainly because we are considering -enhancement at fixed [Fe/H], it is noted that these Fe-sensitive indices are rather -insensitive (i.e. contrary to the appearance of plots in TMB03a).
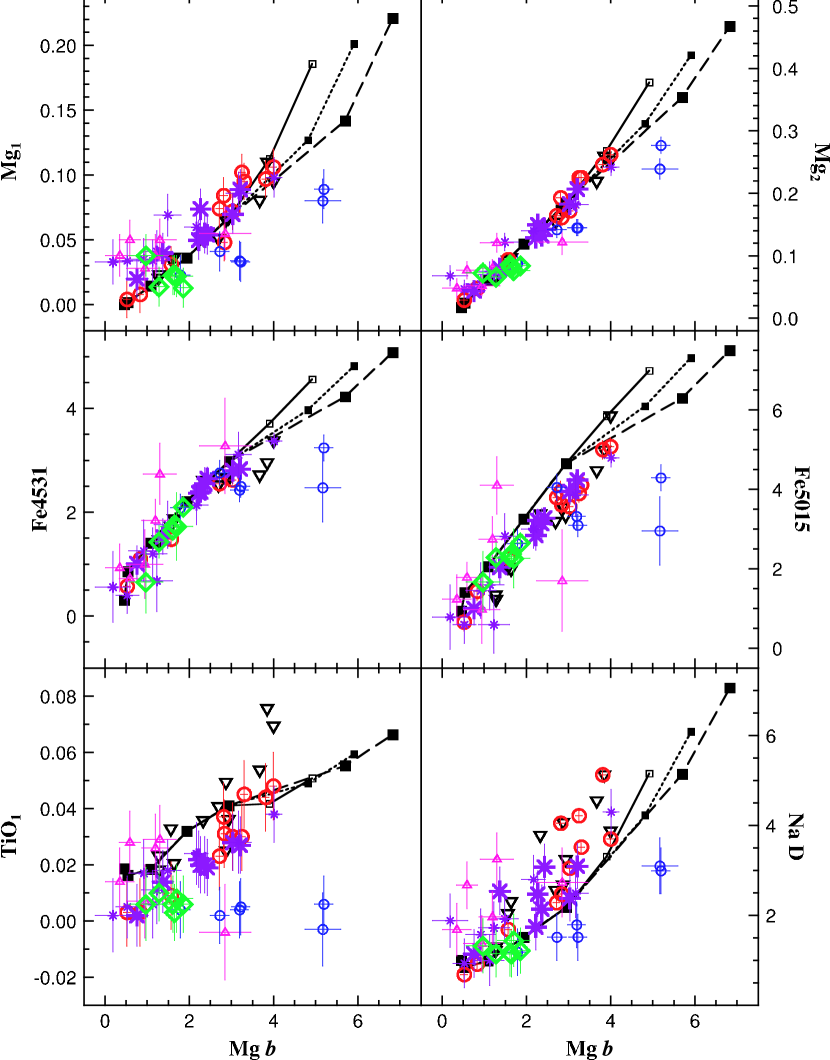
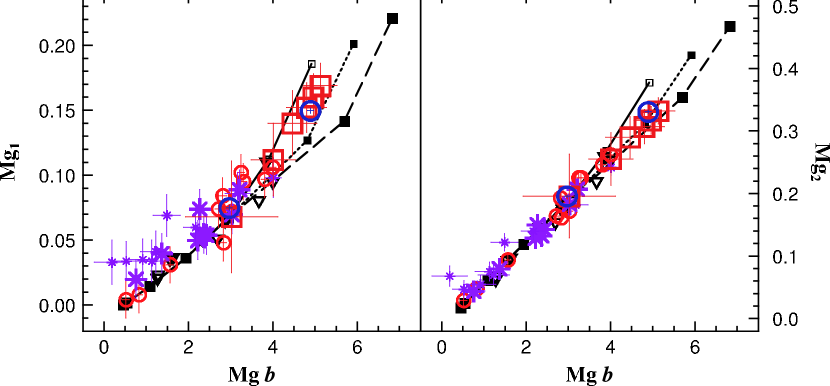
Mg1, Mg2, Mg : It is seen from Figure 5 that our models satisfactorily match both C98 and P02. Between NGC 6553 and NGC 6258, NGC 6553 is again consistently stronger than NGC 6528 in these Mg indices, according to C98. Every Mg index is highly sensitive to Mg abundance only, rather than abundance in general. They increase with increasing mostly due to Mg. Mg is the most Mg-sensitive index among them.
[MgFe]111111[MgFe] = .: The bottom right panel of Figure 5 depicts that our model of this Mg , Fe5270, Fe5335 combined index successfully traces the Milky Way GCs throughout the entire metallicity range.
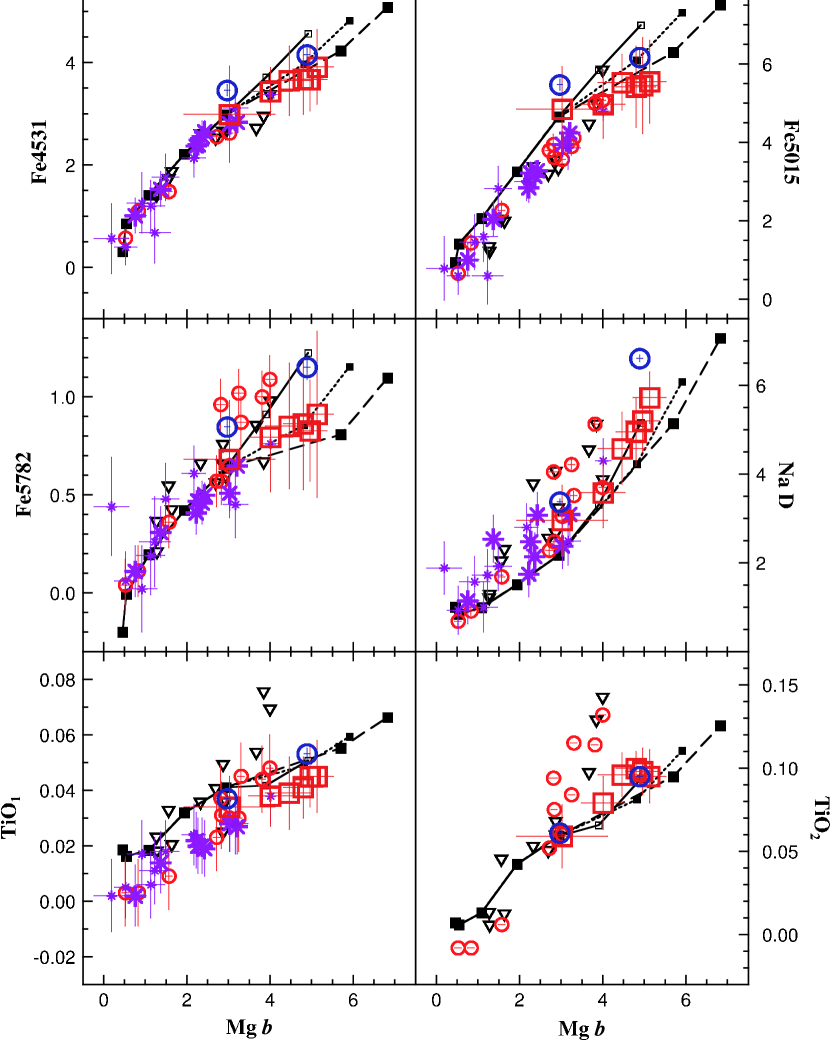
Fe4531, Fe5015: The upper right panel of Figure 6 shows that C98 are systematically weaker (by 0.5 Å) than our models of Fe5015 over the entire metallicity range (opposite of CN1, but similar to Ca4455 and TiO1). These two are Ti-sensitive indices according to TB95 and HTWB02. Both slightly increase with increasing -enhancement, mostly due to Ti.
Fe5782: In the middle left panel of Figure 6 the C98 points are relatively stronger, with large errors, compared to our models at the metal-rich regime. It is not an Fe-sensitive index but it responds negatively, albeit weakly, to increased .
Na D: The middle right panel of Figure 6 manifests that similar to TMB03a, our models are generally weaker than Milky Way GCs. Particularly, data are stronger than our models at 1.5 [Fe/H] 0.0. Note that the Worthey et al. (1994) fitting functions were corrected for interstellar Na D absorption, but that of the globular cluster indices have not. TMB03a suggests that the too-strong Na D indices may be due to the Na absorption in interstellar material, and this is certainly true at the level of a few tenths of an Å in equivalent width. In addition, similar to CN1 and CN2, it is possible that NaO anti-correlation phenomenon seen in globular cluster stars may have something to do with this mismatch (e.g., Gratton et al. 2001). Contrary to TMB03a, Na D heftily increases with increasing -enhancement mostly due to our assumed Na-enhancement, similar to Ca4227.
TiO1, TiO2: The bottom left panel of Figure 6 shows that C98 are systematically 0.010.02 mag weaker than our models in TiO1. For TiO2, we use the C98 original measurements because Beasley et al. (2004) did not measure this index. Possibly because of the differences between TB95 (no molecular TiO band effects) and HTWB02, both TiO1 and TiO2 increase with increasing -enhancement due to Ti- and O-enhancement.
From the above comparisons, we conclude that CN2, Ca4455, Fe5015, Fe5782, TiO2 may be rather ambiguous as chemical abundance indicators. It is also noted that some of metal line indices such as C24668, Fe5335, Fe5406, Na D, TiO1, TiO2 do not go monotonically with [Fe/H] at the metal-poor end (i.e., they become stronger at [Fe/H] 1.5). It is suggested from Fig. 7 of Gibson et al. (2003) that it is of great importance to check whether the metallicities of Milky Way globular clusters are safely reproduced from the models or not before the diagnostic diagrams such as Mg vs. Balmer lines are used for age estimation. With some notable exceptions, our models match the integrated feature strengths of GCs with considerable accuracy.
3.2 COMPARISON WITH M31 GLOBULAR CLUSTERS
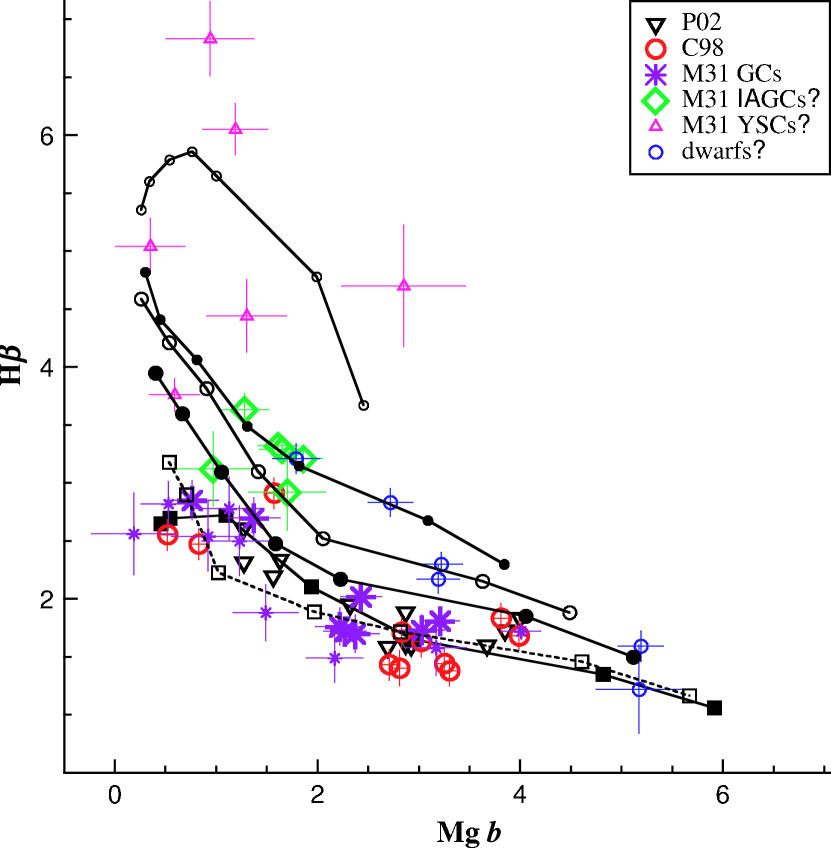
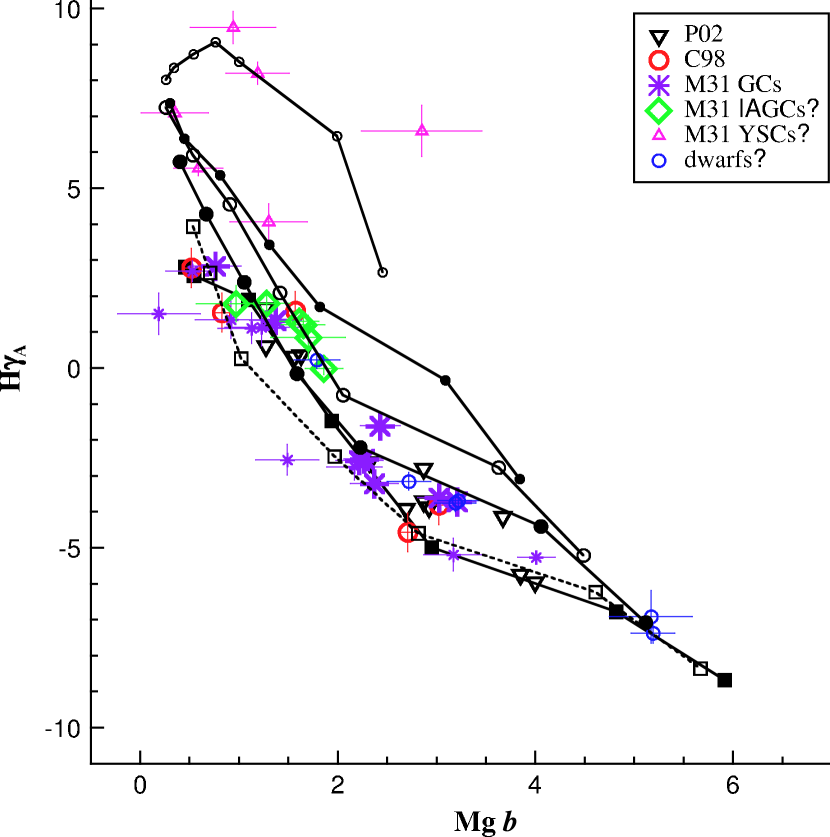
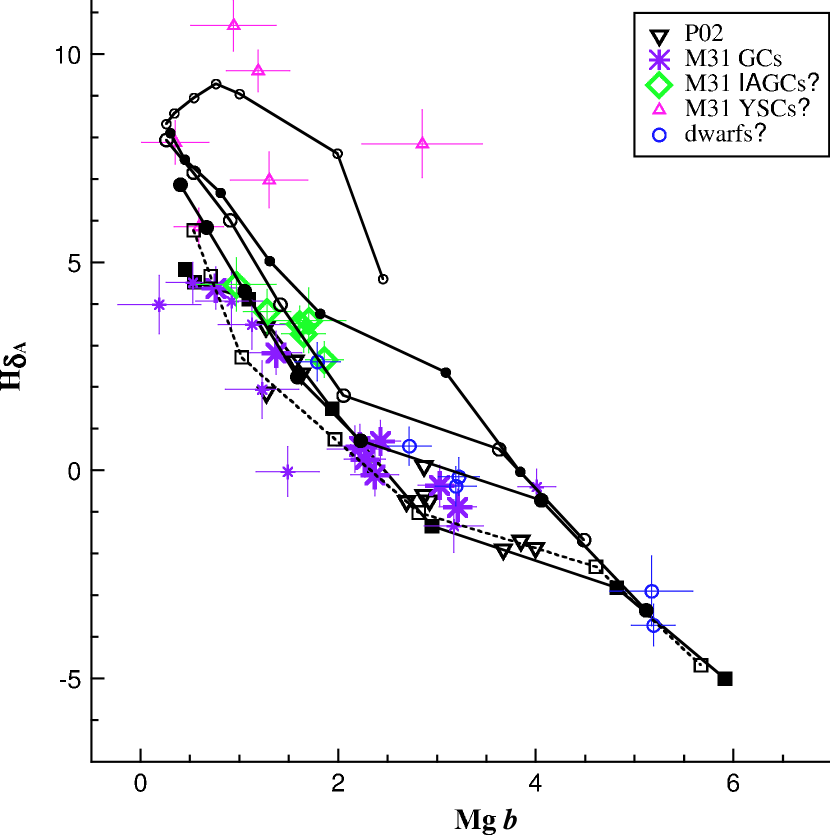
Having compared and examined our -enhanced models with Milky Way GCs, we apply our models to M31 GCs. In this study, we mainly use Beasley et al. (2004) Keck observations of M31 GCs listed in their Tables 1 and 4. Among their sample of M31 GCs, they have analyzed that 6 of them are possibly young star clusters (YSCs: depicted as triangles in our plots)121212They are 222-277, 314-037, 321-046, 322-049, 327-053, and 380-313., 6 of them are intermediate-age GCs (IAGCs: diamonds in our plots)131313They are 126-184, 292-010, 301-022, 337-068, NB 16, and NB 67. Please refer to Beasley et al. (2005) for the full description on the IAGCs., and 6 are suspected as the foreground dwarfs (small circles in our plots)141414They are NB 68, NB 74, NB 81, NB 83, NB 87, and NB 91.. Seventeen are left as bona fide old M31 GCs (see also Beasley et al. 2005). In our plots, however, we have depicted the genuine old M31 GCs with high S/N ( 60) using bigger asterisks151515They are 134-190, 158-213, 225-280, 234-290, 347-154, 365-284, 383-318, and NB 89. compared to the ones with low S/N (smaller asterisks)161616They are 163-217, 304-028, 310-032, 313-036, 328-054, 350-162, 393-330, 398-341, and 401-344.. Our plots are drawn mainly in Mg vs. Lick indices planes so that not only could we take advantage of one of the most -sensitive index (Mg ) but some direct comparisons with Fig. 2 of TMB03a are possible.
Our models in Figures 79 are the same as those in Figures 1 and 2. From Figures 79, the following is noted: (1) in general, our models satisfactorily match M31 GCs as well as Milky Way GCs at 12 Gyr without zero-point shifts which Thomas, Maraston, & Korn (2004; hereafter TMK04) models notably needed (see Beasley et al. (2005)’s Figs. 3, 4, 5), (2) The YSCs are consistently located around the 1 Gyr line, (3) The IAGCs are well-separated from the genuine old M31 GCs in the H diagram. In the H diagram, they may overlap with old clusters. At H and H, the IAGCs look 35 Gyr old, but they appear 25 Gyr old from H. The [Fe/H] of the IAGCs is confined between 1.0 and 0.5.
We predict that if the IAGCs are truly intermediate-age (25 Gyr) instead of old-age (12 Gyr) then they should NOT be detected with the GALEX far-UV photometry (see Fig. 2 of Lee et al. 2003). This also has implications for other suggested intermediate-age star clusters found among interacting galaxies (e.g., Goudfrooij et al. 2001). In this respect, it is very interesting to note that one M31 GC in particular, 311-033, has an age estimated at about 5 Gyr by Burstein et al. (2004) from its integrated spectra, but a recent HST CMD by Rich et al. (2005) clearly shows that this globular cluster has a well-developed blue horizontal-branch.
Figures 1012 show non-Balmer indices. In all diagrams we note that old M31 GCs mostly overlap with Milky Way GCs. Also, from the comparison with the two most metal-rich Milky Way GCs, NGC 6553 and NGC 6528, it seems that there is no super-solar metallicity M31 GC among Beasley et al. sample. In fact, the most metal-rich M31 GC from the Beasley et al. sample looks similar to the Galactic GCs NGC 6528 and NGC 6553 in Mg and it is 163-217 (small asterisk). Overall, the metallicity range of M31 globular clusters is similar to that of their Galactic counterparts, within sample selection effects and small number statistics. It is further noted that the YSCs stand out in the moderately age-sensitive CN and G4300 diagrams. Finally, for the purpose of weeding out foreground dwarfs (small circles), CN1, CN2, Mg1, Na D, and TiO1 look useful. The detailed descriptions of some notable indices are given below. Although we show YSCs, IAGCs, and dwarfs in our plots, we mainly describe the genuine old M31 GCs because our 12 Gyr models are compared with the data.
CN1, CN2: The top panels of Figure 10 show that M31 GCs are also systematically stronger than our models both in CN1 and CN2 by 0.04 mag similar to Milky Way GCs in Fig. 3171717We note that Beasley et al. (2004) and Burstein et al. (2004) recently report that M31 GCs have higher nitrogen abundance compared to Milky Way GCs using near-UV CN3883 Å and NH3360 Å features, respectively.. G4300, C24668: The middle panels of Figure 10 illustrate that M31 GCs data nicely overlap with C98 and our models. Ca4227: It is seen from the bottom left panel of Figure 10 that both the Milky Way and M31 GCs are systematically weaker than our models at the metal-rich ([Fe/H] 0.5) regime. Ca4455: The bottom right panel of Figure 10 shows that M31 GCs data overlap with C98 rather than P02 Milky Way data, albeit with some systematic offsets from our models.
Fe4383, Fe5270, Fe5335, Fe5406, Fe5709, Fe5782, Mg2, Fe4531: From Figures 11 and 12, it is seen that M31 GCs generally overlap with Milky Way GCs and with our models. Fe5015: The middle right panel of Figure 12 shows that M31 GCs go well with Milky Way GCs with similar amounts of systematic offset seen in Figure 6. Na D: The bottom right panel of Figure 12 shows that M31 GCs generally overlap with Milky Way GCs, suggesting some similar Na absorption in interstellar material and/or a possible NaO anti-correlation among M31 GC stars. TiO1: It is seen from the bottom left panel of Figure 12 that M31 GCs mostly overlap with C98, though with some systematic offset (0.010.02 mag) from our models.
3.3 COMPARISON WITH EARLY-TYPE GALAXIES
In this section, we investigate the -element enhancement phenomena among early-type galaxies, such as the well-known Mg enhancement that have been reported over the last decade (e.g., Worthey et al. 1992). Our primary data set is the Lick/IDS early-type galaxies of Trager et al. (1998). This data set has the advantage that it is on the Lick/IDS index system and that it contains a large number of galaxies. The set has two major disadvantages. First, the observational errors for any single galaxy are large, usually too large to have very useful age or metallicity discrimination. Second, the additional Balmer feature indices of Worthey & Ottaviani (1997) are not included. We gloss over the first problem for this paper by taking median values (really biweight locations; see below) and we fix the second problem by publishing here the H and H index measurements for almost all of the Trager et al. (1998) sample.
The treatment of the Balmer indices in the Lick/IDS data set proceeds much as outlined in Trager et al. (1998), and we refer readers to that paper for a more detailed explanation. In brief, the program AUTOINDEX, written by Jesús González, was used to measure the index values. This program cross-correlates spectral regions in the immediate neighborhood of the index wavelength definition to refine the wavelength scale before index measurement. Error estimation comes from a ratio of the power in pixel-to-pixel (assumed mostly photon statistics) variations to the total power in the spectrum, where the analysis is done in Fourier-transformed spectra. This factor was related to real measurement error by comparing with multiply-observed galaxies and scaled appropriately, as in Trager et al. (1998) section 3.
Velocity dispersion corrections were computed from artificially broadened templates that included G and K stars and low- galaxies. The multiplicative corrections are listed here [see Trager et al. (1998) equation 12] as a function of velocity dispersion . The Trager et al. (1998) Table 4 velocity dispersions were adopted.
| (3) | |||
| (4) | |||
| (5) | |||
| (6) |
The velocity dispersion corrections are among the mildest of the Lick/IDS index set. At km s-1, the corrections are about 10% for both H indices, and about 2% for both H indices. Thus, the contribution to the total error from velocity dispersion is almost negligible (although we included it). The error estimation scheme may not work as well for H as for H because it lies at the blue end of the spectrum, and therefore may suffer from photon noise in a somewhat more nonlinear way than the central portion of the spectrum that was used to calculate the Fourier parameter. Nevertheless, we present the index measurements and errors in Table 1 as our current best guess. The overall accuracy of the errors may, as in Trager et al. (1998), be as good as 5% for the H indices, but we doubt they are quite that good for H.
For purposes of plotting this noisy data set, the galaxy data are binned by velocity dispersion and listed in Table 2. Instead of mean and standard deviation, we derive the more robust Tukey biweight location and scale (Beers, Flynn, & Gebhardt, 1990; Tukey, 1958). We note that the smaller galaxies are observed to have a much broader intrinsic scatter. Median measurement error is about the same for the smaller galaxies as for the larger ones, so the increased scatter in small galaxies is intrinsic to the galaxies, not an artifact of photon statistics. The implication is that the driving parameters of the integrated spectrum (age, metallicity, nebular emission) are more varied in the small galaxies compared to the large ones. This agrees with earlier inferences from the same Lick/IDS data set (Worthey, 1996, 1998) but also from considerations of the Mg- diagram (Bender et al., 1993; Worthey & Collobert, 2003), where nebular emission is not a factor.
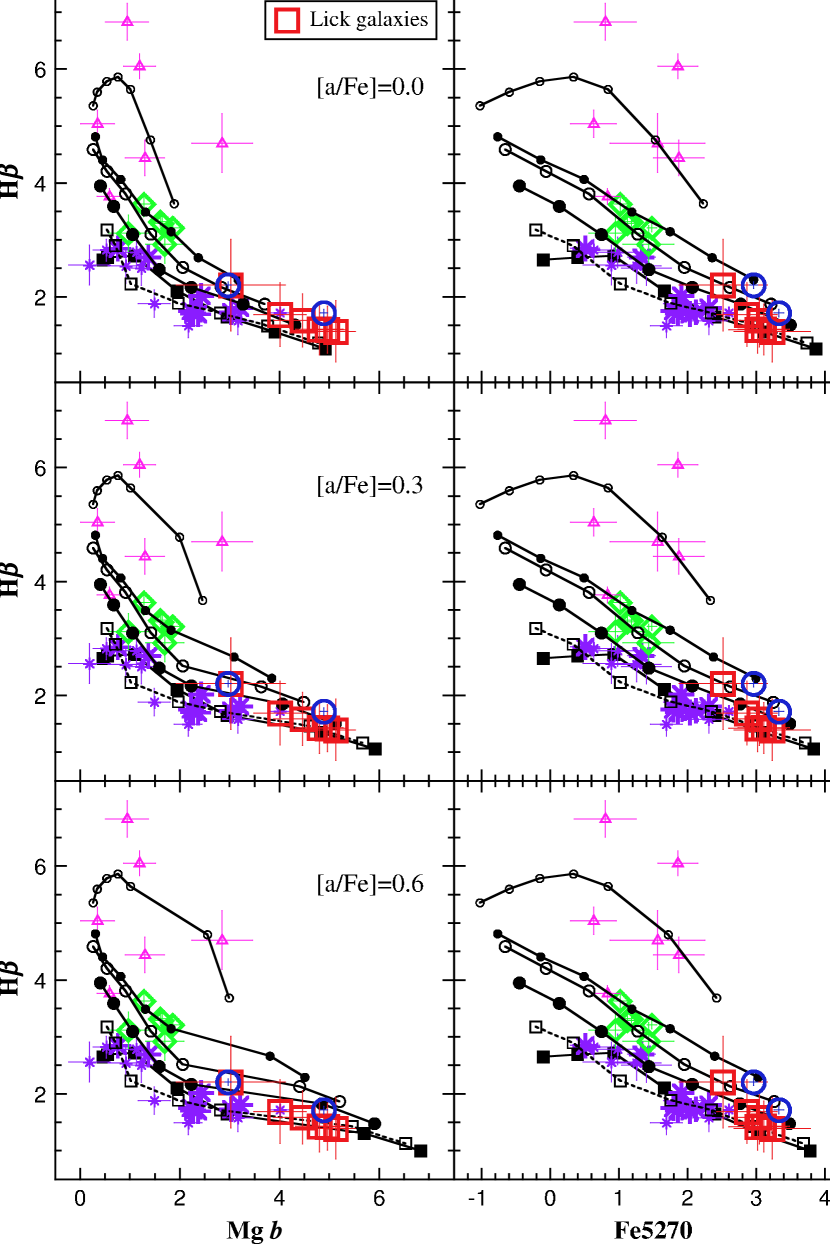
In Figures 1319, the -binned median galaxy indices are depicted as large open squares. In addition to the median data, two individual galaxies with low observational errors, M31 (big open circle on the metal-rich side) and M32 (big open circle on the metal-poor side), are also plotted. Figures 13 and 14 show Balmer index diagrams, while Figures 1519 show metallic features. What we look into from these plots are the SSP-equivalent ages and metallicities of galaxies because they are generally composed of mixtures of stellar populations with a range of ages and metallicities.
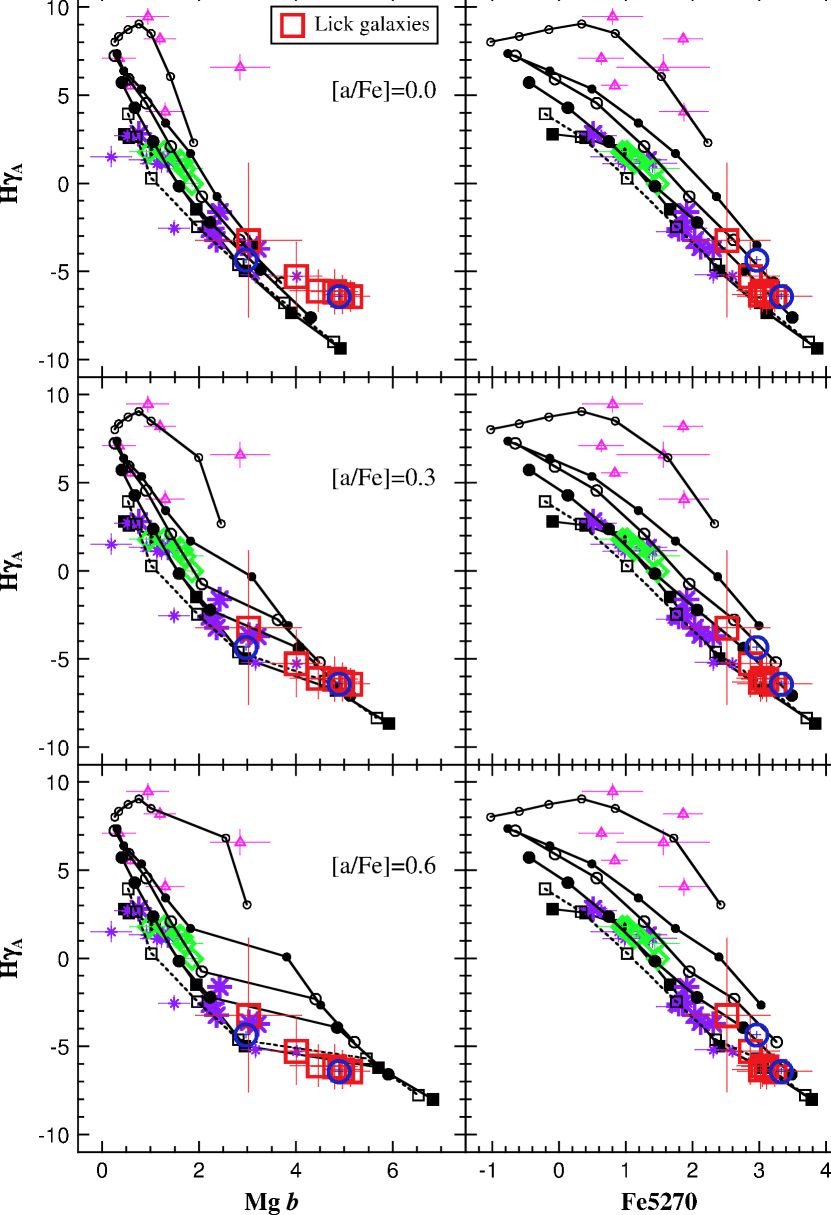
Figure 13 shows a comparison of Lick/IDS early-type galaxies with our models in Mg vs. H (left panel) and in Fe5270 vs. H (right panel). M31 star clusters of all ages are also plotted. The top pair of panels has [/Fe] = 0, the middle pair of panels has [/Fe] = +0.3, and the bottom pair of panels has [/Fe] = +0.6, applied only at [Fe/H] = 0.0 and +0.5 as usual. The high -sensitivity of Mg (left panel) and the -sensitivity of Fe5270 (right panel) are abundantly illustrated. Figure 14 is a clone of Figure 13, except using H instead of H in order to show the -sensitivity of H181818All our other models of high-order Balmer line indices (H, H, and H) are also similarly significantly -sensitive confirming the previous work of TMK04 (cf., Tantalo & Chiosi 2004). They are available at our website, http://astro.wsu.edu/hclee/sp.html..
As we apply our various -enhanced models to the data in Figures 13 and 14, we find that vastly different age, [Fe/H], and [/Fe] estimation is possible for the early-type galaxies depending upon the selected combination of metal lines and Balmer lines. The well-known Mg enhancement is prominent from upper panels of Figures 13 and 14 as galaxy data are compared with our models from solar-scaled isochrones without HTWB02 treatment. It is seen from middle panels of Figures 13 and 14, however, that our models of [/Fe] = +0.3 dex consistently give a similar estimation of age and metallicity both from Mg and Fe5270 for high- galaxies.
The low galaxies ( 100 km/sec) that have the lowest values in Mg and Fe5270 have consistent ages only in the [/Fe]=0 panels, as one would expect from, e.g. Figure 17. The median low galaxy also looks younger than high counterparts in Figures 13 and 14 (see also Caldwell, Rose, & Concannon 2003), but of course the scatter in this bin is larger, so old-and-small galaxies do exist.
We turn now to the metallic indices plotted in Figures 1519. The Lick IDS early-type galaxies plotted against our models, particularly from Figure 17, show that they are generally of 0.5 [Fe/H] +0.2 with [/Fe] +0.3 dex. It is also seen from Figure 17 that the [/Fe] of galaxies, at least as traced by Mg and Na, seems to increase with increasing velocity dispersion (Trager et al., 2000b). As Milky Way and bona fide old M31 GCs are compared with Lick/IDS early-type galaxies in Figures 1519, the following details are also noted.
Mg: The well-known Mg enhancement phenomenon of early-type galaxies is again confirmed from our models of Mg vs. Fe4383 in the top left panel of Figure 17 show this issue more clearly, because Mg is strongly -sensitive while Fe4383 is --sensitive.
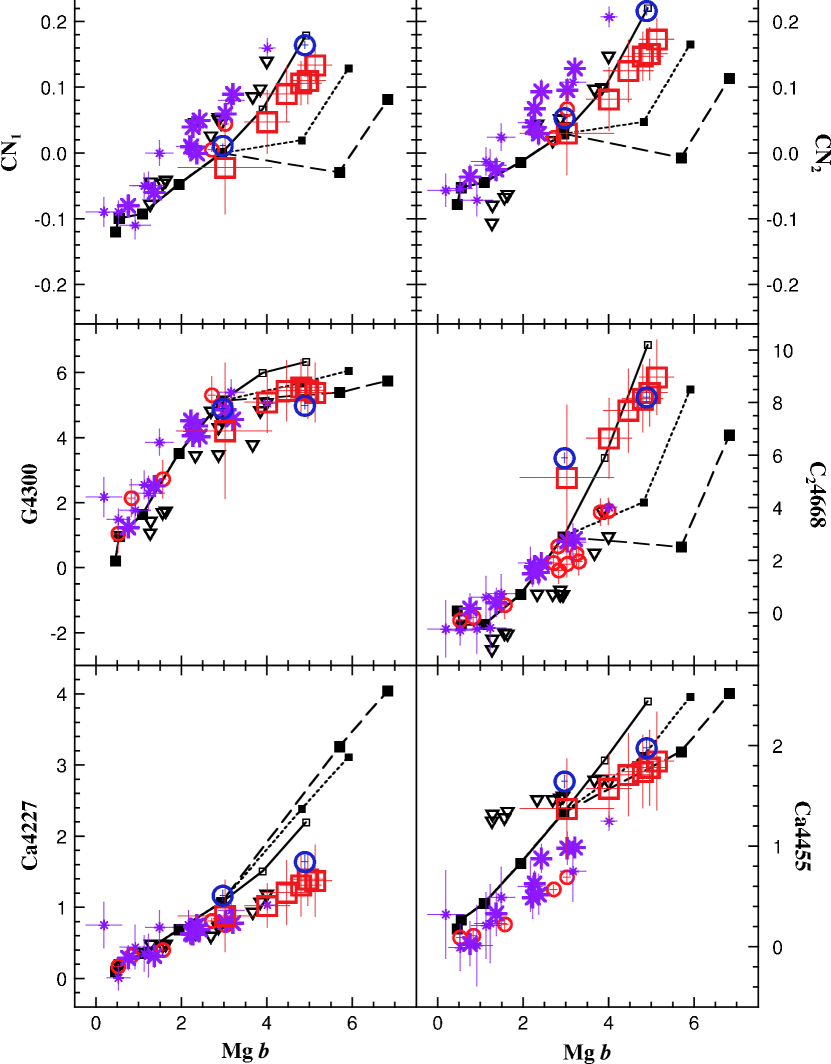
CN1, CN2: The top panels of Figure 15 show that Lick/IDS early-type galaxies are systematically of lower values than the Milky Way and M31 GCs both in CN1 and CN2 by 0.030.04 mag (see also Fig. 3 of Beasley et al. 2004). Assuming no problems with the data, this points out a distinct difference between globular clusters and early-type galaxies. We speculate that the globular cluster environment is perhaps special and different from that of galaxies, and that this is manifested in the CN index strengths either due to N abundance effects, or perhaps a CH-CN bimodality phenomenon. The same behavior is seen in CN diagrams versus Fe indices.
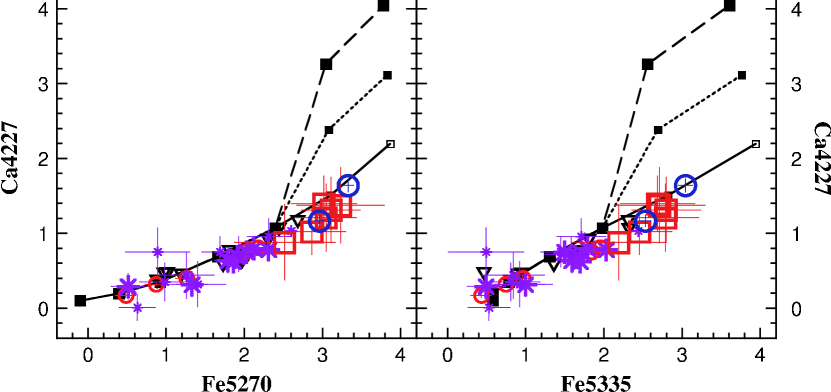
Ca4227: As shown in the bottom left panel of Figure 15, all the metal-rich ([Fe/H] 0.5) Milky Way and M31 GCs and Lick/IDS early-type galaxies are of systematically lower Ca4227 values compared to our models. The “Ca underabundance” (e.g., TMB03b; Cenarro et al. 2004) of early-type galaxies is manifested here. Figure 16 shows, however, that Ca4227 vs. Fe indices does not show any significant under- or over-abundance. That is, in diagrams involving Fe indices, the galaxies follow the scaled-solar models. We tend to agree with Worthey (1998) that while Mg, Na, and perhaps N are enhanced with respect to Fe, Ca is not.
TiO1 and TiO2: It is seen from the bottom left panel of Figure 19 that Lick/IDS early-type galaxies overlap and extend the metal-rich end of the Milky Way (C98) and M31 GCs. Curiously, many GCs appear to have much stronger TiO absorption than the most metal-rich of galaxies. Perhaps some stochastic effect can account for this, but our favorite explanation is another appeal to the slippery transformation from CCD to Lick/IDS systems. In this case, the TiO indices are both broad in wavelength and at the red end of the spectrum, both of which leave the index especially sensitive to systematic errors induced by spectrophotometric shape effects.
4 SUMMARY & CONCLUSION
In this study we presented new simple stellar population models that predict 25 Lick IDS index strengths and cover a broad range of age and metallicity. They include -element enhancement by virtue of the fact that they are based on the -enhanced isochrones and HTWB02 response functions for Lick IDS indices. The effects from horizontal-branch stars are fully incorporated.
Among Balmer lines, a significant -enhancement effect was noted for H and H, but H is rather -sensitive. We also find that our 5 Gyr and 12 Gyr models of H and H overlap at the metal-poor regime because of blue horizontal-branch stars. It is further noted that younger than 1 Gyr and for metal-poor populations, Balmer lines become weaker because the main-sequence turnoff becomes hotter than 10,000 K.
Our -enhanced models are presented at fixed [Fe/H], therefore making it straightforward to test our models using Milky Way globular clusters that have independently-estimated mean [Fe/H] and [/Fe]. At the solar and super-solar metallicity end, we have further employed the updated Lick IDS index response functions by HTWB02 so that we could assess element enhancement in early-type galaxies. Our models should be useful for distant unresolved stellar systems in order to extract some useful information on their age, metallicity, and -enhancement.
From the comparisons of our models with observations of Milky Way and M31 GCs, we find that our models of Balmer lines satisfactorily trace them at 12 Gyr without the need for zero-point shifts which some previous models require. We also verify the plausible existence of young and intermediate-age star clusters in M31 that Beasley et al. (2004, 2005) recently claimed. We derive their ages at around 1 Gyr and 25 Gyr, respectively, from our models. We predict that these latter ones are truly intermediate-age (25 Gyr) instead of old-age (12 Gyr) if they are not detected with GALEX far-UV photometry. We do not find any super-solar metallicity M31 GCs from Beasley et al. (2004)’s sample. The metallicity range of M31 GCs in Beasley et al. (2004) is similar to that of their Galactic counterparts. Contrary to the literature values, the Milky Way GC NGC 6553 appears slightly more metal-rich than NGC 6528 based on the strength of their metal indices.
We confirm and understand the well-known Mg enhancement phenomenon among metal-rich early-type galaxies. Our models with [/Fe] = +0.3 dex consistently provide similar estimation of age and metallicity both from Mg and Fe indices. Also, it is noted that [/Fe] of galaxies, as traced by Mg and Na indices, seems to increase with increasing velocity dispersion (but Ca tracks Fe). Moreover, and independent of models, GCs and galaxies follow different tracks in diagrams involving CN1 and CN2. This may be telling us something about N abundance or CH-CN bimodality that is generically different in the globular cluster environment as opposed to the elliptical galaxy environment. It is tempting to speculate that either the extremely high stellar density in globular clusters or some type of partial self-enrichment in globular clusters is the physical driver behind this intriguing difference. Finally, we stress that it is of considerable importance to use these -enhanced Lick indices in order to properly assess the mean age and chemical compositions of early-type galaxies.
| Object | H | H | H | H | ||||
|---|---|---|---|---|---|---|---|---|
| A 569A | -2.596 | 1.322 | -4.961 | 0.810 | -0.178 | 0.508 | -1.326 | 0.460 |
| IC 171 | -2.017 | 2.215 | -5.731 | 1.371 | -0.506 | 0.874 | -1.123 | 0.772 |
| IC 179 | -3.214 | 1.704 | -5.654 | 1.046 | -1.263 | 0.669 | -1.665 | 0.593 |
| IC 310 | -0.176 | 1.355 | -3.612 | 0.830 | 0.779 | 0.525 | -1.324 | 0.472 |
| IC 1696 | -1.466 | 1.251 | -5.260 | 0.776 | 0.945 | 0.499 | -0.777 | 0.437 |
| IC 1907 | -2.842 | 1.972 | -5.305 | 1.206 | -0.987 | 0.760 | -1.048 | 0.680 |
| IC 2955 | -2.277 | 1.372 | -7.964 | 0.848 | 0.064 | 0.538 | -2.808 | 0.488 |
| IC 4051 | -2.311 | 2.604 | -4.136 | 1.598 | -0.010 | 1.003 | -0.813 | 0.900 |
| NGC 80 | -3.224 | 2.006 | -5.068 | 1.209 | -0.293 | 0.739 | -1.626 | 0.687 |
| NGC 83 | -1.130 | 2.055 | -3.526 | 1.253 | -0.067 | 0.778 | -1.916 | 0.713 |
| NGC 128 | -5.698 | 0.888 | 0.010 | 0.562 | -1.470 | 0.503 | ||
| NGC 194 | -1.074 | 1.108 | -4.709 | 0.682 | 0.154 | 0.431 | -0.923 | 0.386 |
| NGC 205 | 6.707 | 1.178 | 4.951 | 0.739 | 4.728 | 0.498 | 4.621 | 0.419 |
| NGC 221 | -1.138 | 0.264 | -4.341 | 0.166 | 0.669 | 0.109 | -0.416 | 0.093 |
| NGC 224 | -2.514 | 0.276 | -6.405 | 0.167 | -0.027 | 0.106 | -1.394 | 0.107 |
| NGC 227 | -0.854 | 1.112 | -6.562 | 0.677 | 0.715 | 0.427 | -2.244 | 0.403 |
| NGC 315 | -2.909 | 2.305 | -6.544 | 1.375 | 1.080 | 0.841 | -2.967 | 0.802 |
Note. — Table 1 appears in its entirety in the electronic edition of the Astrophysical Journal Supplement Series.
| LOSVD km s-1 | CN1 | CN2 | Ca4227 | G4300 | Fe4383 | Ca4455 | Fe4531 | C24668 | H | Fe5015 | Mg1 | Mg2 | Mg |
|---|---|---|---|---|---|---|---|---|---|---|---|---|---|
| -0.022 | 0.030 | 0.880 | 4.208 | 3.905 | 1.375 | 2.991 | 5.089 | 2.204 | 4.852 | 0.068 | 0.196 | 3.021 | |
| 0.071 | 0.063 | 0.505 | 2.080 | 1.704 | 0.495 | 0.936 | 2.552 | 0.802 | 1.087 | 0.043 | 0.067 | 1.094 | |
| 29 | 29 | 29 | 27 | 29 | 29 | 29 | 29 | 26 | 25 | 27 | 27 | 29 | |
| 100 — 150 | 0.047 | 0.082 | 1.024 | 5.096 | 4.733 | 1.576 | 3.435 | 6.481 | 1.687 | 4.975 | 0.112 | 0.255 | 4.012 |
| 0.048 | 0.048 | 0.308 | 0.941 | 0.999 | 0.333 | 0.464 | 1.400 | 0.561 | 0.872 | 0.028 | 0.042 | 0.523 | |
| 47 | 47 | 47 | 45 | 47 | 47 | 47 | 47 | 46 | 44 | 47 | 47 | 47 | |
| 150 — 200 | 0.090 | 0.125 | 1.207 | 5.437 | 5.121 | 1.711 | 3.644 | 7.449 | 1.585 | 5.532 | 0.140 | 0.290 | 4.465 |
| 0.042 | 0.047 | 0.449 | 0.924 | 1.081 | 0.410 | 0.675 | 1.463 | 0.463 | 0.712 | 0.025 | 0.033 | 0.575 | |
| 86 | 86 | 86 | 83 | 86 | 86 | 86 | 86 | 82 | 80 | 86 | 86 | 85 | |
| 200 — 240 | 0.106 | 0.147 | 1.312 | 5.548 | 5.298 | 1.742 | 3.674 | 7.871 | 1.427 | 5.415 | 0.152 | 0.307 | 4.799 |
| 0.033 | 0.037 | 0.437 | 0.854 | 0.845 | 0.362 | 0.681 | 1.176 | 0.446 | 1.038 | 0.019 | 0.027 | 0.477 | |
| 80 | 80 | 81 | 78 | 81 | 81 | 81 | 81 | 80 | 79 | 80 | 80 | 80 | |
| 240 — 280 | 0.110 | 0.151 | 1.395 | 5.456 | 5.244 | 1.781 | 3.672 | 8.078 | 1.420 | 5.451 | 0.160 | 0.317 | 4.963 |
| 0.035 | 0.040 | 0.366 | 0.867 | 0.916 | 0.372 | 0.614 | 1.177 | 0.414 | 1.226 | 0.018 | 0.022 | 0.409 | |
| 71 | 71 | 68 | 71 | 71 | 71 | 71 | 71 | 69 | 68 | 70 | 70 | 70 | |
| 0.134 | 0.173 | 1.374 | 5.388 | 5.297 | 1.846 | 3.915 | 8.621 | 1.393 | 5.550 | 0.169 | 0.332 | 5.127 | |
| 0.027 | 0.031 | 0.500 | 0.899 | 1.013 | 0.489 | 0.727 | 1.314 | 0.540 | 1.061 | 0.017 | 0.021 | 0.392 | |
| 42 | 42 | 42 | 42 | 42 | 42 | 42 | 42 | 41 | 41 | 41 | 41 | 42 |
| LOSVD km s-1 | Fe5270 | Fe5335 | Fe5406 | Fe5709 | Fe5782 | Na D | TiO1 | TiO2 | H | H | H | H | |
|---|---|---|---|---|---|---|---|---|---|---|---|---|---|
| 2.517 | 2.187 | 1.485 | 0.935 | 0.682 | 2.952 | 0.034 | 0.059 | 0.698 | -3.227 | 1.481 | -0.436 | ||
| 0.641 | 0.601 | 0.492 | 0.423 | 0.300 | 0.790 | 0.011 | 0.019 | 3.263 | 4.369 | 1.669 | 2.436 | ||
| 29 | 29 | 27 | 25 | 24 | 28 | 29 | 20 | 29 | 27 | 29 | 29 | ||
| 100 — 150 | 2.863 | 2.452 | 1.716 | 0.992 | 0.794 | 3.579 | 0.038 | 0.079 | -1.205 | -5.260 | 0.450 | -1.516 | |
| 0.437 | 0.418 | 0.313 | 0.228 | 0.279 | 0.792 | 0.011 | 0.016 | 1.553 | 1.894 | 0.757 | 1.176 | ||
| 47 | 47 | 45 | 45 | 45 | 47 | 47 | 28 | 45 | 45 | 46 | 46 | ||
| 150 — 200 | 3.045 | 2.785 | 1.925 | 1.009 | 0.852 | 4.575 | 0.039 | 0.096 | -2.153 | -6.103 | 0.206 | -1.917 | |
| 0.384 | 0.426 | 0.371 | 0.236 | 0.320 | 0.812 | 0.013 | 0.013 | 1.129 | 1.178 | 0.714 | 0.760 | ||
| 85 | 83 | 76 | 71 | 81 | 86 | 86 | 44 | 82 | 80 | 85 | 86 | ||
| 200 — 240 | 3.107 | 2.795 | 1.945 | 0.977 | 0.862 | 4.942 | 0.041 | 0.100 | -2.344 | -6.154 | -0.017 | -1.951 | |
| 0.375 | 0.440 | 0.398 | 0.280 | 0.335 | 0.760 | 0.011 | 0.010 | 1.105 | 1.260 | 0.640 | 0.780 | ||
| 79 | 79 | 76 | 69 | 79 | 81 | 81 | 30 | 80 | 75 | 80 | 81 | ||
| 240 — 280 | 3.018 | 2.687 | 1.983 | 0.965 | 0.827 | 5.192 | 0.045 | 0.098 | -2.359 | -6.317 | 0.013 | -1.952 | |
| 0.417 | 0.475 | 0.367 | 0.302 | 0.258 | 0.703 | 0.011 | 0.014 | 1.057 | 1.076 | 0.518 | 0.566 | ||
| 70 | 66 | 67 | 64 | 70 | 71 | 71 | 19 | 70 | 70 | 70 | 70 | ||
| 3.230 | 2.712 | 1.940 | 0.883 | 0.911 | 5.718 | 0.045 | 0.095 | -2.860 | -6.413 | -0.146 | -2.112 | ||
| 0.557 | 0.580 | 0.422 | 0.333 | 0.424 | 0.582 | 0.013 | 0.016 | 0.763 | 0.866 | 0.557 | 0.472 | ||
| 42 | 41 | 39 | 36 | 40 | 42 | 42 | 8 | 41 | 42 | 42 | 42 |
References
- Barbuy et al. (2004) Barbuy, B., et al. 2004, MmSAI, 75, 398
- Beasley et al. (2004) Beasley, M. A., Brodie, J. P., Strader, J., Forbes, D. A., Proctor, R. N., Barmby, P. & Huchra, J. P. 2004, AJ, 128, 1623
- Beasley et al. (2005) Beasley, M. A., Brodie, J. P., Strader, J., Forbes, D. A., Proctor, R. N., Barmby, P. & Huchra, J. P. 2005, AJ, 129, 1412
- Beers, Flynn, & Gebhardt (1990) Beers, T. C., Flynn, K., & Gebhardt, K. 1990, AJ, 100, 32
- Bender et al. (1993) Bender, R., Burstein, R., & Faber, S. M. 1993, ApJ, 411, 153
- Burstein et al. (1984) Burstein, D., Faber, S. M., Gaskell, C. M., & Krumm, N. 1984, ApJ, 287, 586
- Burstein et al. (2004) Burstein, D., et al. 2004, ApJ, 614, 158
- Caldwell, Rose, & Concannon (2003) Caldwell, N., Rose, J. A., & Concannon, K. D. 2003, AJ, 125, 2891
- Cannon et al. (1998) Cannon, R. D., et al. 1998, MNRAS, 298, 601
- Carney (1996) Carney, B. W. 1996, PASP, 108, 900
- Cenarro et al. (2004) Cenarro, A. J., Sánchez-Blázquez, P., Cardiel, N., & Gorgas, J. 2004, ApJ, 614, L101
- Cohen, Blakeslee, & Ryzhov (1998) Cohen, J. G., Blakeslee, J. P., & Ryzhov, A. 1998, ApJ, 496, 808 (C98)
- Gibson et al. (1999) Gibson, B. K., Madgwick, D. S., Jones, L. A., Da Costa, G. S., & Norris, J. E. 1999, AJ, 118, 1268
- Gibson et al. (2003) Gibson, B. K., Fenner, Y., Renda, A., Kawata, D., & Lee, H.-c. 2003, PASA, 20, 401
- Goudfrooij et al. (2001) Goudfrooij, P., Mack, J., Kissler-Patig, M., Meylan, G., & Minniti, D. 2001, MNRAS, 322, 643
- Gratton et al. (2001) Gratton, R., et al. 2001, A&A, 369, 87
- Harbeck, Smith, & Grebel (2003) Harbeck, D., Smith, G. H., & Grebel, E. K. 2003, AJ, 125, 197
- Harris (1996) Harris, W. E. 1996, AJ, 112, 1487
- Houdashelt et al. (2002) Houdashelt, M. L., Trager, S. C., Worthey, G., & Bell, R. A. 2002, BAAS, 34, 1118 (HTWB02)
- Kim et al. (2002) Kim, Y.-C., Demarque, P., Yi, S. K., & Alexander, D. R. 2002, ApJS, 143, 499
- Langer, Suntzeff, & Kraft (1992) Langer, G. E., Suntzeff, N. B., & Kraft, R. P. 1992, PASP, 104, 523
- Lee, Yoon, & Lee (2000) Lee, H.-c., Yoon, S.-J., & Lee, Y.-W. 2000, AJ, 120, 998
- Lee, Lee, & Gibson (2002) Lee, H.-c., Lee, Y.-W., & Gibson, B. K. 2002, AJ, 124, 2664
- Lee, Lee, & Gibson (2003) Lee, H.-c., Lee, Y.-W., & Gibson, B. K. 2003, Extragalactic Globular Cluster Systems, ed. M. Kissler-Patig, 261
- Lee, Demarque, & Zinn (1994) Lee, Y.-W., Demarque, P., & Zinn, R. 1994, ApJ, 423, 248
- Lejeune, Cuisinier, & Buser (1997) Lejeune, T., Cuisinier, F., & Buser, R. 1997, A&AS, 125, 229
- Lejeune, Cuisinier, & Buser (1998) Lejeune, T., Cuisinier, F., & Buser, R. 1998, A&AS, 130, 65
- Maraston et al. (2003) Maraston, C. et al. 2003, A&A, 400, 823
- Puzia et al. (2002) Puzia, T. H., et al. 2002, A&A, 395, 45 (P02)
- Ramírez & Cohen (2003) Ramírez, S. V., & Cohen, J. G. 2002, AJ, 125, 224
- Reimers (1975) Reimers, D. 1975, Mém. Roy. Soc. Liège 6. Ser. 8, 369
- Rich et al. (2005) Rich, R. M., et al. 2005, AJ, 129, 2670
- Salasnich et al. (2000) Salasnich, B., Girardi, L., Weiss, A., & Chiosi, C. 2000, A&A, 361, 1023
- Salpeter (1955) Salpeter, E. E. 1955, ApJ, 121, 161
- Tantalo & Chiosi (2004) Tantalo, R., & Chiosi, C. 2004, MNRAS, 353, 917
- Thomas & Maraston (2003) Thomas, D., & Maraston, C. 2003, A&A, 401, 429
- Thomas, Maraston, & Bender (2003a) Thomas, D., Maraston, C., & Bender, R. 2003a, MNRAS, 339, 897 (TMB03a)
- Thomas, Maraston, & Bender (2003b) Thomas, D., Maraston, C., & Bender, R. 2003b, MNRAS, 343, 279 (TMB03b)
- Thomas, Maraston, & Korn (2004) Thomas, D., Maraston, C., & Korn, A. 2004, MNRAS, 351, L19 (TMK04)
- Trager et al. (1998) Trager, S. C., Worthey, G., Faber, S. M., Burstein, D., & Gonzalez, J. J. 1998, ApJS, 116, 1
- Trager et al. (2000a) Trager, S. C., Faber, S. M., Worthey, G., & Gonzalez, J. J. 2000a, AJ, 119, 1645
- Trager et al. (2000b) Trager, S. C., Faber, S. M., Worthey, G., & Gonzalez, J. J. 2000b, AJ, 120, 165
- Tripicco & Bell (1995) Tripicco, M. J., & Bell, R. A. 1995, AJ, 110, 3035 (TB95)
- Tukey (1958) Tukey, J. W., 1958, Ann. Math. Stat., 29, 614
- Wheeler, Sneden, & Truran (1989) Wheeler, J. C., Sneden, C., & Truran, J. W., Jr. 1989, ARA&A, 27, 279
- Worthey (1996) Worthey, G. 1996, in From Stars to Galaxies: The Impact of Stellar Physics on Galaxy Evolution, ed. C. Leitherer, U. Fritze-von Alvensleben, & J. Huchra, ASP Conf. Ser. 98, 467
- Worthey (1998) Worthey, G. 1998, PASP, 110, 888
- Worthey (2004) Worthey, G. 2004, AJ, 128, 2826
- Worthey & Collobert (2003) Worthey, G., & Collobert, M. 2003, ApJ, 586, 17
- Worthey, Faber, & González (1992) Worthey, G., Faber, S. M., & González, J. J. 1992, ApJ, 398, 69
- Worthey et al. (1994) Worthey, G., Faber, S. M., González, J. J., & Burstein, D. 1994, ApJS, 94, 687
- Worthey & Ottaviani (1997) Worthey, G., & Ottaviani, D. L. 1997, ApJS, 111, 377
- Yi, Demarque, & Kim (1997) Yi, S., Demarque, P., & Kim, Y.-C. 1997, ApJ, 482, 677