On the Identification of High Mass Star Forming Regions using IRAS: Contamination by Low-Mass Protostars
Abstract
We present the results of a survey of a small sample (14) of low-mass protostars ( L⊙) for 6.7 GHz methanol maser emission performed using the ATNF Parkes radio telescope. No new masers were discovered. We find that the lower luminosity limit for maser emission is near L⊙, by comparison of the sources in our sample with previously detected methanol maser sources. We examine the IRAS properties of our sample and compare them with sources previously observed for methanol maser emission, almost all of which satisfy the Wood & Churchwell criterion for selecting candidate UCHII regions. We find that about half of our sample satisfy this criterion, and in addition almost all of this subgroup have integrated fluxes between 25 and 60 m that are similar to sources with detectable methanol maser emission. By identifying a number of low-mass protostars in this work and from the literature that satisfy the Wood & Churchwell criterion for candidate UCHII regions, we show conclusively for the first time that the fainter flux end of their sample is contaminated by lower-mass non-ionizing sources, confirming the suggestion by van der Walt and Ramesh & Sridharan.
Subject headings:
circumstellar matter – ISM: clouds – masers – stars: formation1. Introduction
Through their stellar winds, UV radiation, molecular outflows, and eventual death as supernova, high mass stars (M⊙, or earlier than B2) have a profound influence on their local environment and collectively on the Galaxy as a whole. The past 15 years has seen renewed interest in the study of high mass star formation (HMSF). This can be directly traced to three main factors: (1) the use of the IRAS catalog to identify large numbers of candidate HMSF regions, (2) the discovery of Class II methonal maser emission and its clear association with known regions of HMSF, and (3) improvements in both resolution and sensitivity at infrared and longer wavelengths. The recent realization that most stars form in dense clusters adds a new dimension to HMSF studies. Embedded clusters may be the basic unit of star formation (Lada & Lada 2003), many dominated by ionizing OB stars, so the study of the earliest stages of HMSF is of direct importance to star formation as a whole.
The IRAS Point Source Catalog (PSC; Beichman et al. 1985) has been used over the past 15 years to define samples of candidate HMSF regions, in particular ultra-compact HII (UCHII) regions. Wood & Churchwell (1989, hereafter WC89) showed that known embedded O-stars (i.e., UCHII regions) occupy a tight region in IRAS color-color space, which is distinct from other sources that also possess rising spectral energy distributions (SEDs) in the far-infrared (FIR) and from the general population of PSC entries. This pioneering study has served as a starting point and guide for many subsequent studies of large numbers of HMSF regions. In particular, methanol maser and radio continuum surveys of sources selected using the WC89 criterion have identified numerous UCHII regions (Schutte et al. 1993; van der Walt, Gaylard & MacLeod 1995; Walsh et al. 1997). More recently the WC89 criterion together with IRAS flux criteria and an absence of significant radio continuum emission (i.e., no associated UCHII) has been used to identify and study the supposedly younger high mass protostellar objects (HMPOs; Palla et al. 1991; Molinari et al. 1996; Sridharan et al. 2002). Hundreds of HMSF regions have now been identified and detailed studies of subsamples (Walsh et al. 1998, 1999, 2001; Phillips et al. 1998, Beuther et al. 2002a,b,c) and selected objects (Hunter, Phillips & Menten 1997; Hunter et al. 1998, 1999; Molinari et al. 1998; Zhang et al. 1999, 2001, 2002) have been made in recent years.
| IRAS FLUXES (Jy) | DISTANCE | ||||||||||
|---|---|---|---|---|---|---|---|---|---|---|---|
| NAME | ASSOCIATION | 12m | 25m | 60m | 100m | (pc) | (L⊙) | WC89aaEntried in the WC89 column refer to whether the source satisfies the selection criterion of Wood & Churchwell (1989), i.e., if [25-12] 0.57 and [60-12] 1.3. A “y” in parentheses indicates a borderline case. | [25-12] | [60-12] | log() |
| IRAS 08076-3556 | CG 30 | 0.63 | 3.73 | 18.25 | 47.54 | 400bbVela cometary globules – Reipurth 1983; Zealey et al. 1983; Knude & Nielsen 2000; Woermann, Gaylard & Otrupcek 2001 | 9 | y | 0.77 | 1.46 | 13.8 |
| IRAS 08242-5050 | HH 46/47 | 0.82 | 6.31 | 26.31 | 58.27 | 400bbVela cometary globules – Reipurth 1983; Zealey et al. 1983; Knude & Nielsen 2000; Woermann, Gaylard & Otrupcek 2001 | 13 | y | 0.89 | 1.50 | 14.0 |
| IRAS 08261-5100 | BHR 41 | 0.91 | 2.50 | 4.29 | 10.91 | 400bbVela cometary globules – Reipurth 1983; Zealey et al. 1983; Knude & Nielsen 2000; Woermann, Gaylard & Otrupcek 2001 | 4 | n | 0.44 | 0.67 | 13.4 |
| IRAS 10501-5630 | 0.25L | 1.43 | 8.1 | 36.1 | 3100ccHenning & Launhardt 1998 | 305 | y | 0.76 | 1.51 | 13.4 | |
| IRAS 11278-5940 | 1.32 | 1.72 | 4.6 | 37.3 | 4400ddBourke et al. 1997 | 680 | n | 0.11 | 0.54 | 13.3 | |
| IRAS 11590-6452 | BHR 71 | 0.25L | 6.53 | 77.38 | 192.9 | 200ddBourke et al. 1997 | 8 | y | 1.42 | 2.49 | 14.3 |
| IRAS 13224-5928 | BHR 87 | 1.20 | 2.35 | 8.19 | 37.21 | 1000eeR. Sutherland et al. 1992, private communication | 40 | n | 0.29 | 0.83 | 13.5 |
| IRAS 16293-2422 | L1689 | 0.25L | 1.82 | 25.5 | 103.2 | 160ffOphiuchus molecular cloud (Wilking 1992) | 14 | y | 0.86 | 2.00 | 15.2 |
| IRAS 16295-4452 | Sa187 | 1.2 | 5.4 | 27.1 | 52.8 | 700ggReipurth et al. 1997 | 38 | y | 0.65 | 1.35 | 14.0 |
| IRAS 16289-4449 | HH 57 | 9.3 | 31.5 | 68.0 | 69.9 | 700ggReipurth et al. 1997 | 120 | n | 0.53 | 0.86 | 14.5 |
| IRAS 17193-4319 | BHR 140 | 0.25L | 0.68 | 4.74 | 22.98 | 700hhReddening (revised distance from Bourke et al. 1995b) | 10 | (y) | 0.43 | 1.28 | 13.2 |
| R CrA | 127.6 | 228.2 | 627.0 | 1231.4 | 130iiCrA molecular cloud (Graham 1992) | 45 | n | 0.25 | 0.69 | 15.4 | |
| VV CrA | 31.9 | 69.1 | 131.0 | 95.2 | 130iiCrA molecular cloud (Graham 1992) | 10 | n | 0.33 | 0.61 | 14.8 | |
| TY CrA | 31.0 | 57.0 | 496.7 | 719.1 | 130iiCrA molecular cloud (Graham 1992) | 21 | n | 0.25 | 1.20 | 15.2 | |
Note. — An “L” in the IRAS flux columns refers to an upper limit. Each value is the far infrared luminosity calculated as described in Casoli et al. 1986. Definitions for [25-12], [60-12] and Log() are in the text.
Maser transitions of methanol are now well established indicators of the early phases of HMSF (Ellingsen 2004). Favored pump mechanisms involve some degree of FIR radiative pumping, coupled with amplification of background HII region continuum radiation for the lower frequency transitions that exhibit high brightness temperatures (Sobolev, Cragg & Godfrey 1997; Cragg et al. 2001). The lower limit for the FIR luminosity for which the maser process can no longer occur is not well constrained observationally. This is partly due to the difficulty in measuring weak maser lines, and in establishing unbiased distances to masing sources. The establishment of the precise conditions under which maser processes occur, and when they are inactive, will assist in our understanding of the structure of star forming regions and the physical processes pertaining to them. In particular, the lower limit to the luminosity required to excite the most widely observed and strongest methanol maser transition at 6.7 GHz has not been established. Only one targeted survey toward known low and intermediate mass protostars has been reported by Minier et al. (2003). Minier et al. searched for 6.7 GHz methanol maser emission toward 57 southern protostars and 65 preprotostellar (i.e., starless) dense cores. They did not detect any maser emission toward bona fida low mass sources. The theory of Sobolev et al. (1997) requires gas kinetic temperatures of 30 K and dust temperatures 150 K with enhanced methanol abundances and moderate densities to excite these masers, conditions that might be found in some outflows from low mass protostars (e.g., BHR 71 [Bourke et al. 1997, Garay et al. 1998] and L1157 [Tafalla & Bachiller 1995; Bachiller et al. 1995; Benedettini et al. 2002]) or within low mass hot core regions (e.g., IRAS 16293-2422 - Kuan et al. 2004, Cazaux et al. 2003, Ceccarelli et al. 1999, 2000). Luminosities of sources selected using the WC89 criterion are often difficult to determine because of a lack of velocity information or to the difficulty in breaking the near/far distance ambiguity. Because it is now assumed a priori that methanol masers are only associated with HMSF regions, deciding on the near/far ambiguity is often achieved by assuming an ionising source.
In this paper we present the results of a search for 6.7 GHz methanol maser emission from a small sample of low mass protostars that predates Minier et al. 2003. No masers were found. The most luminous source in our sample with 680 L⊙ is almost as luminous as the least luminous sources showing methanol maser emission, 1000 L⊙. This leads us to examine the nature of WC89 sources with low fluxes, as some of our sample satisfy the WC89 criterion for candidate UCHII regions based solely on their IRAS colors. For the first time we are able to show that some low mass protostars contaminate the low flux end of the WC89 sample, a result that was suggested by van der Walt (1997) and Ramesh & Sridharan (1997) but that has not previously been confirmed observationally. We also estimate the contamination level of WC89 by low mass protostars.
2. Source list
As this was intended only as a pilot survey to examine whether any low luminosity young stellar objects exhibit 6.7 GHz methanol maser emission, the source list was not selected with rigor. However, we did aim to observe low-luminosity sources with a range of luminosities, from a few to a few hundred solar luminosities. Sources were selected from lists of IRAS sources associated with southern dark molecular clouds (Persson & Campbell 1987,1988; Persi et al. 1990; Bourke, Hyland & Robinson 1995a). Because of their association with dark clouds, it was assumed that these sources are relatively nearby (mostly 1kpc, and almost always 2kpc), and so are low- to intermediate-mass objects. The source list is given in Table 1. The distance to all sources in Table 1 was not well established at the time of the observations. For sources with unknown distances we selected those with low IRAS fluxes. Subsequent distance estimates (as indicated in Table 1) do indicate that the majority satisfy our luminosity requirement. We attempted to confirm the large distance estimates for IRAS 10501-5630 and IRAS 11278-5940 by using the Galactic rotation curve derived by Brand & Blitz (1993) and the values of determined by Bronfman, Nyman & May 1996 (13.4 km s-1 for IRAS 10501-5630) and Brand et al. 1987 (13.1 km s-1 for IRAS 10501-5630 and km s-1 for IRAS 11278-5940). However it was not possible to use this method to obtain sensible results. As noted in Table 1, approximately 7 out of 14 sources satisfy the WC89 UCHII criterion, a point we will revisit.
| FLUX (Jy) | ||
|---|---|---|
| Name | Caswell et al. (1995) | This Work |
| G323.74–0.26 | 2860 | 2728 |
| G344.42+0.05 (IRAS 16586-4442) | 15 | 10 |
| G351.42+0.64 (NGC 6334F) | 3300 | 3322 |
3. Observations
The observations were undertaken between 1992 December 15 and 17 using the dual–channel cooled HEMT 6.7/12.2 GHz receiver at the Parkes 64 m radio telescope. At the rest frequency of 6.668 GHz the half power beamwidth of the Parkes antenna is 33. For all observations the Parkes autocorrelator was split into two sections of 1024 channels, each covering 4 MHz and one of two orthogonal linear polarizations. The velocity range covered for each observation was 179 km s-1, with a spectral resolution of 0.35 km s-1 after Hanning smoothing of the data.
On source intergration times were 20 minutes. Reference spectra of 20 minutes taken at regular intervals throughout the observing period were used to form quotients with the on source observations. The resulting spectra for the two polarizations were then averaged, baselined and Hanning smoothed. Because of poor weather during the observing period, system temperatures were typically 80 – 90 K, and the resulting 3 sensitivity level of the observations were typically 0.2 Jy.
Since no maser emission or absorption was detected, no “true” flux calibrators were observed. However, three sources that have previous been reported (G323.74–0.26, G344.42+0.05, G351.42+0.64) were observed as test observations and thus provide sufficient flux calibration. Flux calibration of these sources was undertaken by Caswell et al. (1995) in the observing period immediately following ours, and the data presented here have been calibrated by comparison with the fluxes given in Caswell et al. (1995). Table 2 presents a comparison of the Caswell et al. (1995) fluxes with those obtained here.
4. Results and Discussion
As indicated in Table 3, no maser emission was detected. The sensitivity of our survey (0.2 Jy, 3) is comparable to or better than previous single-dish surveys of IRAS selected sources (e.g., Schutte et al. 1993 – 3 Jy; van der Walt et al. 1995 – 5 Jy; Walsh et al. 1997 – 0.3 Jy; MacLeod et al. 1998 – 0.3-0.6 Jy), which have detected a large number of methanol masers, so this is not an explanation for our zero-detection rate, unless methanol masers from low-mass protostars are intrinsically weaker and so below our detection threshold. However, subsequent studies of methanol maser emission show that this null result is not surprising for the sources we have observed (van der Walt et al. 1996; Minier et al. 2003). Most large surveys for 6.7 GHz methanol maser emission have concentrated on IRAS sources selected using the WC89 IRAS two-color criterion for UCHII regions, [25–12] 0.57 and [60–12] 1.3, where [] log(S/S) and Sλ is the IRAS flux in Jy at wavelength . Because of possible contamination from non-UCHII regions some of these surveys also impose flux limits on their samples (e.g., Schutte et al. 1993 – 150 Jy and 400 Jy; van der Walt et al. 1995 and MacLeod et al. 1998 – 100 Jy and 100 Jy), or impose other criteria such as association with radio continuum emission indicating the presence of an HII region (Walsh et al. 1997). Approximately half of the sources in our study satisfy the WC89 criterion (6, maybe 7, of 14, as the lower limits on the 12 m flux of IRAS 17193-4319 do not exclude it from the WC89 region), but none of these have 100 Jy as used in the major surveys listed above. The methanol maser survey by van der Walt et al. (1995) of sources selected using the WC89 criterion with 100 Jy had a much lower detection rate than a similar survey by Schutte et al. (1993), which used 150 Jy, suggesting that the brightest WC89 sources are more likely to be associated with methanol maser emission. The results presented here do not contradict this viewpoint.
| NAME | R.A. | Dec. | 1 rms |
|---|---|---|---|
| (J2000) | (J2000) | (Jy) | |
| IRAS 08076-3556 | 08 09 31.6 | –36 04 47 | 0.06 |
| IRAS 08242-5050 | 08 25 44.4 | –51 00 05 | 0.09 |
| IRAS 08261-5100 | 08 27 37.4 | –51 10 41 | 0.09 |
| IRAS 10501-5630 | 10 52 15.5 | –56 46 28 | 0.09 |
| IRAS 11278-5940 | 11 30 09.1 | –59 57 26 | 0.07 |
| IRAS 11590-6452 | 12 01 37.1 | –65 09 06 | 0.05 |
| IRAS 13224-5928 | 13 25 48.6 | –59 42 53 | 0.06 |
| IRAS 16289-4449 | 16 32 32.3 | –44 55 38 | 0.07 |
| IRAS 16293-2422 | 16 32 22.9 | –24 28 36 | 0.07 |
| IRAS 16295-4452 | 16 33 03.5 | –44 58 30 | 0.06 |
| IRAS 17193-4319 | 17 22 55.0 | –43 22 37 | 0.05 |
| R CrA | 19 01 51.4 | –36 56 52 | 0.05 |
| VV CrA | 19 03 05.8 | –37 12 50 | 0.06 |
| TY CrA | 19 01 38.9 | –36 54 00 | 0.05 |
Note. — No masers were detected and 1 rms values are listed. Velocity coverage was typically 90 km s-1 with a channel separation of 0.35 km s-1. Units of right ascension are hours, minutes, and seconds, and units of declination are degrees, arcminutes, and arcseconds.

4.1. Detection toward faint IRAS sources
The survey of van der Walt et al. (1996) of 241 IRAS sources satisfying WC89 with 100 Jy for methanol maser emission at 6.7 GHz detected only five new masers. Because of this low detection rate van der Walt et al. (1996) investigated the nature of the IRAS sources toward which methanol masers had previously been detected. An examination of the IRAS flux integrated between 25 and 60 m (van der Walt et al. 1996; Casoli et al. 1986),
| (1) | |||||
shows that almost all 6.7 GHz methanol masers are associated with sources with log Jy Hz, and that the detection rate of methanol masers decreases rapidly with decreasing values of . The survey of van der Walt et al. (1996) included 191 WC89 sources with 14 log 14.4 that had not previously been observed, detecting the five new masers mentioned above. This source list included one of the sources in our list, IRAS 11590-6452, which is clearly not an UCHII region, but a nearby low-mass protostar (Bourke et al. 1997; Garay et al. 1998; Bourke 2001). In our sample seven sources have log Jy Hz, and all have log Jy Hz, which is the lower limit for WC89 sources.
4.2. The nature of the WC89 sample
The probability of detecting methanol maser emission from the fainter sources with WC89 colors is apparently quite low. The question is why? Are these sources more distant HMSF regions, or perhaps nearby low-mass star forming regions that are not expected to show methanol maser emisson? The dispersion in scale height for the WC89 sources is greatest at low values of , being 4° for log , and remaining constant at 1° for log , where most of the 6.7 GHz masers are found (van der Walt 1997). The modeling of the distribution of embedded ionizing stars by van der Walt (1997) led to the conclusion that a significant fraction of the faint WC89 sources may be low and intermediate mass (i.e., non-ionizing) nearby young stars. This would neatly explain the lack of 6.7 GHz maser detections for these objects - not all WC89 objects are UCHII regions, and methanol maser emission is not expected from low- to intermediate-mass young stars (Sobolev et al. 1997). This is illustrated in Figure 1(a), which plots the [25–12] versus [60–12] colors for the sources surveyed in this work (open diamonds) and the IRAS sources associated with Bok globules from Bourke et al. (1995a) that are detected at 12, 25 and 60 m with , and so are most likely to be low-mass protostars. Also shown on this figure are the regions defined by WC89 for UCHII regions, and by Emerson (1987; see also Bourke et al. 1995a) for embedded, nearby low-mass protostellar “cores” (Beichman et al. 1986). As can be seen in the figure, a number of bona fida low luminosity sources are found within the WC89 region, and the region of low mass cores overlaps with the WC89 region in color-color space. This figure clearly shows that some low luminosity (non-ionizing) protostellar objects have IRAS colors similar to UCHII regions and must contaminate the WC89 sample. This point is supported by Ramesh & Sridharan (1997), who studied the reliability of the WC89 criterion in the selection of UCHII regions. Using a simple model they estimated that 10% of the WC89 sources have luminosities of 1000 L⊙.
Bronfman et al. (1996) surveyed 1427 sources selected using the WC89 criterion for CS emission with the Swedish-ESO Submillimetre Telescope (SEST). This survey was aimed at detecting dense gas (critical density cm-3) toward these regions as a further indicator of their protostellar nature. They detected 843 sources (59%) above their sensitivity threshold. They note that the undetected sources are either faint IRAS sources, or seem to belong to a different population with similar but distinct colors compared to the detected sources. Smaller samples of HMPO candidates selected with addition criteria (flux limits, radio continuum) to that of WC89 (e.g., Sridharan et al. 2002; Beuther et al. 2002a; Brand et al. 2001) detect all of their sources in CS and other molecular lines, regardless of distance. This suggests that the majority of sources not detected by Bronfman et al. cannot be UCHII regions, or even HMSF regions.
The spectral line data allows us to investigate the nature of the detected sources. In particular the CS linewidth, , can be used to determine whether a given source is a candidate high mass or low mass star forming region. HMSF regions (star cluster forming regions without strong ionizing sources) show larger line widths most likely because of a greater level of turbulence. However, there is no clear a priori separation in linewidth between the high mass and low mass star forming regions for any molecular tracer, and so we examined published surveys using similar sized telescopes to estimate the typical CS linewidth of low and high mass star forming regions.
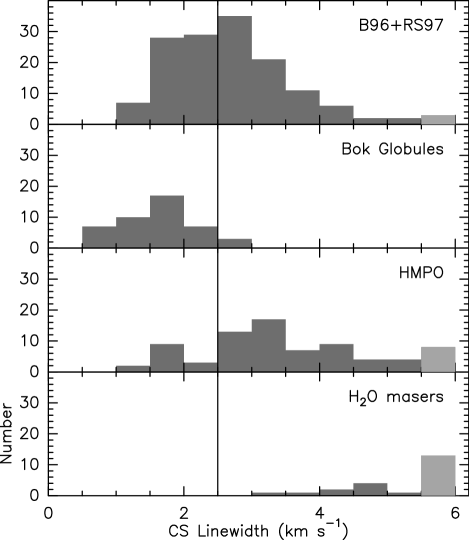
For low mass protostars we used the Bok globule survey of Launhardt et al. (1998) for northern sources, who observed 38 IRAS sources identified as low mass protostars, and the survey of Henning & Launhardt (1998) for southern sources, who observed 33 IRAS sources with . These surveys used the FCRAO 14 m telescope and the 15 m SEST. They find that the majority of the sources have km s-1, and essentially all have km s-1. For high mass protostars we have examined the CS surveys of Brand et al. (2001) and Beuther et al. (2002a) for the youngest high mass systems, and Juvela (1996) for more evolved regions (i.e., compact HII regions with associated water masers). The first two surveys generally have km s-1, while the Juvela sample all have km s-1 (Figure 2). We conclude that sources in the WC89 sample with CS line widths km s-1 are good candidates to be regions that are not forming high mass ionising stars, or clusters without ionizing sources.
Larionov et al. (1999) observed a mixture of high and low mass star forming regions in CS ; for sources associated with Class I methanol masers they find a mean CS linewidth = 6.2 km s-1, and = 4.8 km s-1 for Class II methanol masers. By inspection of their source list the methanol masers are associated with previously identified HMSF regions with radio continuum emission (ie HII regions), supporting the result of Juvela (1996).
| IRAS FLUXES (Jy) | DISTANCE | |||||||||
|---|---|---|---|---|---|---|---|---|---|---|
| NAME | ASSOCIATION | 12m | 25m | 60m | 100m | (pc) | (L⊙) | [25-12] | [60-12] | log() |
| 03225+3034 | L1448 IRS3 | 0.6 | 5.3 | 52.2 | 374.0 | 350aaPerseus (Herbig & Jones 1983) | 31 | 0.95 | 1.95 | 14.2 |
| 03245+3002 | L1455 RNO15 | 0.2L | 4.2 | 48.8 | 82.2 | 350aaPerseus (Herbig & Jones 1983) | 13 | 1.37 | 2.43 | 14.2 |
| 04287+1801 | L1551 IRS5 | 9.7 | 105.0 | 356.0 | 420.0 | 140bbTaurus (Elias 1978) | 18 | 1.03 | 1.56 | 15.2 |
| 04365+2535 | TMC 1A | 1.2 | 8.6 | 36.0 | 39.3 | 140bbTaurus (Elias 1978) | 2 | 0.86 | 1.48 | 14.1 |
| 08194-4925 | Re4 | 0.1L | 2.3 | 29.8 | 74.6L | 400ccVela cometary globules (see Table 1) | 12 | 1.36 | 2.47 | 13.9 |
| 08196-4931 | Re5 | 0.3 | 7.1 | 53.3 | 74.6L | 400ccVela cometary globules (see Table 1) | 19 | 1.37 | 2.25 | 14.2 |
| 11590-6452 | BHR 71 | 0.3L | 6.5 | 77.4 | 192.9 | 200ddBourke et al. 1997 | 8 | 1.42 | 2.49 | 14.3 |
| 14564-6254 | Circinus MM1 | 1.4 | 7.1 | 48.6 | 94.0 | 700eeBally et al. 1999 | 63 | 0.71 | 1.54 | 14.2 |
| 16293-2422 | L1689 | 0.25L | 1.82 | 25.5 | 103.2 | 160ffOphiuchus molecular cloud (Wilking 1992) | 14 | 0.86 | 2.00 | 15.2 |
| 18148-0440 | L483 | 0.3L | 6.9 | 89.1 | 165.5 | 200ggTafalla et al. 2000 | 8 | 1.44 | 2.55 | 14.4 |
| Serpens FIRS1 | 0.6L | 5.6 | 170.0 | 435.0 | 310hhSerpens (De Lara, Chavarria & Lopez-Molina 1991) | 41 | 0.97 | 2.45 | 14.7 | |
| 21388+5622 | SFO 37 | 2.4 | 17.4 | 52.7 | 74.8 | 750iiMatthews 1979 | 69 | 0.85 | 1.33 | 14.4 |
| 21391+5802 | IC 1396 | 0.6 | 8.9 | 144.6 | 425.5 | 750iiMatthews 1979 | 226 | 1.20 | 2.40 | 14.6 |
| 22051+5848 | L1165 | 0.25L | 5.22 | 51.6 | 94 | 300jjDobashi et al. 1994 | 11 | 1.32 | 2.31 | 14.2 |
| 23011+6126 | Cepheus | 0.43 | 5.77 | 61.0 | 112.0 | 730kkHarju et al. 1993 | 76 | 1.13 | 2.15 | 14.3 |
| 22376+7455 | L1251B | 0.8 | 5.6 | 32.3 | 66.8 | 300llKun & Prusti 1993 | 8 | 0.84 | 1.61 | 14.0 |
Note. — Last four columns are as defined in Table 1 and the text. The IRAS name is given in the first column except for Serpens FIRS1 which is confused within the IRAS beam (1′). An “L” in the IRAS flux columns refers to an upper limit.
Plume et al. (1997) observed CS and higher transitions toward 150 water masers assumed to be associated with HMSF regions (most certainly true). They do not list mean linewidths, but inspection of their results indicate that 41 sources have 3.0 km s-1, and 15 (10%) have 2.0 km s-1. Many of the sources with narrower linewidths are only listed by their IRAS name, and so may be HMPOs similar to that of Beuther et al. (2002a). Again the basic premise holds true; regions with 2 km s-1are good candidates to be low mass star forming regions.
In the Bronfman et al. (1996) sample we find that 66 of 843 sources detected in CS have km s-1. These numbers suggest that of the sources in WC89 that are clearly associated with molecular gas (and are therefore likely to be star forming regions), % are forming only low mass non-ionising stars. This suggestion is supported by the recent survey of HMSF regions by Faúndez et al. (2004), who surveyed 146 of the CS detected Bronfman et al. sources for 1.2 mm continuum emission. Of their sample have luminosities L⊙, i.e., later than B0.5, and at least two are truly low mass, IRAS 08076-3556 and IRAS 11590-6452, which are included in our list. Ramesh & Sridharan (1997) divided up the WC89 sample into four classes, based on a combination of whether they were FIR bright or faint ( 90 Jy), and radio-loud or radio-quiet (based on their 5 GHz emission). For 1522 sources within , they find % are both FIR faint and radio quiet, which are the properties expected of nearby low mass star forming regions. In Figure 2 we plot the distribution of CS linewidths for those sources detected by Bronfman et al. (1996) that are also FIR faint and radio quiet according to Ramesh & Sridharan (1997). This figure shows that the majority of sources have 1.5 2.9 km s-1. Of the 144 sources in common, 35 (24%) have km s-1, and 64 (44%) have km s-1, indicating that a large fraction of faint, quiet sources associated with dense molecular gas (confirming their star-forming nature) have linewidths typical of low mass protostars or clusters without ionizing sources. If we include all sources with km s-1 then we find 99 sources (69%). From these numbers we conclude that about 50% of the FIR faint and radio quiet WC89 sources are actually low to intermediate mass star forming regions (including non-ionizing clusters). About one quarter of the WC89 sample are FIR faint and radio quiet according to Ramesh & Sridharan (1997), so we conclude for the sample as a whole that the contamination level is .
4.3. Low mass, low luminosity protostars in the WB89 sample
We have seen that attempting to select UCHII regions based solely on their IRAS colors is insufficient to produce a clean sample. Further criteria are needed. Ramesh & Sridharan (1997) have suggested the addition of centimeter radio continuum information, a technique used successfully and independently by Walsh et al. (1997). Surveys for methanol masers toward UCHII candidates selected using WC89 have shown that for sources with log 14.0 the detection rate is essentially zero, and so this might be a useful cut-off for selecting between UCHII regions and non-ionising sources. Though earlier studies (van der Walt 1997; Ramesh & Sridharan 1997) did not actually examine the true nature of the individual faint WC89 sources, they concluded that they are probably young embedded non-ionizing stars. A sample of low luminosity (, i.e., non-ionizing) protostellar sources that satisfy WC89 and also have log 14.0 are plotted in Figure 1(b), and are listed in Table 4. This list is not meant to be complete, but lists a number of well known low-mass protostellar objects, including the well studied regions in our survey associated with IRAS 08242-5050 (HH 46/47 – Olberg et al. 1992; Eislöffel et al. 1994; Heathcote et al. 1996; Noriega-Crespo et al. 2004) and IRAS 11590-6452 (BHR 71 – Bourke et al. 1997; Garay et al. 1998; Bourke 2001). However, it should be noted that almost all of the sources listed in Table 4 have 100 Jy. Thus, a requirement that sources satisfying WC89 also satisfy log 14.0 and 100 Jy may select a sample with a high percentage of UCHII regions, though it would not be a complete Galactic census.
Two recent comprehensive studies of HMPOs have been undertaken, by Palla and Molinari and their collaborators (Palla et al. 1991; Molinari et al. 1996, 1998, 2000; hereafter the PM sample), and by Sridharan and Beuther and their collaborators (Sridharan et al. 2002; Beuther et al. 2002a,b,c; hereafter the SB sample). We now briefly examine the possible contamination level in both samples.
In the PM sample of 260 sources, 125 satisfy WC89, which PM call “high”, while the rest have colors of compact molecular clouds (Richards et al. 1987), and are call “low”. In SB all 69 of their sources satisfy WC89. Both groups attempted to discriminate against HII regions by selecting sources without significant 5 GHz continuum emission, and against low luminosity sources by selecting sources with 100 Jy (PM) or 90 Jy and 500 Jy (SB). As we have seen in this paper, these criteria should eliminate low luminosity sources. In particular we have seen that the SB sample has CS linewidths significantly larger than that of Bok globules, which only form low mass stars. No equivalent survey is available for PM. They did observe a large percentage of their list in NH3 (1,1) and (2,2) (163 sources), finding mean linewidths of 1.73 km s-1 for their high sample and 1.47 km s-1 for the low sample. In comparison, Benson & Myers (1989) detected NH3 (1,1) from 78 low mass dense cores, finding a mean linewidth of 0.43 km s-1 for those associated with IRAS sources (%), while Bourke et al. (1995b) detected 84 Bok globules in NH3 (1,1), with typical line widths 1 km s-1. These numbers suggest the PM sample is not likely to be contaminated by low luminosity sources at any significant level, if at all, although individual objects with NH3 linewidths 1 km s-1 should be examined in detail.
4.4. The lower luminosity limit for methanol maser emission
It is difficult to determine the luminosity and hence spectral type of protostellar sources, so it is presently unclear whether non-ionizing sources are able to produce methanol masers. It would be interesting to carefully determine for all the known methanol masers to approximate the lower luminosity for maser emission (although IR counterparts for a number of methanol masers are unknown), as well as the luminosity of all those sources that been searched for methanol maser emission with null results. This large task is beyond the scope of this paper. A preliminary examination of published values of of methanol maser sources shows that almost all sources have L⊙ (i.e., earlier than B3), with IRAS 17463–3128 (van der Walt et al. 1995) at 880 L⊙ the lowest we could find (cf. IRAS 11278–5940 with L⊙is a null detection in the current work). If we assume that at least 20% of the total luminosity is not accounted for by , then the lower luminosity limit for methanol maser emission is L⊙.
Minier et al. (2003) discuss their non-detection of 6.7 GHz methanol masers from low-mass protostars in terms of the mass limit for maser emission. However, protostellar masses are almost impossible to determine except approximately, as they are not directly measurable. It would be interesting to determine the luminosity of protostars in the Minier sample (as opposed to the starless cores), and to compare these to the values quoted here and for faint IRAS sources showing maser emission (a task once again beyond the scope of this paper). Minier et al. claim to have observed all southern low mass protostars known at the time of their observations (2000), although they did not observe well studied sources such as IRAS 08242-5050 and IRAS 11590-6452 (included in this work) which were identified many years earlier. This omission does not change their conclusions; low mass protostars do not show 6.7 GHz methanol maser emission.
5. Summary and Conclusions
We have undertaken a survey of a small sample of low-mass protostars for methanol maser emission at 6.7 GHz. No masers were detected. This is not surprising, as methanol maser emission is not expected to be present in the environment of low luminosity sources (Sobolev et al. 1997). The maximum luminosity of the sources in our sample is 680 L⊙, compared to the lowest luminosity of a source showing methanol maser emission of 880 L⊙. These results suggest that the lower luminosity limit for methanol maser emission is L⊙.
Previous studies of the IRAS properties of sources selected using the WC89 criterion and searched for 6.7 GHz methanol maser emission find that the number of sources showing maser emission drops with decreasing IRAS flux, and is essentially zero for sources with log 14.0. Approximately half of our sample have log 14.0. Most of these also satisfy the WC89 IRAS two-color criterion for selecting candidate UCHII regions. These results suggest that a number of the fainter sources satisfying WC89 with IRAS fluxes similar to known methanol maser sources might in fact be non-ionizing lower mass protostars, as predicted by van der Walt (1997) and Ramesh & Sridharan (1997).
To show this conclusively for the first time, we identified a number of low-mass protostars in this work and from the literature that satisfy the WC89 IRAS two-color criterion for candidate UCHII regions, and have log 14.0, which is the observation cut off limit for 6.7 GHz methanol maser emission. This result clearly shows that the lower flux end of sources satisfying this criterion is contaminated by low-mass protstars. We estimate that the WC89 sample as a whole is contaminated by low mass (i.e., nonionizing) protostars at least at the 10% level, or greater.
References
- (1) Bachiller, R., Liechti, S., Walmsley, C. M., Colomer, F., 1995, A&A, 295, L51
- (2) Bally, J., Reipurth, B., Lada, C. J., Billawala, Y., 1999, AJ, 117, 410
- (3) Beichman, C.A., Neugebauer, G., Habing, H.J., Clegg, P.E., & Chester, T.J., eds. 1985, IRAS Catalogs and Atlases, Explanatory Supplement (Washington DC: GPO)
- (4) Beichman, C. A., Myers, P. C., Emerson, J. P., Harris, S., Mathieu, R., Benson, P. J., Jennings, R. E., 1986, ApJ, 307, 337
- (5) Benedettini, M., Viti, S., Giannini, T., Nisini, B., Goldsmith, P. F., & Saraceno, P. 2002, A&A, 395, 657
- (6) Benson, P. J., & Myers, P. C. 1989, ApJS, 71, 89
- (7) Beuther, H., Schilke, P., Menten, K. M., Motte, F., Sridharan, T. K., & Wyrowski, F. 2002a, ApJ, 566, 945
- (8) Beuther, H., Schilke, P., Sridharan, T. K., Menten, K. M., Walmsley, C. M., & Wyrowski, F. 2002b, A&A, 383, 892
- (9) Beuther, H., Walsh, A., Schilke, P., Sridharan, T. K., Menten, K. M., & Wyrowski, F. 2002c, A&A, 390, 289
- (10) Bourke, T. L., 2001, ApJ, 554, L91
- (11) Bourke, T. L., Hyland, A. R., Robinson, G., 1995a, MNRAS, 276, 1052
- (12) Bourke, T. L., Hyland, A. R., Robinson, G., James, S. D., Wright, C. M., 1995b, MNRAS, 276, 1067
- (13) Bourke, T. L., Garay, G., Lehtinen, K. K., Köhnenkamp, I., Launhardt, R., Nyman, L.-Å., May, J., Robinson, G., Hyland, A. R., 1997, ApJ, 476, 781
- (14) Brand, J., Blitz, L., Wouterloot, J. G. A., Kerr, F. J., 1987, A&AS, 68, 1
- (15) Brand, J., Cesaroni, R., Palla, F., & Molinari, S., 2001, A&A, 370, 230
- (16) Brand, J., Blitz, L., 1993, A&A, 275, 67
- (17) Bronfman, L., Nyman, L.-Å., May, J., 1996 A&AS, 115, 81
- (18) Casoli, F., Combes, F., Dupraz, C., Gerin, M., Boulanger, F., 1986, A&A, 169, 281
- (19) Caswell J. L., Vaile R. A., Ellingsen S. P., Whiteoak J. B., Norris R. P., 1995, MNRAS, 272, 96
- (20) Cazaux, S., Tielens, A. G. G. M., Ceccarelli, C., Castets, A., Wakelam, V., Caux, E., Parise, B., & Teyssier, D. 2003, ApJ, 593, L51
- (21) Ceccarelli, C., et al. 1999, A&A, 342, L21
- (22) Ceccarelli, C., Loinard, L., Castets, A., Tielens, A. G. G. M., & Caux, E. 2000, A&A, 357, L9
- (23) Cragg, D. M., Sobolev, A. M., Ellingsen, S. P., Caswell, J. L., Godfrey, P. D., Salii, S. V., Dodson, R. G., 2001, MNRAS, 323, 939
- (24) De Lara E., Chavarria K. C., Lopez-Molina G., 1991, A&A, 243, 139
- (25) Dobashi, K., Bernard, J., Yonekura, Y., & Fukui, Y. 1994, ApJS, 95, 419
- (26) Eislöffel, J., Davis, C. J., Ray, T. P., Mundt, R., 1994, ApJ, 422, L91
- (27) Elias, J. H., 1978, ApJ, 224, 857
- (28) Ellingsen, S., 2004, in Burton, M., Jayawardhana, R., Bourke, T., eds, Proc. IAU Symp. 221, Star Formation at High Angular Resolution, ASP, San Francisco, p. 133
- (29) Emerson, J. P., 1987, in Peimbert M., Jugaku J., eds, Proc. IAU Symp. 115, Star Forming Regions. Reidel, Dordrecht, p. 19
- (30) Faúndez, S., Bronfman, L., Garay, G., Chini, R., Nyman, L.-Å., & May, J. 2004, A&A, 426, 97
- (31) Garay, G., Köhnenkamp, I., Bourke, T. L., Rodríguez, L. F., Lehtinen, K. K., 1998, ApJ, 509, 768
- (32) Graham, J. A., 1991, in Reipurth B., ed., ESO Scientific Report 11, Low Mass Star Formation in Southern Molecular Clouds. ESO, Munich, p. 185
- (33) Harju, J., Walmsley, C. M., & Wouterloot, J. G. A. 1993, A&AS, 98, 51
- (34) Heathcote, S., Morse, J. A., Hartigan, P., Reipurth, B., Schwartz, R. D., Bally, J., Stone, J. M., 1996, AJ, 112, 1141
- (35) Henning, Th., Launhardt, R., 1998, A&A, 338, 223
- (36) Herbig, G. H., Jones, B. F., 1983, AJ, 88, 1040
- (37) Hunter, T. R., Phillips, T. G., Menten, K. M., 1997, ApJ, 478, 283
- (38) Hunter, T. R., Neugebauer, G., Benford, D. J., Matthews, K., Lis, D. C., Serabyn, E., Phillips, T. G., 1998, ApJ, 493, L97
- (39) Hunter, T. R., Testi, L., Zhang, Q., Sridharan, T. K., 1999, AJ, 118, 477
- (40) Juvela, M. 1996, A&AS, 118, 191
- (41) Knude, J., Nielsen, A. S., 2000, A&A, 362, 1138
- (42) Kuan, Y., et al. 2004, ApJ, 616, L27
- (43) Kun, M., Prusti, T., 1993, A&A, 272, 235
- (44) Lada, C. J., Lada, E. A., 2003, ARA&A, 41, 57
- (45) Larionov, G. M., Val’tts, I. E., Winnberg, A., Johansson, L. E. B., Booth, R. S., & Golubev, V. V. 1999, A&AS, 139, 257
- (46) Launhardt, R., Evans, N. J., Wang, Y., Clemens, D. P., Henning, T., & Yun, J. L. 1998, ApJS, 119, 59
- (47) MacLeod, G. C., van der Walt, D. J., North, A., Gaylard, M. J., Galt, J. A., Moriarty-Schieven, G. H., 1998, AJ, 116, 2936
- (48) Matthews, H. I., 1979, A&A, 75, 345
- (49) Minier, V., Ellingsen, S. P., Norris, R. P., & Booth, R. S., 2003, A&A, 403, 1095
- (50) Molinari, S., Brand, J., Cesaroni, R., Palla, F., 1996, A&A, 308, 573
- (51) Molinari, S., Testi, L., Brand, J., Cesaroni, R., Palla, F., 1998, ApJ, 505, L39
- (52) Molinari, S., Brand, J., Cesaroni, R., & Palla, F., 2000, A&A, 355, 617
- (53) Noriega-Crespo, A., et al. 2004, ApJS, 154, 352
- (54) Olberg, M., Reipurth, B., Booth, R. S., 1992, A&A, 259, 252
- (55) Palla, F., Brand, J., Comoretto, G., Felli, M., & Cesaroni, R. 1991, A&A, 246, 249
- (56) Persi, P., Ferrari-Toniolo, M., Busso, M., Origlia, L., Robberto, M., Scaltriti, F., Silvestro, G., 1990, AJ, 99, 303
- (57) Persson, S. E., Campbell, B., 1987, AJ, 94, 416
- (58) Persson, S. E., Campbell, B., 1988, AJ, 96, 1019
- (59) Phillips, C. J., Norris, R. P., Ellingsen, S. P., McCulloch, P. M., 1998, MNRAS, 300, 1131
- (60) Plume, R., Jaffe, D. T., Evans, N. J., Martin-Pintado, J., & Gomez-Gonzalez, J. 1997, ApJ, 476, 730
- (61) Ramesh, B., Sridharan, T. K., 1997, MNRAS, 284, 1001
- (62) Reipurth, B., 1983, A&A, 117, 183
- (63) Reipurth, B., Olberg, M., Gredel, R., Booth, R. S., 1997, A&A, 327, 1164
- (64) Richards, P. J., Little, L. T., Heaton, B. D., & Toriseva, M. 1987, MNRAS, 228, 43
- (65) Schutte, A. J., van der Walt, D. J., Gaylard, M. J., MacLeod, G. C., 1993 MNRAS, 261, 783
- (66) Sobolev, A. M., Cragg, D. M., Godfrey, P. D., 1997, A&A, 324, 211
- (67) Sridharan, T. K., Beuther, H., Schilke, P., Menten, K. M., Wyrowski, F., 2002, ApJ, 566, 931
- (68) Tafalla, M., Bachiller, R., 1995, ApJ, 443, L37
- (69) Tafalla, M., Myers, P. C., Mardones, D., Bachiller, R., 2000, A&A, 359, 967
- (70) van der Walt, D. J., Gaylard, M. J., MacLeod, G. C., 1995, A&AS, 110, 81
- (71) van der Walt, D. J., Retief, S. J. P., Gaylard, M. J., MacLeod, G. C., 1996 MNRAS, 282, 1085
- (72) van der Walt, D. J., 1997, A&A, 322, 307
- (73) Walsh, A. J., Hyland, A. R., Robinson, G., Burton, M. G., 1997, MNRAS, 291, 261
- (74) Walsh, A. J., Burton, M. G., Hyland, A. R., Robinson, G., 1998, MNRAS, 301, 640
- (75) Walsh, A. J., Burton, M. G., Hyland, A. R., Robinson, G., 1999, MNRAS, 309, 905
- (76) Walsh, A. J., Bertoldi, F., Burton, M. G., Nikola, T, 2001, MNRAS, 326, 36
- (77) Wilking, B. A., 1991, in Reipurth B., ed., ESO Scientific Report 11, Low Mass Star Formation in Southern Molecular Clouds. ESO, Munich, p. 159
- (78) Wood, D. O. S., Churchwell, E., 1989, ApJ, 340, 265 (WC89)
- (79) Woermann, B., Gaylard, M. J., Otrupcek, R., 2001, MNRAS, 325, 1213
- (80) Zealey, W. J., Ninkov, Z., Rice, E., Hartley, M., Tritton, S. B., 1983, Astrophys. Lett., 23, 119
- (81) Zhang, Q., Hunter, T. R., Sridharan, T. K., Cesaroni, R., 1999, ApJ, 527, L117
- (82) Zhang, Q., Hunter, T. R., Brand, J., Sridharan, T. K., Molinari, S., Kramer, M. A., Cesaroni, R., 2001, ApJ, 552, L167
- (83) Zhang, Q., Hunter, T. R., Sridharan, T. K., Ho, P. T. P., 2002, ApJ, 566, 982