1–
Correlation of Low z Lyman- Absorbers with HI-selected Galaxies
Abstract
In this work, observational evidence for the connection between low column density Lyman- absorbers and large-scale structure traced by gas-rich galaxies is investigated. The H i Parkes All Sky Survey (HIPASS) galaxy catalogue is cross-correlated with known low redshift, low column density ( cm-2) Lyman- absorbers from the literature. The absorber-galaxy cross-correlation function shows that on scales from 110 h-1 Mpc, absorbers are imbedded in halos with masses similar to that of galaxy groups.
keywords:
(galaxies:) intergalactic medium, (galaxies:) quasars: absorption lines, galaxies: statistics, (cosmology:) large-scale structure of universe1 Introduction
Hydrodynamic simulations of galaxies and the Intergalactic Medium (IGM) predict a filamentary structure of the Universe where H i in the IGM clusters around galaxies (e.g. Davé et al. 1999). Observations of H i in the IGM via low column density Ly absorption find absorbers in a variety of environments including large-scale filaments (e.g. Penton et al. 2002, Rosenberg et al. 2003), galaxy groups (e.g. Bowen et al. 2002), and even voids (e.g. Stocke et al. 1995). The cross-correction function of Ly absorbers and galaxies can be used to measure the extent to which the two populations of objects, absorbers and galaxies, are associated. In the Press–Schechter (PS, Press & Schechter 1974) formalism, the ratio of the bias of the two populations of objects is equal to the amplitude ratio of the cross-correlation to the auto-correlation function (e.g. Mo & White 2002). Therefore, by (i) knowing the characteristic total (dark plus baryonic) halo mass (and its relative bias) of a galaxy population, (ii) measuring the galaxy auto correlation function, and (iii) measuring the absorber-galaxy cross-correlation function, the mass of the halos in which the absorbers are imbedded can be inferred. This method has been successfully used by [Bouché et al. (2004)]. They cross-correlated MgII absorbers with Luminous Red Galaxies (LRGs) to show that the MgII absorbers are imbedded in halos with masses , consistent with the fact that MgII absorbers arise in Damped Ly (DLA) systems, which are expected to have total halo masses of that order.
Moving from DLAs to lower column density systems, the minihalo model (e.g. Mo & Morris 1994) predicts a weaker absorber-galaxy cross-correlation function for absorbers associated with the lower-mass minihalos. The minihalo model has been criticised because too many halos per unit redshift would be required to account for the observed density of absorption lines, since the minihalos have small spatial cross sections. Observational evidence lends more support to scenarios where absorbers are imbedded in large-scale filaments and galaxy groups. Furthermore, the PS formalism does not count objects that have merged into larger collapsed objects (Mo & Morris 1994).
Perhaps the PS formalism can still work for low column density absorbers, if instead they are correlated with very large structures. Here an alternative suggestion is made that if Ly absorbers are imbedded in large scale structure, then their expected clustering properties should be consistent with large-scale filaments and galaxy groups. That is, within the PS formalism, a stronger cross-correlation function amplitude is expected for Ly absorbers on large spatial scales.
Many studies have established a positive association between absorbers and galaxies (Morris et al. 1993, Stocke et al. 1995, Tripp et al. 1998, Impey et al. 1999, Penton et al. 2002 & 2004, Bowen et al. 2002), but maintain that a one-to-one correspondence between absorbers and individual galaxies does not exist in many cases (e.g. Coté et al. 2005). To calculate a cross-correlation function, a reasonable number of absorbers overlapping with a galaxy survey sufficient in projected distance is needed.
[Morris et al. (1993)] is the only published 0 absorber-galaxy cross-correlation function to-date, which used 17 absorbers along the 3C 273 line-of-sight. They found that absorbers are not distributed at random with respect to galaxies, but the absorber-galaxy correlation is weaker than the galaxy auto correlation on scales from 1 10 h Mpc. The absorber-galaxy cross-correlation function is instrumental in establishing whether absorbers are associated with individual mini-halos or large scale structure. Here, we calculate the cross-correlation function with many more absorbers.
2 Cross Correlation Method and Results
The HI Parkes All Sky Survey (HIPASS) galaxy catalogue (Meyer et al. 2004, Wong et al. 2005) is cross-correlated with known low redshift, low column density (mostly cm-2) Ly absorbers from the literature (Impey et al. 1999, Bowen et al. 2002, Penton et al. 2002 & 2004, Tripp et al. 2002, Rosenberg et al. 2003). HIPASS was used as its all sky coverage enables a uniform statistical comparison with the absorbers, and it identifies gas-rich dwarf and low surface brightness galaxies, often missed by magnitude-limited optical surveys. Low redshift Ly absorption systems were chosen from the literature to overlap with HICAT, i.e. +25∘ and heliocentric velocity less than 12 700 km s-1, resulting in 141 absorbers from 36 sight-lines. There are 5 340 galaxies in the combined HIPASS catalogues.
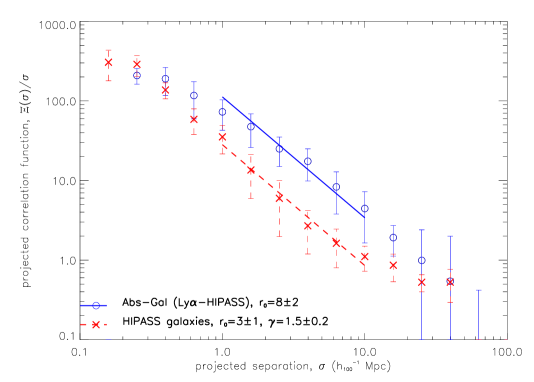
The cross-correlation function, is calculated from the Davis & Peebles (1983) estimator, , where is the number of data galaxydata absorber pairs with projected separation, , and radial separation, , and is the number of data galaxyrandom absorber pairs. The function is normalised by the number of random absorbers, , and data absorbers, . The projected correlation function, , is then calculated by integrating in the direction, a power-law is then fit to give the real-space correlation function co-efficients, and . To statisfy the PS formalism condition that the slopes of the cross- and auto-correlation function, and , be equal, the co-efficients, and , are calculated first, then is determined by fixing = and using a Levenberg-Marquardt non-linear least squares fit. The errors are calculated using jackknife resampling.
The auto- and cross-correlation functions are given in Figure 1. Southern HIPASS has already been used to show that H i selected galaxies are more weakly clustered than optically selected galaxies (Meyer, 2003). The results here show that the absorber-galaxy cross-correlation is stronger than the HIPASS galaxy auto-correlation for the spatial range 110 h-1 Mpc. The median H i mass of galaxies contributing to pairs in the range 110 h-1 Mpc is log(/)=8.1 h-2, which corresponds to a halo mass of log(M/)=10.7 h-1 (Mo et al., this volume). The ratio of the cross- to auto-correlation function, , together with known halo biases at 0 (Mo & White 2002, Bouché, priv. comm.) indicates a value of log(M/)14 h-1 for the mass of halos in which Ly absorbers are imbedded. This value agrees well with the median dynamical mass of galaxy groups in HIPASS, log(M/)13.8 h-1 (Stevens, 2005).
3 Summary
The results show that the absorber-galaxy cross-correlation is
stronger than the galaxy auto-correlation, this is opposite to what is
seen by Morris et al. (1993, based on 17 absorbers). In the context of
the PS formalism, the results suggests that, on scales from 110
h-1 Mpc, Ly absorbers are associated with dark matter halos
with masses of log(M/)14 – similar to that of galaxy
groups. The flattening of at low
suggests that absorbers tend to avoid the densest regions of the local
Universe. Although observing individual systems may reveal an
association of a Ly absorber with a particular structure, be it a
galaxy group, filament, void or galaxy halo, the statistical evidence
presented here suggests that galaxy groups could be the dominant
environment of low column density Ly absorbers at 0.
I wish to acknowledge Lister Staveley-Smith & Rachel Wesbter who encouraged an early version of this work, and to Nicolas Bouché for providing 0 bias values.
References
- [Bouché et al. (2004)] Bouché, N. et al. 2004, MNRAS, 354, L25
- [] Bowen, D.V. et al. 2002, ApJ, 580, 169
- [] Coté, S. et al. 2005, ApJ, 618, 178
- [Davé et al. (1999)] Davé, R. et al. 1999, ApJ, 511, 521
- [] Davis, M. & Peebles, P.J.E. 1983, ApJ, 267, 465
- [Impey et al. (1999)] Impey, C. D. et al. 1999, ApJ, 524, 536
- [Meyer (2003)] Meyer, M.J. 2003, PhD Thesis, U. Melbourne
- [Meyer et al. (2004)] Meyer, M.J. et al. 2004, MNRAS, 350 1195
- [Mo & Morris (1994)] Mo, H.J, Morris, S.L. 1994, MNRAS, 269, 52
- [Mo & White (2002)] Mo, H.J, White, S.D.M. 2002, MNRAS, 336, 112
- [Morris et al. (1993)] Morris, S. L. et al. 1993, ApJ, 419, 524
- [Penton et al. (2002)] Penton, S. V. et al. 2002, ApJ, 565, 720
- [Penton et al. (2004)] Penton, S. V. et al. 2004, ApJ, 152, 29
- [] Press, W.H. & Schechter, P. 1974 ApJ, 187, 425
- [] Rosenberg, J.L. et al. 2003, ApJ, 591, 677
- [] Stevens, J.B. 2005, PhD Thesis, U. Melbourne
- [Stocke et al. (1995)] Stocke, J. T. et al. 1995, ApJ, 451, 24
- [Tripp et al. (1998)] Tripp, T. M. et al. 1998, ApJ, 508, 200
- [] Tripp, T. M. et al. 2002, ApJ, 575 697
- [] Wong, O.I. et al. 2005, in preparation.