From young massive star cluster to old globular: the relationship as a diagnostic tool
Abstract
We present a new analysis of the properties of the young massive star
clusters forming profusely in intense starburst environments, which
demonstrates that these objects are plausible progenitors of the old
globular clusters (GCs) seen abundantly in the Local Group. The method
is based on the tight relationship for old GCs between their -band
luminosities, , and (central) velocity dispersions, .
We improve the significance of the relationship by increasing the GC
sample size and find that its functional form, (km s-1), is fully consistent with
previous determinations for smaller Galactic and M31 GC samples. The
tightness of the relationship for a GC sample drawn from environments
as diverse as those found in the Local Group implies that its origin
must be sought in intrinsic properties of the GC formation process
itself.
We evolve the luminosities of those young massive star
clusters (YMCs) in the local Universe which have velocity dispersion
measurements to an age of 12 Gyr, adopting a variety of IMF
descriptions, and find that most YMCs will evolve to loci close to, or
to slightly fainter luminosities than the improved GC relationship. In
the absence of significant external disturbances, this implies that
these objects may potentially survive to become old GC-type objects
over a Hubble time. The main advantage of our new method is its
simplicity. Where alternative methods, based on dynamical mass
estimates, require one to obtain accurate size estimates and to make
further assumptions, the only observables required here are the
system’s velocity dispersion and luminosity. The most important factor
affecting the robustness of our conclusions is the adopted form of the
initial mass function. We use the results of -body simulations to
confirm that dynamical evolution of the clusters does not
significantly alter our conclusions about the likelihood of individual
clusters surviving to late times. Finally, we find that our youngest
observed clusters are consistent with having evolved from a relation
of the form (km
s-1). This relation may actually correspond to the origin of the
GC fundamental plane.
keywords:
stellar dynamics – methods: miscellaneous – galaxies: nuclei – galaxies: starburst – galaxies: star clusters1 Introduction
Young, massive star clusters (YMCs) are the most notable and significant end products of violent star-forming episodes triggered by galaxy collisions, mergers, and close encounters. Their contribution to the total luminosity induced by such extreme conditions dominates, by far, the overall energy output due to gravitationally-induced star formation (e.g., Holtzman et al. 1992, Whitmore et al. 1993, O’Connell et al. 1994, Conti et al. 1996, Watson et al. 1996, Carlson et al. 1998, de Grijs et al. 2001, 2003a,b,c,d,e).
The question remains, however, whether or not at least a fraction of the compact YMCs seen in abundance in extragalactic starbursts, are potentially the progenitors of globular cluster (GC)-type objects. If we could settle this issue convincingly, one way or the other, the implications of such a result would have profound and far-reaching implications for a wide range of astrophysical questions, including (but not limited to) our understanding of the process of galaxy formation and assembly, and the process and conditions required for star (cluster) formation. Because of the lack of a statistically significant sample of similar nearby objects, however, we need to resort to either statistical arguments or to the painstaking approach of case by case studies of individual objects in more distant galaxies.
The present state-of-the-art teaches us that the sizes, luminosities, and – in several cases – spectroscopic mass estimates of most (young, massive) extragalactic star cluster systems are fully consistent with the expected properties of young Milky Way-type GC progenitors (e.g., Meurer 1995, van den Bergh 1995, Ho & Filippenko 1996a,b, Schweizer & Seitzer 1998, de Grijs et al. 2001, 2003d).
However, the postulated evolutionary connection between the recently formed YMCs in regions of violent star formation and starburst galaxies, and old GCs similar to those in the Galaxy, M31, M87, and other old elliptical galaxies is still a contentious issue. The evolution and survivability of YMCs depend crucially on the stellar initial mass function (IMF) of their constituent stars (cf. Smith & Gallagher 2001): if the IMF is too shallow, i.e., if the clusters are significantly depleted in low-mass stars compared to (for instance) the solar neighbourhood, they will disperse within a few orbital periods around their host galaxy’s centre, and most likely within about a billion years of their formation (e.g., Gnedin & Ostriker 1997, Goodwin 1997a, Smith & Gallagher 2001, Mengel et al. 2002).
Ideally, one would need to obtain (i) high-resolution spectroscopy of all clusters in a given cluster sample in order to obtain dynamical mass estimates (we will assume, for the purpose of the present discussion, that our YMCs are fully virialised based on their ages of yr, i.e., many crossing times old) and (ii) high-resolution imaging (e.g., with the Hubble Space Telescope; HST) to measure their luminosities and sizes.
In this paper, we explore the potential of a novel method to compare the properties of YMCs in the context of those of old GC systems, and predict their evolution over a Hubble time. In Section 2 we outline the basic diagnostic tool we will use, based on the distribution of old GCs in space (luminosity vs. central velocity dispersion). We extend this idea to younger clusters in Section 3, and discuss the uncertainties involved in our assumptions in Section 4. Section 5 provides a detailed discussion of the implications of our results, and we conclude the paper in Section 6.
2 The plane as a diagnostic tool for old globular clusters
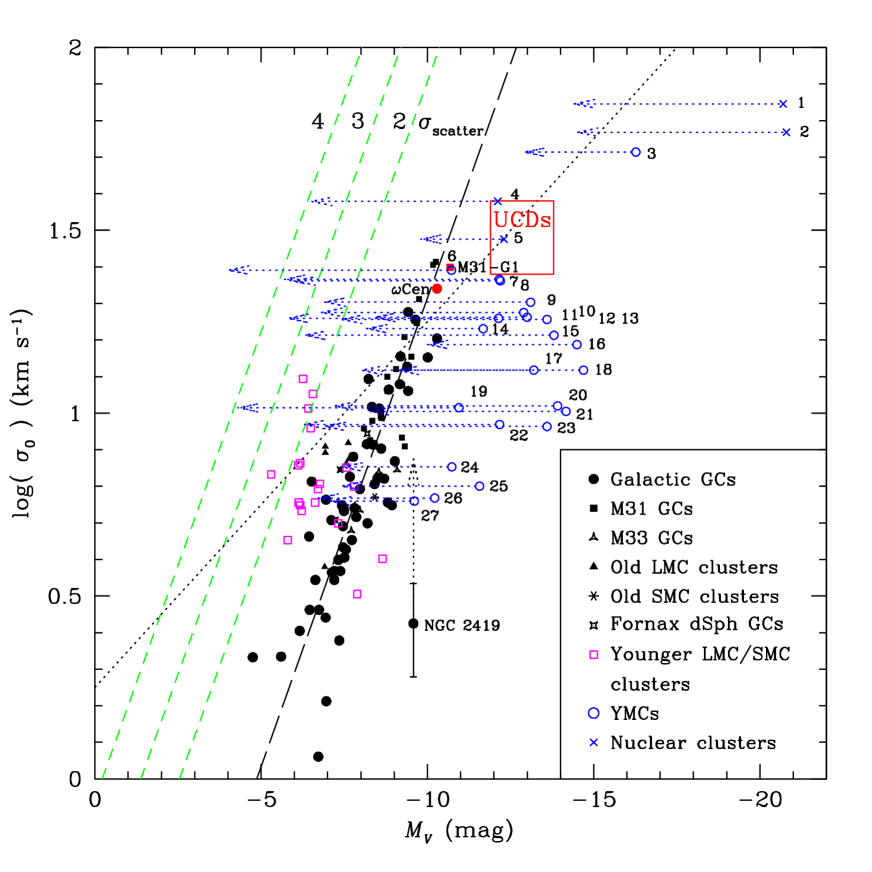
It is well-known that the central velocity dispersion, , of old GCs in the Galaxy and in M31 is tightly correlated with their -band luminosity, (e.g., Meylan & Mayor 1986, Paturel & Garnier 1992, Djorgovski 1991, 1993, Djorgovski & Meylan 1994, Djorgovski et al. 1997). McLaughlin (2000a) suggests that this is a consequence of the tighter relationship between a cluster’s binding energy, , and its luminosity, , which is one of the defining relationships of the GC fundamental plane. In Fig. 1 we show this relationship for old GCs, represented by the filled symbols. We not only include the Galactic and M31 GCs (56 and 21 objects, respectively; Pryor & Meylan 1993, Djorgovski et al. 1997, Dubath & Grillmair 1997, Dubath, Meylan & Mayor 1997; photometry from Crampton et al. 1985, Bonoli et al. 1987, Reed, Harris & Harris 1994), but have also added – for the first time – the data points for the ( Gyr) old compact Magellanic Cloud clusters (9 clusters; Dubath et al. 1993, 1997; photometry from Bica et al. 1996, de Freitas Pacheco, Barbuy & Idiart 1998), and the old GCs in M33 (Larsen et al. 2002) and the Fornax dwarf spheroidal (dSph) galaxy (Dubath et al. 1992, 1993) with available velocity dispersion measurements (4 and 3 GCs, respectively, for M33 and the Fornax dSph). Although uncertainty estimates are available for both the photometry and the central velocity dispersions, we decided not to include error bars for the individual objects for reasons of clarity. As an example, slightly larger than typical error bars are shown for NGC 2419; generally speaking, the uncertainties in the central velocity dispersion are –40 per cent (or 0.10–0.15 dex), while the photometric uncertainties are mostly smaller than the symbol sizes.
We find that the additional Local Group GCs follow, within the measurement uncertainties, the relationship for the Galactic and M31 GCs. This is consistent with unpublished results for the Fornax dSph and Small Magellanic Cloud (SMC) GCs referred to by Djorgovski & Meylan (1994).
The best-fitting relationship between the GC luminosities and their central velocity dispersion is represented by the long-dashed line in Fig. 1, which has the functional form
| (1) |
or
| (2) |
with correlation coefficient , when expressed in the logarithmic units used in Fig. 1. Based on his identification of a GC fundamental plane, McLaughlin (2000a) predicted a dependence of the form for the pre-core collapse GCs in the Milky Way. He found that the form of the correlations obtained by projecting the GC fundamental plane depends only weakly on cluster properties such as Galactocentric distance and concentration – in fact, these affect the normalisations of the relations rather than their slopes. Our larger data set displays a relationship that is very similar to the predicted one.
The most discrepant data point among the old GCs is that of the Galactic GC NGC 2419, as indicated in Fig. 1. It is one of the most luminous Galactic GCs, and yet has one of the lowest measured central velocity dispersions; both of these observational parameters are well determined and the uncertainties are too small to allow for the cluster to fall within the normal scatter around the best-fitting relationship (cf. Olszewski, Pryor & Schommer 1993). The arrow extending from the GC’s location to higher velocity dispersions indicates the expected value for its central velocity dispersion based on its structural parameters and calculated using single-mass isotropic King models with a constant mass-to-light (M/L) ratio of (Gnedin et al. 2002). NGC 2419 is a large (half-light radius, pc), old ( Gyr) outer halo GC, located at a Galactocentric distance of kpc (Harris 1996). It is possibly not a normal GC, but has been speculated to be the stripped core of a former dSph galaxy (e.g., van den Bergh & Mackey 2004; but see Section 3.2). Its exclusion from the GC sample used to derive the best-fitting relationship between and does not alter this relationship significantly.
The slope of the combined best-fitting relationship for all old Local Group GCs with measured velocity dispersions is, within the measurement uncertainties, consistent with the slopes most recently determined by Djorgovski et al. (1997) for both the Galactic and M31 GCs individually ( vs. ) and for the combined Galactic/M31 GC sample (). In Fig. 1 we have also indicated the 2, 3 and envelopes toward fainter luminosities of the scatter of the GC data points about the best-fitting relationship (short-dashed lines; we have adopted a Gaussian distribution of the scatter, for reasons of simplicity). We will return to these envelopes in Section 3, where we will discuss the distribution and evolution of the younger clusters also included in this figure, and shown as the open circles and open squares.
3 Extending the globular cluster idea
3.1 Understanding the input data set
Encouraged by the tightness of the relationship for old Local Group GCs, we added the data points for the YMCs for which velocity dispersion measurements are available in the literature. These are indicated by the numbered open circles; Table 1 provides an overview of the YMC identifications and their age and metallicity measurements, and photometry. The YMCs are ranked in order of decreasing (central) velocity dispersion. Since most velocity dispersion measurements in the literature are given as the “observed” velocity dispersion, corresponding to the one-dimensional line-of-sight component, and denoted by or , where relevant we corrected these measurements to reflect the central value of the velocity dispersion profile. In practice, this corresponds to applying an aperture correction to the measurements from the effective size of the apertures used (typically corresponding to , for a given YMC). We adopted Djorgovski et al.’s (1997) correction for M31 GCs of (see also McLaughlin 2000a). Although the exact value of the clusters’ concentration, , is unknown in most cases, this correction is applicable where (so that ). This condition is met for all of the YMCs in our sample.
Djorgovski et al. (1997) estimated the uncertainty of this correction to be a few per cent, i.e. comparable to the measurement errors. We note that while this procedure possibly introduces uncertainties that are hard to quantify, our subsequent analysis is based on these values in logarithmic parameter space, where the impact of these uncertainties is minimised, dex (see McLaughlin 2000a). Yet, since the central velocity dispersions defining the relationship span more than an order of magnitude, our analysis of the relationship in logarithmic space does not penalise us in terms of the resultant accuracy.
It is less straightforward to understand the effects of conversions of the original photometric data to the band used to construct Fig. 1. Yet, because of the relatively small number of YMCs with measured (central) velocity dispersions, we endeavoured to include as large a data set as possible in order to increase the statistical relevance of the comparison done in this paper. The penultimate column in Table 1 indicates whether a given photometric entry was taken from the original reference, or derived from the original data. In the following sections, we will discuss our approach to these derivations on an object-by-object basis.
Our photometric conversion procedures are based on the following general principles:
-
•
Where we needed to adopt a distance modulus to a given YMC’s host galaxy, we used the most up-to-date values contained in the HyperLeda database111http://leda.univ-lyon1.fr/, except for M82, where we adopted based on Freedman et al.’s (1994) Cepheid-based distance to the M81/M82/NGC 3077 group.
-
•
Conversions from a given passband to the band are age and metallicity sensitive; we used the best available age and metallicity estimates, together with the most up-to-date GALEV simple stellar population (SSP) models (Schulz et al. 2002, Anders & Fritze–v. Alvensleben 2003), and assuming a Kroupa (2001; hereafter Kroupa01) IMF, covering the mass range from 0.1 to 100 M⊙ (see Section 4.1 for details). The Kroupa01 IMF is one of the current best descriptions of the mass distribution of the stellar populations in the solar neighbourhood. Below, we will also discuss the impact of adopting this IMF on the uncertainties in our resulting, converted -band magnitudes.
3.1.1 The NGC 1614 nuclear clusters
Puxley & Brand (1999) obtained high-resolution mid-infrared spectroscopy of the two nuclear star clusters in NGC 1614, using the Gemini 8m telescope. They calculated the objects’ individual bolometric luminosities to be and ( Lbol,⊙, respectively. Using the appropriate bolometric correction for the Sun, we derive and mag, respectively. The uncertainties here are dominated by the uncertainties in the original conversion from mid-infrared flux to bolometric luminosity. The combination of using the bolometric correction for the Sun and a metallicity of 2 Z⊙ contributes an uncertainty of up to mag. This is of a similar order as the uncertainties in the original photometry, where given in Table 1.
3.1.2 The nuclear cluster in NGC 1042
Photometry of the nuclear cluster in NGC 1042 was published by Böker et al. (2004) and Walcher et al. (2004) as mag. For the best age estimate of yr, our GALEV models for the appropriate metallicity indicate mag, thus leading to mag. The uncertainties in this conversion owing to the IMF parameterisation adopted are minimal; comparing the values for all of the IMFs discussed in Section 4.1 below, and assuming solar metallicity (see Table 1), we find a maximum difference among the colours predicted of mag, ranging from mag for the Salpeter (1955) IMF truncated at 1 M⊙, to mag for a non-truncated Salpeter IMF. By having adopted the Kroupa01 IMF, we have essentially halved this uncertainty.
A more important contribution to the photometric uncertainty arises from the fact that we have assumed the NGC 1042 NC to behave as a clean SSP. However, we note that this is perhaps a questionable assumption: nuclear clusters are more likely to be contaminated by secondary and tertiary star-formation episodes than more isolated star clusters in the outer regions of their host galaxies (e.g., Cid Fernandes et al. 2004), so that in essence we are measuring the properties of a luminosity-weighted mean stellar population in this case. We will return to this discussion below.
3.1.3 YMCs in the Antennae galaxies
Of the YMCs in the Antennae galaxies, only clusters [WS95]355 and [M03] required photometric conversions to the band; for the other YMCs we adopted the original photometry. Because of their young ages, of and Myr, the photometric uncertainties in the conversions to the band are more significant for these clusters than for the older nuclear cluster in NGC 1042.
For [WS95]355, Mengel et al. (2002) reported only an upper limit in the band, but a well-determined flux in . It is in this age range where uncertainties in the treatment of the more massive component of any SSP, and in particular that of the red supergiants, render colour transformations significantly uncertain. Adopting the same set of IMFs as above, we find that mag, ranging from mag for the Kroupa01 and Kroupa, Tout & Gilmore (1993, KTG93) IMFs to mag for the truncated Salpeter IMF. As we will see in Section 4.1 below, when evolved to an age of 12 Gyr, this YMC does stand out, by mag, from the majority of the other YMCs in our sample. Therefore, we believe that we can confidently include this object in our statistical analysis of the diagnostic diagram, despite this large photometric uncertainty, and despite the considerable uncertainty introduced by the poorly bracketed effects of internal extinction in the Antennae system (see Sect. 4.1 below).
Unfortunately, we cannot be as confident for cluster [M03]. For this object, our only photometric data consists of the combination of a dynamical mass estimate ( M⊙) and a -band M/L ratio of (Mengel 2003). Using , we then obtain . Similar analysis as presented in the previous paragraph shows that the inherent photometric uncertainties at its young age caused by IMF variations amount to mag, ranging from mag for the KTG93 IMF to mag for the truncated Salpeter IMF. By adopting the Kroupa01 IMF as our IMF parameterisation, we reduce this uncertainty to mag. Contrary to [WS95]355, [M03] does not stand out from the sample objects in any specific way, and in view of the large photometric uncertainty, we can only conclude that this cluster appears to follow the trend set by the bulk of the sample (see Section 4.1).
3.1.4 The NGC 1487 YMCs
Our -band magnitudes for the three YMCs in NGC 1487, also observed by Mengel (2003), were obtained using exactly the same procedure as used for Antennae YMC [M03]. Once again, because of the YMCs’ ages clustering around 8 Myr, the photometric uncertainty owing to the -to- conversion is significant and highly IMF dependent, with the most likely uncertainty on the order of mag, as discussed above. As we will see in Section 4.1, although these three objects show tentative differences with respect to the majority of our cluster sample, when evolved to a common age of 12 Gyr, the large photometric uncertainty does not allow us to draw firm conclusions on these perceived differences.
3.1.5 YMCs in M82
Of the three sample YMCs drawn from the large cluster sample in M82, we used the original photometry of Smith & Gallagher (2001) for M82-F, which the authors attempted to correct for the effects of a few saturated pixels. Nevertheless, we are more confident using the corrected magnitude (the quoted uncertainty in which already includes the effects caused by the saturated pixels) than McCrady et al.’s (2003) near-infrared HST photometry, in view of the much larger uncertainties introduced by filter conversions using a given IMF (see above). McCrady et al. (2005) report new ACS observations of M82-F in the HST F555W band, but do not give the cluster’s integrated magnitude in this filter. In view of the uncertainties involved in converting their F814W luminosity to a -band flux, we are hesitant to take this approach.
For objects MGG-9 and 11, we have to resort to a similar technique as applied to the NGC 1487 clusters and to YMC [M03] in the Antennae galaxies. McCrady et al. (2003) provide HST-equivalent (F160W) and -band (F222M) photometry for these two objects. Given their age of Myr, the uncertainty due to the passband conversion amounts to mag for the same range of IMF parameterisations as used above. In addition, as we will show below (Section 4.1), the additional photometric uncertainties owing to the intrinsic uncertainties in the F160W-band extinction estimates of McCrady et al. (2003) are considerable.
3.1.6 Concluding remarks
Based on the analysis of the effects of passband conversions on the quality of the input photometry for the diagnostic diagram, we conclude that the resulting uncertainties are most significant for the youngest objects. These converted -band magnitudes should therefore be treated with caution. In our sample of 27 YMCs, this affects six objects, for which mag. For the remainder of the sample, the photometric uncertainties in the input data are significantly smaller, and mostly on the order of up to several tenths of a magnitude.
| ID | Clustera | Age (yr) | Ref. | Metallicity | Ref. | Original / | Original | |
|---|---|---|---|---|---|---|---|---|
| adopted | Derived | Ref. | ||||||
| 1 | NGC 1614-NC1 | 25 | 2 | D | 25 | |||
| 2 | NGC 1614-NC2 | 25 | 2 | D | 25 | |||
| 3 | NGC 7252-W3 | 18 | 18 | O | 17,18, | |||
| 26 | 26 | |||||||
| 4 | IC 342-NC | 5 | 30 | O | 5 | |||
| d | 28 | |||||||
| 5 | NGC 1042-NC | 31 | e | D | 6,31 | |||
| 6 | Antennae-[WS95]355 | 21 | 21 | D | 21 | |||
| 7 | Antennae-[W99]15 | 21 | 21 | O | 21 | |||
| 8 | NGC 1487-3 | 22 | 1f | D | 22 | |||
| 9 | NGC 1487-1 | 22 | 1f | D | 22 | |||
| 10 | NGC 1487-2 | 22 | 1f | D | 22 | |||
| 11 | Antennae-[W99]16 | 21 | 21 | O | 21 | |||
| 12 | M82 MGG-9 | 19 | 19 | D | 19i | |||
| 13 | NGC 1569-A1b | 12 | [Fe/H] | 3,8, | O | 7j | ||
| 12,24 | 10,13 | |||||||
| 4c | [Fe/H] | 4c | ||||||
| 14 | NGC 4214-13 | 15 | 15 | O | 15 | |||
| 15 | Antennae-[W99]2 | 21 | 21 | O | 21 | |||
| 16 | M82-F | 27 | 27 | O | 27i | |||
| 19,20 | ||||||||
| 17 | M82 MGG-11 | 19 | 19 | D | 19i | |||
| 18 | NGC 1705-I | 11 | 29 | O | 23 | |||
| 29 | ||||||||
| 19 | Antennae-[WS95]331 | 21 | 21,22 | O | 22 | |||
| 20 | Antennae-[W99]1 | 21 | 21 | O | 21 | |||
| 21 | NGC 6946-1447 | 14 | 9,14 | O | 15 | |||
| 9 | g | 28 | ||||||
| 15 | ||||||||
| 22 | NGC 5236-805 | 16 | h | 16 | O | 16 | ||
| 23 | Antennae-[M03] | 22 | 21,22 | D | 22 | |||
| 24 | NGC 4449-47 | 15 | 15 | O | 15 | |||
| 25 | NGC 5236-502 | 16 | h | 16 | O | 16 | ||
| 26 | NGC 4214-10 | 15 | 15 | O | 15 | |||
| 27 | NGC 4449-27 | 15 | 15 | O | 15 |
Notes: a “NC” refers to nuclear clusters; The original Antennae cluster data is from Whitmore & Schweizer (1995; [WS95]), Whitmore et al. (1999; [W99]) and Mengel (2003; [M03]); b We adopted an age of 8 Myr for this cluster; c Based on broad-band photometry; d 12 + log(O/H) at a radius of 4 kpc and rising inward; e Although no metallicity estimates are available, we adopted solar metallicity on the basis that the cluster was likely formed from pre-enriched material; f They adopted ; g 12 + log(O/H) in the galactic centre; h and all give similar results; we adopted solar metallicity; i These absolute magnitudes were corrected for extinction by the original authors, so that they represent ; j Based on the absolute magnitude in the HST F555W filter. References: 1, Agüero & Paolantonio (1997); 2, Aitken et al. (1981); 3, Aloisi et al. (2001); 4, Anders et al. (2004); 5, Böker et al. (1999); 6, Böker et al. (2005); 7, De Marchi et al. (1997); 8, Devost et al. (1997); 9, Efremov et al. (2002); 10, Greggio et al. (1998); 11, Ho & Filippenko (1996b); 12, Hunter et al. (2000); 13, Kobulnicky & Skillman (1997); 14, Larsen et al. (2001); 15, Larsen et al. (2004); 16, Larsen & Richtler (2004); 17, Maraston et al. (2001); 18, Maraston et al. (2004); 19, McCrady et al. (2003); 20, McCrady et al. (2005); 21, Mengel et al. (2002); 22, Mengel (2003); 23, O’Connell et al. (1994); 24, Origlia et al. (2001); 25, Puxley & Brand (1999); 26, Schweizer & Seitzer (1998); 27, Smith & Gallagher (2001); 28, Tosi & Díaz (1985); 29, Vázquez et al. (2004); 30, Verma et al. (2003); 31, Walcher et al. (2004).
3.2 A diagnostic diagram for testing the universality of the YMC formation process?
In order to compare the YMC loci with those of the GCs, we evolved the YMC luminosities to a common age of 12 Gyr (see the dotted arrows toward fainter luminosities in Fig. 1), using the most recent GALEV SSP models, and assuming a “standard” Salpeter IMF, covering the mass range from 0.1 to 100 M⊙. We took special care to adopt the most appropriate SSP models, based on their current age and metallicity (see Table 1). In the remainder of this paper, wherever we refer to the evolution of our YMC sample to an age of 12 Gyr, we implicitly assume this standard Salpeter IMF, and stellar evolution following the GALEV SSPs, unless indicated otherwise.
At first sight, we identify three main results based on this photometric evolution:
-
1.
Almost all YMCs appear to evolve to loci on the fainter side of the old GC relationship. This may give us a handle on the functional form of the realistic IMF, if we assume that these YMCs will evolve to obey the GC relationship at old age. In addition, it may help us to determine whether the YMC formation process itself is (close to) universal;
-
2.
For most YMCs, luminosity evolution governed by a Salpeter-type IMF results in these objects ending up very close to the best-fitting GC relationship by the time they reach an age of 12 Gyr;
-
3.
A small fraction ( per cent) of the YMCs appear to form a distinct group at significantly fainter luminosities than expected for old GC-type objects, if we evolve their luminosities assuming a Salpeter-type IMF. This implies that if their initial mass function (MF) was similar to the Salpeter law, their present-day MF must be significantly depleted in low-mass stars if they are assumed to evolve to the GC relationship, as we will see below. Alternatively, if the IMF was unlike a Salpeter-type IMF, then comparison with the clusters discussed in point (ii) would suggest that IMF variations exist in the highest-density regions in active starbursts, the birth places of these YMCs. In this context, it is worth noting that the tightness of the relationship for the Local Group GCs, and the lack of any significant dependence of GC properties on metallicity (see also Sect. 4 and McLaughlin 2000b) points to a universal IMF in – at least – the Local Group.
Of the 20 YMCs with projected central velocity dispersions smaller than those of the most massive GC candidates in the Local Group (Cen in the Galaxy, and G1–Mayall II in M31) 13 objects have the potential to evolve to a position in the diagnostic diagram within of the best-fitting GC relationship. Since all of the GCs in our Local Group GC sample fall well within this envelope, we adopt this envelope as the stability boundary for a cluster to survive for a Hubble time (we realise that this is, of course, a relatively arbitrary assumption, but we will use it simply to guide the discussion). Of the remaining 7 YMCs with projected central velocity dispersions smaller than those of Cen and G1, 5 objects overshoot even the envelope if we adopt a standard Salpeter IMF for their stellar content. If this IMF assumption is valid, then these objects would appear to be too dynamically hot, given their luminosities, to become old GC counterparts. If they are to evolve to loci close to the well-established GC relationship, their IMF (or their present-day MF) must be significantly different from Salpeter; we will return to this issue in Section 4.1.
The five objects with the largest projected central velocity dispersions are suspected to be either nuclear star clusters, or perhaps stripped dSph or dwarf elliptical (dE) nuclei (cf. NGC 7252-W3 = object 3; Maraston et al. 2004). Their range of central velocity dispersions overlaps that of the recently discovered “ultracompact dwarf galaxies” (UCDs) in the Fornax cluster (e.g., Hilker et al. 1999, Drinkwater et al. 2000, 2003). The nature of these latter objects is as yet unclear: they may be very large star clusters (perhaps stripped nuclear clusters), or instead extremely compact dE galaxies, such as M32. On the assumption that these objects constitute a new class of galaxies, Drinkwater et al. (2003) argued that they follow the Faber-Jackson (FJ) relation for elliptical galaxies, which has a slope that is markedly different from that of the GC relationship. The FJ relation for elliptical galaxies, and the loci of the Fornax UCDs are also indicated in Fig. 1. Intriguingly, the crossing point between the FJ and GC relationships is very close to the locations of Cen and M31-G1 in the diagnostic diagram of Fig. 1; both objects have been suggested to be the stripped nuclei of dwarf galaxies captured by their host galaxies.
Unfortunately, however, neither the location by itself of the Fornax UCDs on the FJ relationship, nor of any of the other (nuclear) star clusters, provides conclusive evidence as to the nature of these extremely massive objects, unless their dominant stellar populations are older than Gyr. For the Fornax UCDs to evolve to the GC relationship, their dominant stellar populations need only be as young as (or younger than) Gyr, somewhat depending on metallicity, again assuming that they are governed by a standard Salpeter-type IMF and stellar evolution as described by the GALEV SSP models.
Hilker et al. (1999) analysed two of the five Fornax UCDs in more detail spectroscopically, and concluded that while object CGF 5-4 is most likely older than Gyr (ages as young as 3 Gyr can be excluded with confidence), the location of object CGF 1-4 in the Mg2 vs. Fe diagram suggests an age as young as Gyr ( uncertainty), based on its H line strength. In addition, Drinkwater et al. (2000) point out that the spectra of these objects are best fit by K-type stellar templates, consistent with an old (metal-rich) stellar population. This suggests that they might be related to GCs, since dE galaxies observed with the same set up are best fit by younger F and early G-type templates. Thus, the nature of these intriguing objects is still an open issue.
If we now consider our sample objects with the largest central velocity dispersions in this context, and evolve their dominant stellar populations to a common age of 12 Gyr, we find that they tend toward the best-fitting GC line, although within the uncertainties (see Section 4) they are also consistent with objects following the FJ relationship. We also note that while we have used SSP models to evolve the luminosities of these nuclear clusters to old age, this is strictly speaking not correct. Nuclear clusters are not well described by “simple” stellar populations, but exhibit (sometimes significant) age ranges (e.g., Cid Fernandes et al. 2004). The implication of this is that, in fact, we may have overestimated the lengths of the luminosity evolution arrows in Fig. 1 for these objects, depending on how much their stellar contents deviate from the SSP approximation, and from a Salpeter-type IMF (see Section 4.1). The main consequence of this is that these nuclear clusters may indeed follow the FJ relationship if they are able to survive to old age.
Thus, by placing the recently discovered UCDs in this context, we believe that they may be closely related to nuclear star clusters, and perhaps are the stripped nuclei of dE galaxies, akin to Cen, M31-G1, and NGC 7252-W3 (Maraston et al. 2004; see also Drinkwater et al. 2003).
Let us now briefly return to the suggestion by van den Bergh & Mackey (2004) that the unusual GC NGC 2419 may also be a similar type of object. If this were the case, we would expect the cluster to be located close to either the FJ relation in Fig. 1 or – if it were a genuine GC – to the fundamental plane correlation for Galactic GCs (e.g., Dubath et al. 1997, their Fig. 16, McLaughlin 2000a). In either case, the location of NGC 2419 is, respectively, and (where represents the measurement uncertainty) removed from the fiducial relationship. Therefore, we conclude that it is unlikely that NGC 2419 is the stripped core of a dSph galaxy.
We note that, thus far, we have only considered the evolution of the YMCs in terms of their luminosity, and have ignored the possibility of significant evolution of the central velocity dispersion over a Hubble time. Following an initial phase of mass loss caused by stellar evolution, the long-term dynamical evolution of star clusters is dominated by evaporation due to internal relaxation and stripping due to external, tidal shocks. The latter process removes mass (and luminosity), but should not significantly affect the central velocity dispersion (e.g., Djorgovski 1991, 1993, Djorgovski & Meylan 1994). It is unclear, however, how the central velocity dispersion evolves over time as a result of internal evolution in the presence of external tidal fields, significant binary fractions, the effects of mass segregation and core collapse. -body simulations present an ideal way to investigate this problem. However, despite the vast literature on -body simulations of star clusters, we are not aware of any paper which presents the evolution of the central, projected velocity dispersion of the simulated clusters. Therefore, in Section 4.2 we investigate the evolution of the observable properties of a set of simulated -body clusters in order to constrain the expected evolution of the observed .
3.3 Comparison with previous predictions
In the previous sections we have constructed a diagnostic tool that could potentially tell us whether a given YMC might evolve into a GC-type object over a Hubble time, based on only two observables: the cluster’s (central) velocity dispersion and its -band luminosity (or absolute magnitude). This provides a simpler and potentially more reliable method to predict, to first order, the evolutionary fate of YMCs than existing methods. In particular, the most common method to assess this issue is based on the comparison of dynamical cluster mass estimates with a variety of IMF descriptions in the (Age vs. M/L ratio) plane. This method introduces two complications that we can in principle avoid using the approach: in order to estimate an object’s dynamical mass, one needs to (i) assume that the virial theorem applies (which is generally assumed to hold for clusters older than Myr), and (ii) obtain a reliable measurement of the cluster radius. While the complication introduced by the assumption of virialisation is minimal (although it may play a significant role for the youngest objects in our sample!), measuring reliable cluster radii is problematic for all but the nearest objects. In addition, using the half-light radius as an estimate of the volume occupied by the cluster implicitly assumes that the M/L ratio is constant across the cluster – an assumption that may be unjustified in the presence of significant mass segregation, as shown observationally (see, e.g., de Grijs et al. 2002b, and references therein; see also Section 3.3.3 below and the discussion in McCrady et al. 2005). Thus, here we have presented a simpler and potentially more reliable method to predict the approximate evolution for a given YMC than currently available.
We will now compare the predictions from this new method to those obtained from the dynamical mass estimates, in order to assess the robustness of the approach, on a case by case basis, for those of our sample clusters for which this information is available. Where appropriate, we will also point out those cases where discrepancies between our new results and previous predictions occur; these provide a useful insight into the uncertainties inherent to the use of any of the methods currently employed in this field. For the purposes of this discussion, we will consider whether the observational data are consistent with the assumption that all surviving old star clusters will obey the Local Group GC correlation between and , within the uncertainties.
3.3.1 Antennae clusters
Mengel et al. (2002) concluded, aided by ground-based -band luminosities, that clusters [W99]1 and [W99]2 appeared to have a deficit of low-mass stars (see their Fig. 7), either because of a shallower-than-Salpeter IMF slope down to stellar masses of M⊙, or because of a low-mass IMF cut-off. Their results for YMCs [W99]15, 16 and [WS95]355 are more consistent with a steeper IMF slope, similar to or steeper than the standard Salpeter slope (or, alternatively, an overabundance of low-mass stars compared to the standard Salpeter IMF), down to low masses. These results are supported by their HST-based -band observations for [W99]1, 15 and 16 (although the uncertainties for cluster [W99]1 make it a potential object with a Salpeter-type slope; see their Fig. 6), although the opposite trend is found for object [W99]2, at a level of 2–3 times the uncertainty in the measurements. This object appears to be characterised by a decidedly larger proportion of low-mass stars based on its -band photometry than seemed to be the case based on the -band data (see below for a discussion). It is striking that they seem to find systematically steeper IMF slopes (or, equivalently, IMFs richer in low-mass stars) in the higher-density overlap region between the two merging galaxies (containing clusters [W99]15, 16 and [WS95]355; although [W99]16 may not be located in the densest region, we believe its ambient density to be much higher than that in the outer regions of the system; see also Mengel et al. [2002]), while the low-mass deficient IMFs are found in the outer spiral arms (containing objects [W99]1 and 2). Mengel (2003) obtained similar quality measurements for the additional YMCs [M03] and [W99]331, both of which appear to be characterised by a “normal” IMF with a Salpeter-type slope down to 0.1 M⊙ in their diagnostic (Age vs. ) diagram.
If we adopt the assumption that these YMCs will eventually evolve to loci close to the relation for old GCs – at least, if they survive sufficiently long – then our diagnostic diagram suggests that clusters [WS95]331, [WS95]355, [W99]15, and [W99]16 (objects 19, 6, 7 and 11 in Table 1, respectively) are characterised by a present-day MF that differs significantly from a standard Salpeter-type (I)MF; evolved to an age of 12 Gyr using a Salpeter IMF, their luminosities will fade to well beyond the envelope. This conclusion remains valid even in view of the large photometric uncertainty associated with [WS95]355 (see Section 3.1.3). Antennae YMCs [W99]1 and [M03] (objects 20 and 23, respectively; note the large photometric uncertainty associated with [M03]), on the other hand, appear to have an (I)MF that is closer to the Salpeter function down to low stellar masses, if we assume that when the current generation of YMCs in the local Universe evolves to GC-type ages, they should also occupy the GC relationship. Depending on the uncertainties in the luminosity evolution (see Section 4), cluster [W99]2’s (object 15) evolved location in the plane is also consistent with such a Salpeter-type (I)MF. We note, however, that all of these objects may well have non-Salpeter-type MFs, considering that our simple modelling lets them evolve to significantly fainter magnitudes than expected if they were to obey the well-defined Local Group GC relationship at similar age.
In order for a YMC to survive to old age, it needs to have sufficient low-mass stars to remain bound for a Hubble time. This condition is met for Salpeter-type IMFs extending down to masses on the order of 0.1 M⊙, but not for objects with much shallower slopes, or (obviously) a low-mass cut-off.
Thus, from a detailed comparison between our results and those presented in figures 6 and 7 of Mengel et al. (2002) and in Mengel (2003), we conclude that, on average, we obtain similar predictions for the future evolution of the Antennae YMCs, although our detailed conclusions may differ for some of the individual objects. For instance, while Mengel et al. (2002) suggest that [WS95]355 and [W99]15 may be better represented by a slightly steeper than Salpeter slope, for the full mass range from 0.1 to 100 M⊙, we do not believe that the uncertainties inherent to the data warrant such a fine distinction. While for objects [W99]1 and 2 they obtain somewhat conflicting results from their and -band data, our conclusions (based on the -band data) agree for [W99]1, but differ for [W99]2. These discrepant results may in part be explained by the difficulty of obtaining clean cluster photometry from ground-based () versus HST-based () data; the difference in M/L ratios in Mengel et al.’s (2002) between the and the band is as expected if source confusion played a more important role in the ground-based images. In addition, in the presence of significant mass segregation, one would also expect to obtain different results between the and -band M/L ratios (e.g., McCrady et al. 2003, 2005), in a similar sense as seen here. However, the data of Mengel et al. (2002) show a general offset between the and the band for all of their objects, so that this cannot be the only explanation. In essence, this shows the extent to which one can rely on any individual approach; it shows, in particular, that conclusions on the evolution of the objects that are predicted to evolve to the area close to the 2– transition region in Fig. 1 should be treated with caution.
Finally, most of the objects that we predict to overshoot the boundary by a significant amount by the time they reach an age of 12 Gyr are located in the higher-density regions of the system. It is likely that the ambient pressure in the interaction region is significantly higher, and externally driven dynamical evolution proceeds faster than in the more quiescent spiral arm regions (Section 5.2); this may render invalid the assumption that these clusters are in virial equilibrium, in particular in view of their very young ages, of Myr (Mengel et al. 2002, Mengel 2003; see Table 1).
3.3.2 NGC 1487 clusters
Based on the determinations in Mengel (2003) and their location in the (Age vs. ) diagram, the luminosities of YMCs NGC 1487-1 and 2 are consistent with Salpeter-type IMF slopes down to masses of M⊙. Cluster NGC 1487-3, on the other hand, has a much lower -band M/L ratio for approximately the same age (see Mengel 2003), which is indicative of a steeper IMF slope.
Evolved to a common age of 12 Gyr in Fig. 1, clusters NGC 1487-1 and 2 are found in the boundary region between GC stability and GC dissolution, i.e., between the 2 and 3 envelopes. The uncertainties in the -band photometry that we obtained from our -to- conversions, and also the luminosity evolution may reduce the lengths of their luminosity evolution arrows (see Section 4), so that these objects may potentially evolve into GC-type objects over a Hubble time (but see Section 5.2).
Compared to NGC 1487-1 and 2, object NGC 1487-3, appears to be an outlier, which may evolve to well beyond the envelope if its present-day MF is Salpeter-like. However, we note that the large photometric uncertainty introduced by our passband conversion only allows us to conclude this tentatively.
If we compare the loci of the NGC 1487 YMCs in the (Age vs. ) diagram of Mengel (2003) with their expected evolution in the diagram of Fig. 1, we conclude that our results are consistent with those of Mengel (2003). Clusters 1 and 2 are (perhaps marginally) consistent with Salpeter-type MFs, while YMC 3 is characterised by an overabundance of low-mass stars compared to clusters 1 and 2 (and compared to the standard Salpeter IMF), and is better represented by an IMF with a steeper-than-Salpeter slope () for a stellar mass range from 0.1 to 100 M⊙.
Once again, these objects are among the youngest in our sample, and as such they may not yet be entirely virialised.
3.3.3 M82 clusters
When we evolve the luminosities of clusters F, MGG-9 and MGG-11 to a common age of 12 Gyr, they are all found within about the GC relationship. This implies, again adopting the assumption that all old GCs are confined to a narrow distribution in space and characterised by a Salpeter IMF, that these three M82 clusters may potentially evolve into GC-type objects. McCrady et al. (2003, 2005) suggest that all three clusters are affected by significant mass segregation, whether primordial or dynamical: every single YMC studied in sufficient (spatially resolved) detail to date is known to show significant mass segregation, from the youngest ages (see de Grijs et al. 2002a,b for a discussion). In the presence of significant mass segregation, the estimated YMC masses are lower limits.
McCrady et al. (2003) concluded that MGG-9 and MGG-11 are consistent with Salpeter-like IMFs, in the presence of significant (primordial) mass segregation. Neglecting the effects of mass segregation, MGG-11 appears to be high-mass dominated. This scenario seems to be confirmed by our results based on Fig. 1. Smith & Gallagher (2001), on the other hand, concluded that M82-F will likely dissolve within the next Gyr. They concluded that its IMF was likely truncated at a lower mass of 2–3 M⊙, thus retaining too few low-mass stars to produce a bound cluster over time-scales longer than a Gyr. However, McCrady et al. (2003, 2005) provide evidence for mass segregation in cluster F (resulting in more compact profiles at redder wavelengths), while they also redetermine the age to be toward the lower limit of the uncertainty range quoted by Smith & Gallagher (2001). The latter authors’ result is also affected by a somewhat uncertain correction for the saturated cluster centre in the HST -band image. Taking all of these effects together, McCrady et al. (2003, 2005) conclude that M82-F may be deficient in low-mass stars (i.e., a simple application of SSP models to the observed M/L ratio suggests a low-mass cut-off at M⊙), although in view of the significant mass segregation present, it is equally likely characterised by a “standard” IMF. These results support our conclusion.
3.3.4 M83 (NGC 5236) clusters
Of the two M83 clusters in our sample, object NGC 5236-502 appears to be characterised by a standard Salpeter IMF, based on the fact that adopting this IMF will let the YMC evolve to a location close to the old GC relationship. This is fully consistent with the conclusion reached by Larsen & Richtler (2004), based on their more complex analysis of the cluster’s dynamical mass and its corresponding M/L ratio. Cluster NGC 5236-805, however, appears to overshoot the envelope somewhat, if it were governed by a similar initial and/or present-day MF, although the uncertainties inherent in the luminosity evolution (see Section 4) still allow for this object to have a close-to-Salpeter MF. Thus, we conclude that our results for this object are also consistent with Larsen & Richtler’s (2004) independent assessment.
3.3.5 NGC 1569-A1
The measurements for NGC 1569-A1 are affected by significant uncertainties. The original high-dispersion spectra of Ho & Filippenko (1996a) are contaminated by flux from the its binary companion cluster, A2, which was first realised by De Marchi et al. (1997). However, since A1 is almost twice as bright as A2, De Marchi et al. (1997) argued that the basic velocity dispersion measurement of Ho & Filippenko (1996a) still reflects that of the main component, A1. In addition, because of the contamination by A2, the age determination of component A1 is affected by significant uncertainties (see Table 1). For the purpose of the present paper, we have used the most up-to-date photometry of De Marchi et al. (1997) and the best age determination of Myr (Hunter et al. 2000, Origlia et al. 2001). When we evolve the cluster’s luminosity to an age of 12 Gyr, it is found on the envelope of the GC relation. The uncertainties inherent in the luminosity evolution are such that any correction will result in this evolution being reduced and thus the cluster would end up closer to the GC relation. Therefore, we predict that NGC 1569-A1 will likely become an old GC (in the absence of external disruptive forces; see Section 5.2). As a consequence, we also suggest that the cluster’s IMF may be close to the standard Salpeter IMF. Our conclusions are consistent with those of De Marchi et al. (1997), based on their analysis of the evolution of the M/L ratio, assuming a Salpeter IMF down to the hydrogen-burning limit, and with Origlia et al. (2001), based on SSP fits governed by variety of IMFs. Our results are also consistent with Ho & Filippenko (1996a), despite different assumptions used for the mass determinations; these authors also concluded that – to a first approximation – the NGC 1569-A IMF appeared to be similar to that of typical Galactic GCs.
3.3.6 NGC 1705-I
Ho & Filippenko (1996b) concluded, using a similar approach as for NGC 1569-A (i.e., A1 and A2 combined), that NGC 1705-I has all the properties (M/L ratio, radius, mass) of a young, metal-rich GC (but note the caveat mentioned above regarding their mass determinations). In the most recent detailed study of the stellar content of NGC 1705-I, Vázquez et al. (2004) conclude – based on HST/STIS spectroscopy and an analysis of the cluster’s M/L ratio – that there is no significant evidence for an anomalous IMF at the low-mass end, contrary to previous suggestions (see references in Vázquez et al. 2004). This is fully consistent with the location of the YMC in our diagnostic diagram when evolved to an age of 12 Gyr.
3.3.7 Clusters in NGC 4214 and NGC 4449
Larsen et al. (2004) obtained high-dispersion spectra for four YMCs in the dwarf irregular galaxies NGC 4214 and NGC 4449. For all clusters, they find M/L ratios that are similar to or slightly higher than for a Salpeter or Kroupa01-type IMF. They thus rule out any present-day MF that is deficient in low-mass stars compared to these IMFs. They conclude that these objects might therefore evolve to become old GCs over a Hubble time. This conclusion is fully supported by the location of the evolved YMCs in our diagnostic diagram of Fig. 1.
3.3.8 NGC 6946-1447
Just as for the YMCs in NGC 4214 and NGC 4449, Larsen et al. (2004) also conclude that the present-day MF of NGC 6946-1447 resembles a Salpeter or Kroupa-type MF quite closely. They essentially confirmed their earlier result for this cluster (Larsen et al. 2001) where they concluded that the estimates for its dynamical mass and its photometric mass based on SSPs governed by a Salpeter IMF were similar within the model uncertainties. Thus, this object also has the potential of evolving into an old GC if not disrupted prematurely by external factors. This is again fully consistent with the cluster’s evolved location in our diagnostic diagram.
3.3.9 NGC 7252-W3
Finally, in a detailed spectroscopic and photometric study, Maraston et al. (2004) conclude that the dynamical virial mass for NGC 7252-W3, based on their newly obtained high-dispersion spectroscopy, is in excellent agreement with photometric values previously estimated (Schweizer & Seitzer 1998, Maraston et al. 2001) from the cluster luminosity by means of stellar M/L ratios predicted by SSP models with a Salpeter IMF down to stellar masses of M⊙. While this conclusion is consistent, within the uncertainties, with the object’s evolved location in our diagnostic diagram of Fig. 1, its velocity dispersion places it in the realm of the nuclear clusters and UCDs, so that caution needs to be exercised when comparing results in this context.
3.3.10 Concluding remarks
Thus, it appears that the simple diagnostic diagram results in consistent predictions regarding the evolution of YMCs in the local Universe, without the need to convert the observed velocity dispersions into dynamical masses and thus introducing additional assumptions and their associated uncertainties. Discrepancies between predictions on the YMCs’ evolutionary fate resulting from the application of different methods serve as a useful diagnostic providing insight into the likely range of uncertainties involved in any of these predictions. We note that our predictions should be treated as first-order predictions (as should those resulting from using dynamical mass estimates). They do not include external factors that might speed up the dissolution of otherwise firmly bound star clusters; we will address this issue in Section 5.2. Nevertheless, to first order, the fact that most clusters, when evolved using a standard solar-neighbourhood Salpeter-type IMF, appear to end up close to the GC relationship (although systematically somewhat to fainter magnitudes) instills some confidence in the universality of this IMF for extragalactic YMCs, leaving little leeway for significant IMF variations, assuming that they may potentially survive for a Hubble time. We note in passing that dynamical evolution of will tend to move our sample clusters even closer to the old GC relation, adding weight to this conclusion (see Section 4.2). We will discuss those objects that still appear to overshoot the GC relation in more detail in Section 5.2.
Finally, in Fig. 1 we have also included the relevant data points for the compact LMC and SMC clusters younger than 10 Gyr at the present time (open squares; Dubath et al. 1993, 1997; photometry from Bica et al. 1996, de Freitas Pacheco, Barbuy & Idiart 1998). If these objects are characterised by a Salpeter-type present-day MF and IMF, as is supported by observational evidence (see, e.g., de Grijs et al. 2002a,b for a representative sample of compact LMC clusters), they will fade by up to mag (and in most cases by more than mag) before they reach an age of 12 Gyr. However, very few of the compact LMC and SMC clusters extend to fainter absolute magnitudes than contained within the envelope of the best-fitting GC relation. This implies either that cluster disruption, at least in the Magellanic Clouds, must occur before a cluster fades to this limit, or that the old GC relation for the lower-density LMC environment is significantly different from (and much broader than) that in the Galaxy and M31. If we assume that the GC relation is independent of environment, as seems to be suggested by the good agreement of the old GCs in the Local Group, we predict that at least half of the LMC and SMC clusters younger than 10 Gyr will dissolve before reaching GC-type ages. The small number of LMC and SMC clusters currently beyond the boundary may either be caused by statistical sampling effects or perhaps we have caught objects in the process of dissolution. Once again, the presence of these objects gives a good indication of the uncertainties involved in using the diagnostic diagram: there is most likely a transition region in the diagram where clusters may or may not evolve to, depending on the details of their internal and environmental properties. In this context, we note that the LMC provides a fairly low-density stellar environment, particularly outside the central, barred region.
The two Magellanic Cloud objects toward brighter magnitudes than the best-fitting GC relationship are the youngest LMC cluster for which we have velocity dispersion information, NGC 1818 (25 Myr; de Grijs et al. 2002a) and NGC 419 in the SMC. If they are characterised by Salpeter-type IMFs down to M⊙ (cf. de Grijs et al. 2002b), these objects are likely to fade by and mag, respectively. Judging from their location in Fig. 1, we predict that while NGC 419 may possibly become an object equivalent to NGC 121 (the only GC-equivalent object in the SMC), NGC 1818 will likely disperse long before. We emphasise that in this case we have independent measurements of the cluster’s present-day MF (de Grijs et al. 2002a,b), so that this is a firm conclusion.
In this context, it is interesting to compare these results for the massive, compact star clusters in the Local Group to the Galactic open clusters. The Galactic cluster population exhibits a clear dichotomy, in the sense that all Galactic GCs are older than Gyr, while few Galactic open clusters are older than a few Gyr. If we include the roughly 40 Galactic open clusters with relevant observational data (Lohmann 1972, Sagar & Bhatt 1989) in our diagnostic diagram, they occupy a well-delineated region centred at , and lying on the extrapolation of the GC relationship. Considering that, if they were governed by a Salpeter-type IMF down to the hydrogen-burning limit, they would fade by at least another 2 mag, their location in the diagram is consistent with the observational fact that there are no known open clusters of typical GC age in the Galaxy.
4 Assessment of the uncertainties
Having established that, to first order, the diagram provides us with a diagnostic tool to assess the similarities (and differences) of YMCs compared to old GCs, we will now assess the uncertainties inherent to this approach. In Section 4.1 we will first address the uncertainties related to the evolution in luminosity of a given cluster. Subsequently, in Section 4.2 we will present the results of detailed N-body simulations to obtain a feeling for the uncertainties associated with the evolution of the central velocity dispersion over a Hubble time.
4.1 Luminosity evolution
The main issue we need to address regarding the luminosity evolution of our sample YMCs, as represented by the “luminosity evolution arrows” in Fig. 1, is the accuracy of the arrow lengths. In addition, we will address a number of issues related to the accuracy of the photometric measurements of the objects themselves. Regarding the former, the key issues to be discussed are the dependence of the luminosity evolution on (i) metallicity and (ii) the adopted IMF (and, therefore, on the adopted SSP models).
In Fig. 2a, we show the expected length of the luminosity evolution arrow as a function of cluster age, (), for the five different metallicities included in the GALEV SSPs. For the purposes of this discussion, we have adopted a Salpeter IMF, covering stellar masses from 0.1 to 100 M⊙. It is clear that the effect of adopting an incorrect metallicity is roughly constant as a function of age, and amounts to an error of mag over the entire age range spanned by our YMC sample if solar metallicity were incorrectly assumed. The effect decreases slightly for cluster ages yr. We note that we have taken great care to adopt the most appropriate metallicity for our sample YMCs (see Table 1), so that we are confident that we have minimised the uncertainties associated with the choice of cluster metallicity.


Secondly, we explore the effects of varying the IMF, . We consider the effects of varying both the slope, , and the low-mass cut-off of the IMF. In order to do so, we calculated the age dependence of the length of the “evolution arrows” in Fig. 2b for five different IMF representations, and solar metallicity. Except for IMF (ii) below, where we use the Starburst99 SSPs (Leitherer et al. 1999), we use the GALEV SSPs in all cases, and assume the IMF to cover the mass range from 0.1 to 100 M⊙. We consider the following IMFs, the effects of which on the luminosity evolution are shown in Fig. 2b:
-
1.
the “standard” Salpeter IMF, for masses between 0.1 and 100 M⊙, and for the entire mass range;
-
2.
the Salpeter IMF, but for the mass range M⊙;
-
3.
the Scalo (1986) IMF, for masses , characterised by
-
4.
the KTG93 IMF, with
and
-
5.
the Kroupa01 IMF:
Figure 3 displays the functional forms of these IMFs, normalised to a standard Salpeter IMF at 1 M⊙, which contains a total mass of 1 M⊙. This standard Salpeter IMF is shown as the solid line, and is used as reference in the following. Except for the truncated Salpeter IMF (short-dashed line), the other, more realistic IMFs are characterised by a turnover at or below 1 M⊙, and an enhanced contribution of intermediate-mass stars () compared to the full Salpeter IMF. In all cases, however, they are dominated by the lower-mass stars and provide, therefore, a solid basis for any compact virialised system to survive for up to a Hubble time (e.g., Gnedin & Ostriker 1997, Goodwin 1997a, Smith & Gallagher 2001, Mengel et al. 2002).
It is clear that the effects on the luminosity evolution arrow of varying the IMF are significant for all ages below several yr. Any correction to the length of the luminosity evolution arrow caused by a significant change in the IMF (for the IMFs discussed in this paper) is in the sense that the length of the arrow will be reduced; for the Kroupa01 and truncated Salpeter IMFs the effect is expected to be negligible. Thus, by adopting a more realistic IMF than the standard Salpeter representation (such as the KTG93 IMF, which accurately describes the solar neighbourhood IMF), those clusters that in our current diagnostic diagram of Fig. 1 would evolve to locations well beyond the envelope of the GC relationship if they were characterised by a Salpeter-type IMF down to the hydrogen-burning limit might well evolve to a location within . In addition, if we had assumed any more realistic IMF description for the luminosity evolution of our sample YMCs, the evolved loci of most of these objects might have scattered more symmetrically around the best-fitting GC relation, instead of systematically ending up on the faint side of the correlation (we have confirmed this for the case of the KTG93 IMF).
Based on the currently available data, we cannot draw firm conclusions on the actual (I)MFs of our sample clusters. Detailed follow-up N-body simulations, including the effects of primordial and dynamical mass segregation, and of varying binary fractions, are required to address this issue more robustly. This is, however, beyond the scope of the present work. On the other hand, the fact that most clusters, when evolved using a standard solar-neighbourhood Salpeter-type IMF, appear to end up close to the GC relationship is suggestive of the near-universality of an IMF for extragalactic YMCs of any of the currently fashionable forms discussed in this paper. Based on the available evidence, it is therefore more likely that the six YMCs that appear to have a central velocity dispersion that is significantly too large for their mass (luminosity) will disperse before reaching GC-type ages, than that they were characterised by significantly different initial MFs (and possibly very different present-day MFs; see also Section 5.2).
Thirdly, there are a number of observational uncertainties that affect the accuracy of the location of the data points at the present epoch. Some of the sample YMCs are affected by significant extinction in their host galaxies, so that any extinction correction introduces uncertainties in the clusters’ location at the present time. The objects most affected by these uncertainties are
-
•
NGC 6946-1447: mag (Schlegel et al. 1998);
-
•
NGC 1042-NC: based on -band photometry, only corrected for Galactic extinction. We believe that the main uncertainty in the photometry of this cluster is related to our assumption of it being a clean SSP, as discussed above;
-
•
IC 342-NC: mag (McCall 1989, Madore & Freedman 1992), but patchy and variable. Böker et al. (1999) measured mag toward the YMC, equivalent to mag, with an uncertainy of mag due to the patchiness of the extinction;
-
•
NGC 1614-NC1,2: based on bolometric luminosities, derived from mid-infrared observations, so that the accuracy of the conversion depends on the accuracy of the bolometric correction adopted. In addition, mag, in a clumpy distribution;
-
•
M82-F: mag (Smith & Gallagher 2001, but see McCrady et al. 2003). McCrady et al. (2005) conclude that their -band spectra are negligibly affected by extinction, while mag;
-
•
M82 MGG-9 and MGG-11: photometry based on near-infrared HST observations; and mag, respectively (McCrady et al. 2003). Translated to the band, the extinction becomes considerable, at and mag, respectively;
-
•
NGC 5236 clusters: mag (Schlegel et al. 1998). The internal extinction mag, and mag for NGC 5236-502 and NGC 5236-805, respectively (Larsen & Richtler 2004). Cluster 502 is located close to both a conspicuous dust lane, and to a fainter, bluer companion cluster; both objects are unresolved at ground-based spatial resolution.
-
•
NGC 4214-13: mag (Larsen et al. 2004);
-
•
the Antennae clusters [WS95]355 (photometry based on band data, since only an upper limit could be obtained in ; significant extinction), [WS95]331 and [M03] (both based on -band photometry; significant extinction). Based on a comparison of Mengel et al. (2001, 2002), Antennae YMCs [W99]1, 10, and 16 are affected by , and mag of extinction; the other Antennae objects are more highly extincted, although the details are lacking in the original papers.
-
•
the NGC 1487 clusters: based on ground-based -band photometry; no extinction estimates available.
| Name | Ext. Potential | Orbit | Ref.a | |||||
|---|---|---|---|---|---|---|---|---|
| Circ1 | 0.02 | 0 | 550 | 2.1 | PT | Circle | 1 | |
| Circ2 | 0.02 | 50 | 405 | 1.6 | PT | Circle | 1 | |
| Ecc1 | 0.02 | 0 | 130 | 1.3 | PT | Eccentric | 1 | |
| Circ3 | 0.001 | 0 | 12 | MW | Circle | 2 | ||
| Circ4 | 0.001 | 5 | 12 | MW | Circle | 2 | ||
| Circ5 | 0.0002 | 0 | 770 | 9 | PT | Circle | 2 |
aReferences: 1, Wilkinson et al. (2003); 2, Hurley et al. (2005)
However, while these uncertainties are significant, the respective authors in the original papers have taken great care to correct for these effects as well as possible, while we have applied additional corrections where it was deemed necessary.
Finally, we need to be aware of the potential effects caused by stochasticity in the IMF. At masses of up to a few M⊙, IMF sampling effects become noticeable and significant (Lançon & Mouhcine 2000, Bruzual 2002, Bruzual & Charlot 2003). The increase in the scatter around the GC relationship toward lower central velocity dispersions may be due to the effects of poor IMF sampling – some of this scatter may also be due to the increased importance of external perturbations for low-mass clusters. However, for our extragalactic YMCs, these effects are likely minimally, if at all, important. Because of the current technical limitations, we can only obtain high-dispersion spectroscopy of the highest mass YMCs, which are expected to have well-sampled IMFs.
In summary, the most important internal factor affecting the accuracy of the luminosity evolution of our sample YMCs is related to the functional form of the IMF assumed when applying the evolutionary corrections. However, based on the apparent universality of the IMF in a wide variety of environments (see, e.g., the review by Gilmore 2001), using a single IMF description for the entire sample seems reasonable222We also note that the maximum differences in luminosity evolution of the IMFs presented in Fig. 2b from the youngest YMC age observed, at Myr, to 12 Gyr is mag. This is well within the uncertainties allowed for by using the boundary as our diagnostic, so that the use of a single IMF description for the full YMC sample seems justified. and has the potential to provide valuable and robust insights into the future fate of a given sample of YMCs.
4.2 Dynamical evolution
In the previous section, we quantified the uncertainties in the estimated luminosities our clusters would have at a fiducial, common age of 12 Gyr. Our estimates implicitly assumed that the tracks followed by clusters in the plane are determined only by stellar evolution, and thus neglected the role of dynamical evolution. In particular, the central velocity dispersion of the cluster was assumed to remain constant throughout the evolution. In fact, there are a number of competing factors that affect the evolution of the cluster velocity distribution. For example, mass loss from stellar evolution or due to tidal stripping by an external tidal field may reduce the overall velocity dispersion of the cluster, while the long-term evolution toward core collapse will tend to produce an increase in velocity dispersion in the central parts of the cluster. In addition, mass segregation of the more luminous (i.e., more massive) stars could potentially give rise to a fall in the measured central cluster dispersion as these stars will dominate the cluster light, and hence their smaller velocities will serve to reduce the observed dispersion in the core regions. On the other hand, mass segregation of binaries will tend to inflate the measured central velocity dispersion, as the orbital velocities will contribute to the observed cluster dispersion. -body simulations of star clusters are the most reliable way to study the combined effects of stellar and dynamical evolution (both internal and external) on cluster properties (e.g., Portegies Zwart 2002, Baumgardt & Makino 2003, Wilkinson et al. 2003, Dehnen et al. 2004). In this section, therefore, we present results from -body simulations, in order to quantify the likely evolution of a cluster in the plane.
The -body clusters presented in this section comprise two separate sets of models: (i) low-mass clusters from Wilkinson et al. (2003), with masses of about M⊙; (ii) intermediate-mass clusters with masses of about M⊙ from J. Hurley (priv. comm. and Hurley et al. 2005). All simulations were performed using the nbody4 code (Aarseth 1999) running on the GRAPE-6 special purpose computer boards (Makino 1997) at the Institute of Astronomy, Cambridge and the American Museum of Natural History, New York. nbody4 is a direct -body code, which incorporates stellar evolution routines based on parameterised functions (Hurley et al. 2001) to follow the evolution, on a star-by-star basis, of the single stars and binaries in the cluster. Given the realistic nature of the simulations, it is possible to analyse the model clusters in precisely the same way as observed clusters. The importance of studying simulated cluster evolution in terms of directly observable quantities has been emphasised by a number of authors (e.g., Wilkinson et al. 2003, Portegies Zwart 2001).
The relevant parameters of the simulated clusters are given in Table 2. More details can be found in Wilkinson et al. (2003) and Hurley et al. (2005). The stellar IMF of KTG93 was used to populate the mass spectrum of each cluster – lower and upper mass cut-offs of M⊙ and M⊙, respectively, were assumed. The low-mass cluster simulations were carried out in the external potential of a point mass of mass M⊙ and ran for between 1.3 and 2.1 Gyr, by which time each cluster had lost more than 75 per cent of its mass. Two of the intermediate-mass clusters (models Circ3 and Circ4) were evolved in a linearised approximation of the Milky Way disc potential at the position of the Sun: these clusters contained approximately per cent of their initial mass after Gyr. Model Circ5, on the other hand, was placed on a circular orbit at a radius of kpc from a point mass of mass M⊙. This cluster had lost more than per cent of its mass when the simulation was stopped at Gyr. Thus, although the model clusters are necessarily less massive than the YMCs in the observational sample (due to computational constraints), they nevertheless span a range of masses, binary fractions, external potentials and orbits. Most importantly, the sample includes both clusters that disrupt rapidly and some that survive to late times, placing useful constraints on the expected evolution in the plane for clusters experiencing widely varying degrees of external perturbation.
In order to facilitate the comparison of the simulation results with the observed clusters, we need to estimate the central velocity dispersions and absolute magnitudes of the simulated clusters. The absolute magnitudes of the clusters were calculated simply by adding up the individual stellar luminosities of all the stars in each cluster. In order to reduce the numerical noise in the estimate of the velocity dispersions, the velocity dispersions were calculated for three perpendicular lines of sight and the results averaged. For each line of sight, the projected radius containing half the cluster light was calculated and only those stars that lay within this radius were included in the dispersion calculation. For binary stars, a random orientation was chosen for the binary orbit and we assumed that all binaries were observed at apocentre (where the stars spend most of their time). The relative motion of the stars in the frame of their centre-of-mass was calculated based on their masses and the semi-major axis and ellipticity of the orbit. The full space motions of the stars in the frame of the cluster were then calculated and the line-of-sight component of this motion was included in the cluster dispersion calculation.
In order to mimic the process by which a velocity dispersion is measured from the line widths in an integrated spectrum of an observed cluster, the distribution of line-of-sight velocities was fitted by a Gaussian of mean velocity and dispersion . For models Circ3, Circ4 and Circ5 we constructed a luminosity-weighted cumulative velocity distribution from the individual stellar velocities and luminosities, and found the Gaussian distribution whose cumulative distribution was a best fit in the least-squares sense. This procedure ensures that bright stars contribute more to the dispersion calculation than fainter stars, as is the case in real observations. As Boily et al. (2005) point out, it is essential to take account of this effect when comparing simulated and observed clusters. For models Circ1 and Ecc1, luminosity information was not available for the stars, and for model Circ2 the calculation produced unacceptably noisy results due to the small numbers of stars. For these models, therefore, stars of all masses were weighted equally. Their velocity evolution should therefore be taken as indicative only. In all cases, following the initial calculation of and , the estimates were refined by removing stars whose velocities were more than away from the mean of the sample and recalculating and . This process was repeated until removing further outliers had a negligible impact on the estimated dispersion. A direct calculation of the dispersion of line-of-sight velocities would be skewed by the presence of the highest-velocity binaries, whose orbital velocities greatly exceed the dispersion of the cluster, and which contribute non-Gaussian tails to the velocity distribution. Our procedure reduces their impact on the estimated dispersion in a manner consistent with observational techniques, which are generally insensitive to the presence of low-level, non-Gaussian tails such as those produced by binaries (see, e.g., Larsen et al. 2004). Generally, Gaussian fitting is used to determine the centre and FWHM of a spectral line, thereby ignoring any non-Gaussian tails which might indicate the presence of a binary population.
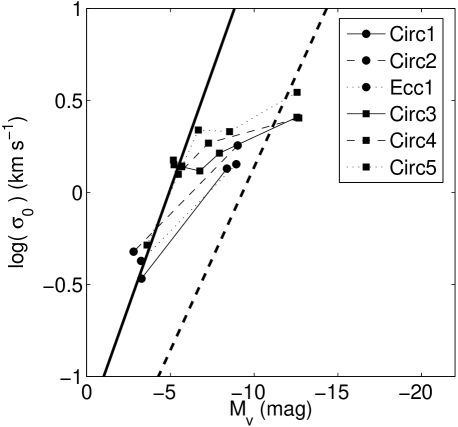
Figure 4 shows the evolution of our simulated clusters in the plane. For the low-mass clusters, results are presented for times and . For the intermediate-mass clusters, output times up to 12 Gyr are shown (with the exception of model Circ5, which was disrupted after 9 Gyr). There are several points to note from this figure. First, the evolution of for clusters which survive to late times (models Circ3 and Circ4) is quite limited, particularly for model Circ4, which contains a population of primordial binaries. For these models, the change in central velocity dispersion is dex over the course of 12 Gyr. Thus, our assumption that the evolution of the observed clusters in Fig. 1 is dominated by the evolution of their absolute magnitudes is reasonable333The additive effect of the evolution in on top of the luminosity evolution is that a few of our sample clusters deemed on the verge of disruption based on their evolution in luminosity alone, are now thought to evolve to more safe / stable loci inside the envelope. and therefore our conclusions based on that figure are unchanged. Figure 4 also shows that clusters that disrupt during the course of the simulations exhibit more significant evolution of . This emphasises the role of external factors in determining the late-time evolution of clusters in the plane. Thus, as we already made clear above, not all the YMCs in our sample that have the potential to survive to late times will necessarily do so if their external environment is too extreme.
Secondly, the presence of large numbers of binaries can significantly affect the observed velocity dispersion, especially at late times. As expected, binaries tend to inflate the velocity dispersion of the cluster, as a comparison of the evolution of models Circ2 and Circ4 (which contain primordial binaries) with that of models Circ1 and Circ3 (which initially contain only single stars) shows. The effect initially increases with time as mass segregation draws the binaries to the centre of the cluster due their larger masses, leading to an increased binary fraction in the central regions. Toward the end of the simulations, binary-single star encounters expel sufficient numbers of short-period binaries to move the observed dispersion toward that of the cluster without primordial binaries.
Finally, for all simulated clusters, decreases with time. Interestingly, this leaves the majority of our simulated clusters very close to the Local Group GC relation (shown as the solid line in Fig. 4). We will return to the significance of this fact in Section 5.2, where we will suggest that the evolution seen in this plot may also explain why the slope of the relation for the Local Group GCs is steeper than that observed for the youngest YMCs.
In summary, the results of -body simulations show that – for clusters in relatively quiescent environments – the tracks followed in the plane are broadly similar to those shown in Fig. 1. In fact, the evolution toward smaller seen in Fig. 4 suggests, that at late times the surviving YMCs will tend to lie closer to the Local Group GC relation than the YMCs aged to a fiducial age of 12 Gyr do in Fig. 1.
5 Discussion
5.1 Photometric versus dynamical mass estimates
Thus far, we have considered the location of our sample of extragalactic YMCs in the two-dimensional projection. However, for any virialised system, we can look for a fundamental plane akin to that of elliptical galaxies and spiral bulges, using size as a third parameter. If a cluster’s M/L ratio is constant across its volume, and the projected half-light radius satisfies (applicable for most realistic cluster profiles; Spitzer 1987) and therefore represents the half-mass radius, we can relate the cluster’s mass to its velocity dispersion via the virial theorem (Spitzer 1987):
| (3) |
Here, is the observed total velocity dispersion of the cluster.
In view of the uncertainties in the IMF discussed in the previous section, we have calculated the photometric masses of all of our sample clusters using four different IMF descriptions and SSP models computed for the relevant observational bandpasses. The results are presented in Table 3. Where available, uncertainties are based on the maximum uncertainties in the fundamental parameters determining the exact conversion from luminosities to masses (such as uncertainties in the YMC ages, photometry, or extinction values). We have also included in Table 3 previously published photometric mass estimates, as well as estimates of the clusters’ dynamical masses based on the observed velocity dispersions and half-light radii.
The nomenclature used for the mass estimators is of the form “SSP models”–“IMF prescription”, as explained in the text.
| Cluster | Ref. | GALEV–Salpeter | SB99–Salpeter | GALEV–KTG93 | GALEV–Kroupa01 | Ref. | ||
|---|---|---|---|---|---|---|---|---|
| (M⊙) | (M⊙) | |||||||
| Antennae-[WS95]331 | 16 | |||||||
| Antennae-[WS95]355 | 15 | |||||||
| Antennae-[W99]1 | 15 | |||||||
| Antennae-[W99]2 | 15 | |||||||
| Antennae-[W99]15 | 15 | |||||||
| Antennae-[W99]16 | 15 | |||||||
| Antennae-[M03] | 16 | |||||||
| IC 342-NC | 3 | |||||||
| M82-F | 20 | |||||||
| 13a | ||||||||
| 13a | ||||||||
| M82 MGG-9 | 12 | |||||||
| M82 MGG-11 | 12 | |||||||
| NGC 1042-NC | 1 | |||||||
| NGC 1487-1 | 16 | |||||||
| NGC 1487-2 | 16 | |||||||
| NGC 1487-3 | 16 | |||||||
| NGC 1569-A1 | 2 | 6 | ||||||
| 4 | ||||||||
| 5 | ||||||||
| NGC 1614-NC1 | ||||||||
| NGC 1614-NC2 | ||||||||
| NGC 1705-Ic | 14 | 7 | ||||||
| 17 | ||||||||
| 18 | ||||||||
| NGC 4214-10 | 9 | |||||||
| NGC 4214-13 | 9 | |||||||
| NGC 4449-27 | 9 | |||||||
| NGC 4449-47 | 9 | |||||||
| NGC 5236-502 | 10 | |||||||
| NGC 5236-805 | 10 | |||||||
| NGC 6946-1447 | 8 | 8,9 | ||||||
| NGC 7252-W3 | 11 | 11 | ||||||
Notes: a based on and -band spectroscopy (first and second line, respectively); b based on barycentric motions; if virialised; c The differences among the existing photometric mass estimates are mostly caused by varying distance estimates to the galaxy (Ho & Filippenko 1996b); d The photometric mass estimates are for a Kroupa01 and a Salpeter IMF, covering masses down to 0.1 M⊙ (first and second line, respectively). References: 1, this work, based on data from Böker et al. (2004, 2005); 2, Anders et al. (2004); 3, Böker et al. (1999); 4, de Marchi et al. (1997); 5, Gilbert & Graham (2001); 6, Ho & Filippenko (1996a); 7, Ho & Filippenko (1996b); 8, Larsen et al. (2001); 9, Larsen et al. (2004); 10, Larsen & Richtler (2004); 11, Maraston et al. (2004); 12, McCrady et al. (2003); 13, McCrady et al. (2005); 14, Melnick et al. (1985); 15, Mengel et al. (2002); 16, Mengel (2003); 17, Meurer et al. (1992); 18, Meurer et al. (1995); 19, Puxley & Brand (1999); 20, Smith & Gallagher (2001).
Figure 5 provides a projection of the “YMC fundamental plane” defined in the space of the YMCs’ luminosities, velocity dispersions and sizes. We show the distribution of our sample YMCs in the plane defined by the photometric vs. the dynamical mass estimates; the photometric mass estimates are based on converting the cluster luminosities to masses using the GALEV SSPs under the assumption of a Salpeter IMF from 0.1 to 100 M⊙. The solid line of equality represents the loci where our sample clusters would be found if they were characterised by this Salpeter IMF, and a constant M/L ratio throughout. The other lines, offset from the solid line, are calculated for the alternative IMFs considered for the photometric mass estimates listed in Table 3. We can conclude that most of our sample YMCs are scattered closely around the line of equality, which provides additional evidence that they are characterised by IMFs (or present-day MFs) similar to the standard Salpeter IMF. Only few objects, including the M82 clusters F and MGG-11, and NGC 1705-I, are found in the region where we expect to see the effects of either a low-mass cut-off or significant mass segregation. This lends support to McCrady et al.’s (2003, 2005) suggestion that these M82 clusters are affected by significant primordial mass segregation, and suggests a similar effect for NGC 1705-I. In this context, we note that the straightforward application of the virial theorem, Eq. (3), which is based on a single-mass model for all stars contained in the system, tends to underestimate a system’s dynamical mass by a factor of compared to more realistic multi-mass models (e.g., Mandushev et al. [1991], based on an analysis of the observational uncertainties). This effect potentially reduces the number of clusters in Fig. 5 scattered toward MFs defined by low-mass cut-offs or YMCs dominated by significant mass segregation even further.

5.2 Implications
The origin of the tight relationship between the absolute magnitude and central velocity dispersion for all Local Group GCs remains an unsolved puzzle. Djorgovski (1991, 1993; see also Djorgovski & Meylan 1994) suggested that the relation evolved from a primordial scaling relation, (assuming a constant M/L ratio among GCs), which would be subsequently altered by tidal shocks, leading to mass (and therefore luminosity) losses. This would be more efficient for the less massive clusters, thus resulting in a steepening of the relationship to its currently observed form. McLaughlin (2003) suggests that the relation is linked to the mass-dependent star-formation efficiencies in giant molecular clouds, the progenitors of star clusters. We note that the fact that all Local Group GCs are found scattering closely around the relationship implies that its origin must be related to GC-internal processes. The tightness of the relationship rules out significant environmental effects as principal cause for its origin. This is simply because the Local Group GCs are found in a wide variety of environments, ranging from the high-density environments in the Galaxy and M31, via the intermediate density operating in M33, to the (very) low density environments in the dwarf satellite galaxies (LMC, SMC, Fornax dSph). A similar conclusion was reached by McLaughlin (2000a) when he noted that Galactic GCs at larger Galactocentric distances exhibit a smaller scatter about the relationship than those closer to the Milky Way.
The fact that we find that our sample YMCs, when evolved to a common age of 12 Gyr using the Salpeter IMF, may also evolve to loci close to the best-fitting GC relationship implies that the initial conditions governing these YMC must have been very similar to those responsible for the formation of the old Local Group GCs. This, therefore, provides an argument in favour of the suggestion that most of these YMCs may in fact be proto-GCs. It also suggests that a large number of the present-day young compact LMC (and SMC) clusters, as well as the large majority of the Galactic open clusters, all of which are currently found to occupy regions close to the old GC relationship (in some cases further toward fainter magnitudes than any of the known GCs, for a given central velocity dispersion), are unlikely to survive until they reach GC-type ages of Gyr.
Thus far, we have been dealing predominantly with internal cluster processes that might prevent (a number of) the YMCs from surviving for a Hubble time. The most likely internal processes leading to cluster disruption were found to be related to variations in the IMF. However, we note that our predictions for the future fate of our sample clusters should only be adopted as first-order approximations. Until now, we have only mentioned external disruptive effects in passing, and have assumed our clusters to reside in quiescent galactic disc environments. This assumption is clearly not justified in a number of cases considered in this paper.
One should realise that star cluster survivability also – and crucially so – depends on external factors affecting its stellar content, such as tidal shocking by galactic discs, bulges, spiral arms and giant molecular clouds (GMCs), and the associated ram-pressure stripping. These external effects will accelerate the cluster disruption time-scale relative to that caused by cluster-internal effects.
In a recent study, Boutloukos & Lamers (2003) derived an empirical expression for the “characteristic” cluster disruption time-scale (i.e., the time-scale on which a M⊙ cluster will dissolve, assuming instantaneous disruption), and found that – for a given cluster system and environment – this time-scale is entirely dependent on the initial mass of the cluster, as (see also Lamers, Gieles & Portegies Zwart 2005, who confirmed this prediction using N-body simulations). Boutloukos & Lamers (2003) derived characteristic cluster disruption time-scales for the cluster systems in the solar neighbourhood, the SMC, and in selected regions of M33 and the interacting galaxy M51. In de Grijs et al. (2003a,c), we extended this sample to include the fossil starburst region M82 B, and the interacting systems NGC 3310 and NGC 6745.
In de Grijs et al. (2003c), we concluded that the very short characteristic cluster disruption time-scale for the clusters in M82 B is most likely caused by the very high ambient density of its interstellar medium (ISM), leading to cluster disruption on similarly short time-scales as in the high-density centre of M51.444For counterarguments see Mengel et al. (2002), who explained the unusual M/L ratios found for the YMCs in the overlap region between the merging galaxies in the Antennae system by suggesting that higher ambient pressures might be conducive to the formation of more low-mass stars, leading to more stable clusters.
If we place our own results in this context, we see that four of the six clusters that are expected to evolve to beyond the boundary by an age of 12 Gyr are in fact located in the high-density overlap region in the Antennae galaxies. We would expect these objects to dissolve on shorter-than-average time-scales, simply because of the higher density ISM in which they are embedded, and because of the high pressure and tidal shocks expected in the ongoing merger. Similarly, the remaining two objects (NGC 1487-3 and IC 342-NC) are located in high-density galactic centre environments. By the same token, NGC 1487-1 and 2, and NGC 5236-805 are located in similarly high-density environments; their luminosity evolution arrows do, in fact, overshoot the envelope. This is supported by a recent study by Lamers et al. (2005), based on numerical simulations. We caution that the results for the NGC 1487 clusters should be treated with caution in view of the large photometric uncertainties caused by the passband conversion applied. However, if we take the evolution of the central velocity dispersion into account, all of these objects may well evolve to loci within the boundary by the time they age to 12 Gyr.
If we assume that the initial MF of all of these objects was roughly constant for the entire YMC sample, this implies that tidal effects and their location in regions of higher-than-average density must have affected the stellar content of these clusters already on time-scales as short of yr, i.e., a significant fraction of the low-mass stars in these objects has likely been tidally stripped already during their very short lifetimes. Ongoing tidal effects would lead to luminosity evolution to still fainter magnitudes than implied by assuming a Salpeter-type IMF.
Now that we have established that a number of our sample clusters are already likely to have been affected significantly by tidal effects and externally induced disruption, despite their young ages, we return to the origin of the tight GC relation. With the remainder of our sample YMCs, except the most massive objects that may be governed by the FJ relation rather than the old GC correlation, we can now test the suggestion by Djorgovski (1991, 1993) and Djorgovski & Meylan (1994) that at the time of proto-globular cluster formation the clusters’ (central) velocity dispersion correlated linearly with their luminosity. For the following arguments, one needs to keep in mind that we have shown (i) that the remainder of our YMC sample shows behaviour consistent with their stellar content being described by a Salpeter-type present-day (and presumably initial) MF (assuming that they are to obey the relationship at old age), (ii) that all of these clusters are likely governed by a very similar IMF, and (iii) that they are possible GC progenitors, in the absence of significant external disruptive processes.
With this picture in mind, we can now evolve the present-day luminosities of these YMCs back to a common age corresponding to the youngest age found in this cluster sample, i.e., 8 Myr, again using the GALEV SSPs with a standard Salpeter IMF. We show the results of this exercise in Fig. 6.

For the first time, we can now assess the almost-initial conditions of proto-GCs in our diagnostic diagram. The best-fitting (dashed) relationship corresponds to
| (4) |
or
| (5) |
with correlation coefficient , when expressed in logarithmic units. This result excludes a linear relation at the level. The exact relationship is somewhat dependent on the exact functional form of the IMF adopted. For instance, if we had adopted a Kroupa01 IMF, the exponents in Eq. (4) and (5) would have been and , respectively.
This relation can be understood in terms of the state of equilibrium of the observed clusters. For a cluster in virial equilibrium we have (see, e.g., Binney & Tremaine 1987)
| (6) |
assuming that the cluster has a constant M/L ratio, . Thus, the observed relation for the youngest YMCs has exactly the form expected for clusters in virial equilibrium, provided that (i) the cluster radii are independent of their luminosities, (ii) the cluster radii have not changed significantly since the clusters were Myr old, and (iii) the ratio of central velocity dispersion to the total cluster dispersion is independent of luminosity. With regard to the first point, McLaughlin (2000a) found that the half-light radii of the Milky Way clusters are indeed independent of their total masses. Similarly, Harris et al. (2002) found no significant correlation between cluster sizes and their absolute magnitudes in a sample of clusters surrounding the giant elliptical galaxy NGC 5128, and neither did we find any such correlation between the half-light radii and absolute magnitudes of our Local Group GC sample. Note that in the -body simulations presented in Section 4.2 the low-mass clusters were systematically smaller in radius than the more massive clusters, which is why the simulated low-mass clusters do not lie on the young YMC relation (see Fig. 4). The half-light radius of a cluster is most significantly affected by the expulsion of gas immediately following the end of star formation, which results in the expansion of the cluster by up to a factor of (Boily & Kroupa 2003, Goodwin 1997b). Bound clusters rapidly re-establish equilibrium. It is therefore reasonable to expect that the half-light radii have not evolved significantly since an age of 8 Myr – even if some of the clusters have expanded since that time, Eq. (6) shows that the magnitude of this effect will be less than 0.35 dex in . Finally, the absence of significant luminosity dependence of the ratio of central to total cluster velocity dispersions is expected for clusters in equilibrium. Fig. 6 is thus consistent with the youngest YMCs having rapidly achieved virial equilibrium. In order to strengthen this result, it would be interesting to use accurate determinations of cluster radii to confirm the independence of the cluster sizes and luminosities in the extragalactic YMC sample.
The simple, virial relation for the youngest clusters in our YMC sample may be the pre-cursor for the fundamental plane of globular clusters. Clearly, quiescent evolution would be expected to transform a primordial linear relation into another linear relation since two clusters which are initially close together in the plane will evolve similarly provided their external environments do not differ too greatly. The change in the slope of the relation is then probably due to the dependence of the evolution on the mass of the cluster. The increased relaxation time of more massive clusters would be expected to lead to less evolution in these clusters than is seen in the lower mass clusters; we also note that the amount of luminosity evolution is driven by relative age differences and, to first order, independent of a cluster’s initial luminosity. This would naturally account for the steeper slope of the late-time relation seen for the Local Group GCs. Further numerical simulations are required to confirm that this picture is consistent in all respects with the observations.
6 Summary and conclusions
In this paper, we have presented a new analysis of the properties and possible evolutionary paths of the YMCs forming profusely in intense starburst environments, such as those associated with galaxy interactions and mergers. The method hinges on the empirical relationship for old Galactic and M31 GCs, which occupy a tightly constrained locus in the plane defined by their -band luminosities, (or, equivalently, absolute magnitudes, ) and central velocity dispersions, (Djorgovski et al. 1997, McLaughlin 2000a, and references therein).
We added to the Galactic and M31 GC sample the old compact Magellanic Cloud clusters, and the M33 and Fornax dSph GCs for which the relevant observational parameters were available in the literature. The relationship between and for this increased GC sample, (km s-1), is within the uncertainties consistent with Djorgovski et al.’s (1997) determination for the smaller Galactic and M31 GC sample. The tightness of the relationship for a sample drawn from environments as diverse as those found in the Local Group, ranging from high to very low ambient densities, implies that its origin must be sought in intrinsic properties of the GC formation process itself, rather than in external factors. This is further supported by McLaughlin’s (2000a) result that GCs at greater Galactocentric distances exhibit a smaller scatter about the relation than closer objects.
Encouraged by the tightness of the GC relationship, we also added the available data points for the YMCs in the local Universe, including nuclear star clusters, for which velocity dispersion information was readily available. In order to be able to compare them to the ubiquitous old Local Group GCs, we evolved their luminosities to a common age of 12 Gyr, adopting the “standard” (solar neighbourhood) Salpeter IMF covering masses from 0.1 to 100 M⊙, and assuming stellar evolution as described by the GALEV SSPs. Based on a careful assessment of the uncertainties associated with this luminosity evolution, we concluded that the most important factor affecting the robustness of our conclusions is the adopted form of the stellar IMF.
We found that if we adopt the Salpeter IMF as the basis for the YMCs’ luminosity evolution, the large majority will evolve to loci within twice the observational scatter around the best-fitting GC relationship (although systematically to somewhat fainter luminosities). Using more realistic IMF descriptions, our YMC sample do, in fact, end up scattering more closely about the improved Local Group GC relationship. In the absence of significant external disturbances, this implies that these objects may potentially survive to become old GC-type objects by the time they reach a similar age. Thus, these results provide additional support to the suggestion that the formation of proto-GCs appears to be continuing until the present, a conclusion we reached independently based on the statistical treatment of the Gyr-old intermediate-age star cluster system in M82’s fossil starburst region B (de Grijs et al. 2003b). Detailed case by case comparisons between our results based on this new method with those obtained previously and independently based on dynamical mass estimates and M/L ratio considerations lend significant support to the feasibility and robustness of our new method, and provide a key insight into the inherent uncertainties associated with any of the methods used in this field. The key characteristic and main advantage of this method compared to the more complex analysis involved in using dynamical mass estimates for this purpose is its simplicity and empirical basis. Where dynamical mass estimates require one to obtain accurate size estimates and to make assumptions regarding a system’s virialised state and M/L ratio, these complications can now be avoided by using the empirically determined GC relationship as reference. The only observables required are the system’s (central or line-of-sight) velocity dispersion and photometric properties. McLaughlin (2000a) has shown that this is, in fact, a physically relevant correlation, since (i) the diagram (where is the cluster binding energy) is composed of physically meaningful quantities, and (ii) the scatter about the correlation is of the same order as the observational uncertainties.
Careful analysis of those YMCs that would overshoot the GC relationship significantly if they were to survive for a Hubble time (and are characterised by a Salpeter-type initial or present-day MF) showed that their unusually high ambient density has probably already had a significant effect on their stellar content, despite their young ages, thus altering their present-day MF in a such a way that they have become unable to survive for any significant length of time. This is, again, supported by independent analyses, thus further strengthening the robustness of our new approach. The expected loci in the plane that these objects would evolve to over a Hubble time are well beyond any GC luminosities for a given velocity dispersion, leading us to conclude that they will either dissolve long before reaching GC-type ages, or that they must be characterised by a present-day MF that is significantly depleted in low-mass stars (or highly mass segregated), thus also resulting in fast dispersion. This, therefore, allows us to place moderate limits on the functionality of their present-day MFs.
In order to investigate whether dynamical evolution would have a dramatic impact on the evolution of clusters in the plane, we analysed the results of a number of -body simulations. The velocity dispersions of the model clusters were calculated in a manner analogous to that used for the observed clusters. We concluded that the evolution of the observed is relatively small for clusters that survive to old age, and thus our conclusions remain unchanged.
Based on our analysis of the objects with the largest velocity dispersions, including the nuclear star clusters, we conclude that the recently discovered UCDs in the Fornax cluster may be most closely related to stripped dSph or dE nuclei. We also show that the unusual Galactic GC NGC 2419 is unlikely to be a similar type of object, despite recent suggestions to the contrary.
Finally, we evolved those YMCs that appear to be least affected by external disruptive effects and are likely to be well-represented by Salpeter-type IMFs back to a common young age of 8 Myr, in order to assess the relationship in almost-initial conditions. The resulting best-fitting relationship, (km s-1), implies that these clusters follow a simple virial relation. The evolution of relatively undisturbed star clusters in the plane, as seen in our -body simulations, will subsequently transform this relation into the steeper relation displayed by the Local Group GCs. The existence of a simple, virial relationship for the youngest YMCs may therefore constitute the origin of the GC fundamental plane.
Acknowledgments
RdG acknowledges the stimulating atmosphere at the 2004 Guillermo Haro workshop at INAOE, Tonantzintla, Mexico, during which much of this work was done; he also thanks the Royal Society for providing travel funding to attend this workshop. We are very grateful to Jarrod Hurley for providing us with data from his -body simulations in advance of publication. We thank Peter Anders for re-calculating his GALEV SSP models for the range of IMF representations discussed in this paper, and acknowledge stimulating discussions with Roberto Terlevich and Jay Gallagher, and a number of insightful comments by the anonymous referee. MIW thanks Gijs Nelemans for valuable discussions and PPARC for financial support. This research has made use of the SIMBAD database, operated at CDS, Strasbourg, France, and of the WEBDA database maintained by Jean-Claude Mermilliod at http://obswww.unige.ch/webda/.
References
- [] Aarseth S.J., 1999, PASP, 111, 1333
- [] Agüero E.L., Paolantonio S., 1997, AJ, 114, 102
- [] Aitken D.K., Roche P.F., Phillips M.M., 1981, MNRAS, 196, 101P
- [] Aloisi A., Clampin M., Diolaiti E., Greggio L., Leitherer C., Nota A., Origlia L., Parmeggiani G., Tosi M., 2001, AJ, 121, 1425
- [] Anders P., de Grijs R., Fritze–v. Alvensleben U., Bissantz N., 2004, MNRAS, 347, 17
- [] Anders P., Fritze–v. Alvensleben U., 2003, A&A, 401, 1063
- [] Baumgardt H., Makino, J., 2003, MNRAS, 340, 227
- [] Bica E., Clariá J.J., Dottori H., Santos Jr. J.F.C., Piatti A.E., 1996, ApJS, 102, 57
- [] Binney J., Tremaine S., 1987, Galactic dynamics, Princeton University Press, Princeton, NJ
- [] Boily C.M., Lançon A., Deiters S., Heggie D.C., 2005, ApJ, 620, L27 (astro-ph/0502530)
- [] Böker T., Sarzi M., McLaughlin D.E., van der Marel R.P., Rix H.-W., Ho L.C., Shields J.C., 2004, AJ, 127, 105
- [] Böker T., van der Marel R.P., Vacca W.D., 1999, AJ, 118, 831
- [] Böker T., Walcher C.-J., Rix H.-W., Häring N., Schinnerer E., Sarzi M., van der Marel R.P., Ho L.C., Shields J.C., Lisenfeld U., Laine S., 2005, in Massive Young Clusters, ASP Conf. Ser., Lamers H.J.G.L.M., Smith L.J., Nota A., eds., ASP: San Francisco, p. 39
- [] Boily, C.M., Kroupa, P., 2003, MNRAS, 338, 673
- [] Bonoli F., Delpino F., Federici L., Fusi Pecci F., 1987, A&A, 185, 25
- [] Boutloukos S.G., Lamers H.J.G.L.M., 2003, MNRAS, 338, 717
- [] Bruzual A.G., 2002, in Extragalactic Star Clusters, IAU Symp. 207, Geisler D., Grebel E., Minniti D., eds., (ASP: San Francisco), p. 616
- [] Bruzual A.G., Charlot S., 2003, MNRAS, 344, 1000
- [] Carlson M.N., et al., 1998, AJ, 115, 1778
- [] Cid Fernandes R., et al., 2004, ApJ, 605, 105
- [] Conti P.S., Leitherer C., Vacca W.D., 1996, ApJ, 461, L87
- [] Crampton D., Cowley A.P., Schade D., Chayer P., 1985, ApJ, 288, 494
- [] de Freitas Pacheco J.A., Barbuy B., Idiart T., 1998, A&A, 332, 19
- [] de Grijs R., O’Connell R.W., Gallagher J.S., 2001, AJ, 121, 768
- [] de Grijs R., Gilmore G.F., Johnson R.A., Mackey A.D., 2002a, MNRAS, 331, 245
- [] de Grijs R., Gilmore G.F., Mackey A.D., Wilkinson M.I., Beaulieu S.F., Johnson R.A., Santiago B.X., 2002b, MNRAS, 337, 597
- [] de Grijs R., Anders P., Lynds R., Bastian N., Lamers H.J.G.L.M., Fritze–v. Alvensleben U., 2003a, MNRAS, 343, 1285
- [] de Grijs R., Bastian N., Lamers, H.J.G.L.M., 2003b, ApJ, 583, L17
- [] de Grijs R., Bastian N., Lamers H.J.G.L.M., 2003c, MNRAS, 340, 197
- [] de Grijs R., Fritze–v. Alvensleben U., Anders P., Gallagher J.S., Bastian N., Taylor V.A., Windhorst R.A., 2003d, MNRAS, 342, 259
- [] de Grijs R., Lee J.T., Mora Herrera M.C., Fritze–v. Alvensleben U., Anders P., 2003e, New Astron., 8, 155
- [] Dehnen W., Odenkirchen M., Grebel E.K., Rix H., 2004, AJ, 127, 2753
- [] De Marchi G., Clampin M., Greggio L., Leitherer C., Nota A., Tosi M., 1997, ApJ, 479, L27
- [] Devost D., Roy J.-R., Drissen L., 1997, ApJ, 482, 765
- [] Djorgovski S., 1991, in The formation and evolution of star clusters, ASP Conf. Ser., Vol. 13, Janes K., ed., (ASP: San Francisco), p. 112
- [] Djorgovski S., 1993, in The Globular Cluster-Galaxy Connection, ASP Conf. Ser. Vol. 48, Smith H., Brodie J.P., eds., (ASP: San Francisco), p. 496
- [] Djorgovski S.G., Gal R.R., McCarthy J.K., Cohen J.G., de Carvalho R.R., Meylan G., Bendinelli O., Parmeggiani G., 1997, ApJ, 474, L19
- [] Djorgovski S., Meylan G., 1994, AJ, 108, 1292
- [] Drinkwater M.J., Gregg M.D., Hilker M., Bekki K., Couch W.J., Ferguson H.C., Jones J.B., Phillipps S., 2003, Nat, 423, 519
- [] Drinkwater M.J., Jones J.B., Gregg M.D., Phillipps S., 2000, PASA, 17, 227
- [] Dubath P., Grillmair C.J., 1997, A&A, 321, 379
- [] Dubath P., Mayor M., Meylan G., 1993, in The Globular Cluster-Galaxy Connection, ASP Conf. Ser. Vol. 48, Smith H., Brodie J.P., eds., (ASP: San Francisco), p. 557
- [] Dubath P., Meylan G., Mayor M., 1992, ApJ, 400, 510
- [] Dubath P., Meylan G., Mayor M., 1997, A&A, 324, 505
- [] Efremov Yu.N., Pustilnik S.A., Kniazev A.Y., Elmegreen B.G., Larsen S.S., Alfaro E.J., Hodge P.W., Pramsky A.G., Richtler T., 2002, A&A, 389, 855
- [] Freedman W., et al., 1994, ApJ, 427, 628
- [] Gilbert A.M., Graham J.R., , 2002, in Extragalactic Star Clusters, IAU Symp. 207, Geisler D., Grebel E.K., Minniti D., eds., (ASP: San Francisco), p. 471
- [] Gilmore G., 2001, in Starburst Galaxies: Near and Far, Tacconi L., Lutz D., eds., (Spinger: New York), p. 34
- [] Gnedin O.Y., Ostriker J.P., 1997, ApJ, 474, 223
- [] Gnedin O.Y., Zhao H., Pringle J.E., Fall S.M., Livio M., Meylan G., 2002, ApJ, 568, L23
- [] Goodwin S.P., 1997a, MNRAS, 286, 669
- [] Goodwin, S.P., 1997b, MNRAS, 284, 785
- [] Greggio L., Tosi M., Clampin M., de Marchi G., Leitherer C., Nota A., Sirianni M., 1998, ApJ, 504, 725
- [] Harris W.E., 1996, AJ, 112, 1487
- [] Harris W.E., Harris G.L.H., Holland S.T., McLaughlin D.E., 2002, AJ, 124, 1435
- [] Hilker M., Infante L., Vieira G., Kissler-Patig M., Richtler T., 1999, A&AS, 134, 75
- [] Ho L.C., Filippenko A.V., 1996a, ApJ, 466, L83
- [] Ho L.C., Filippenko A.V., 1996b, ApJ, 472, 600
- [] Holtzman J.A., et al., 1992, AJ, 103, 691
- [] Hurley J.R., Tout C.A., Aarseth S.J., Pols O.R., 2001, MNRAS, 323, 630
- [] Hurley J.R., et al., 2005, MNRAS, in prep.
- [] Kobulnicky H. A., Skillman E. D., 1997, ApJ, 489, 636
- [] Kroupa P., 2001, MNRAS, 322, 231 (Kroupa01)
- [] Kroupa P., Tout C.A., Gilmore G.F., 1993, MNRAS, 262, 545
- [] Lamers H.J.G.L.M., Gieles M., Portegies Zwart S.F., 2005, A&A, 429, 173
- [] Lançon A., Mouhcine M., 2000, in Massive Stellar Clusters, ASP Conf. Ser., Vol. 211, Lançon A., Boily C., eds., (ASP: San Francisco), p. 34
- [] Larsen S.S., Brodie J.P., Elmegreen B.G., Efremov Y.N., Hodge P.W., Richtler T., 2001, ApJ, 556, 801
- [] Larsen S.S., Brodie J.P., Hunter D.A., 2004, AJ, 128, 2295
- [] Larsen S.S., Brodie J.P., Sarajedini A., Huchra J.P., 2002, AJ, 124, 2615
- [] Larsen S.S., Richtler T., 2004, A&A, 427, 495
- [] Leitherer C., Schaerer D., Goldader J.D., González Delgado R.M., Robert C., Kune D.F., de Mello D.F., Devost D., Heckman T.M., 1999, ApJS, 123, 3 (Starburst99)
- [] Lohmann W., 1972, AN, 293, 259
- [] Madore B.F., Freedman W.L., 1992, PASP, 104, 362
- [] Makino J., Taiji M., Ebisuzaki T., Sugimoto D., 1997, ApJ, 480, 432
- [] Mandushev G., Spassova N., Staneva A., 1991, A&A, 252, 94
- [] Maraston C., Bastian N., Saglia R.P., Kissler-Patig M., Schweizer F., Goudfrooij P., 2004, A&A, 416, 467
- [] Maraston C., Kissler-Patig M., Brodie J.P., Barmby P., Huchra J.P., 2001, A&A, 370, 176
- [] McCall M.L., 1989, AJ, 97, 1341
- [] McCrady N., Gilbert A.M., Graham J.R., 2003, ApJ, 596, 240
- [] McCrady N., Graham J.R., Vacca W.D., 2005, ApJ, 621, 278
- [] McLaughlin D.E., 2000a, ApJ, 539, 618
- [] McLaughlin D.E., 2000b, in Massive Stellar Clusters, ASP Conf. Ser., Vol. 211, Lançon A., Boily C., eds., (ASP: San Francisco), p. 281
- [] McLaughlin D.E., 2003, in Extragalactic globular cluster systems, ESO Astrophysics Symposia, Kissler-Patig M., ed., Springer: Berlin, p. 329
- [] Melnick J., Moles M., Terlevich R., 1985, A&A, 149, L24
- [] Mengel S., 2003, in Stellar Populations 2003 (http://www.mpa-garching.mpg.de/stelpops/)
- [] Mengel S., Lehnert M.D., Thatte N., Genzel R., 2002, A&A, 383, 137
- [] Mengel S., Lehnert M.D., Thatte N., Tacconi-Garman E., Genzel R., 2001, ApJ, 550, 280
- [] Meurer G.R., 1995, Nat., 375, 742
- [] Meurer G.R., Freeman K.C., Dopita M.A., Cacciari C., 1992, AJ, 103, 60
- [] Meurer G.R., Heckman T.M., Leitherer C., Kinney A., Robert C., Garnett D.R., 1995, AJ, 110, 2665
- [] Meylan G., Mayor M., 1986, A&A, 166, 122
- [] Meylan G., Mayor M., Duquennoy A., Dubath P., 1995, A&A, 303, 761
- [] Meylan G., Sarajedini A., Jablonka P., Djorgovski S.G., Bridges T., Rich R.M., 2001, AJ, 122, 830
- [] O’Connell R.W., Gallagher J.S., Hunter D.A., 1994, ApJ, 433, 65
- [] Olszewski E.W., Pryor C., Shommer R.B., 1993, in The Globular Cluster-Galaxy Connection, ASP Conf. Ser., Vol. 48, Smith G.H., Brodie J.P., eds., (ASP: San Francisco), p. 99
- [] Origlia L., Leitherer C., Aloisi A., Greggio L., Tosi M., 2001, AJ, 122, 815
- [] Paturel G., Garnier R., 1992, A&A, 254, 93
- [] Portegies Zwart S.F., McMillan S.L.W., Hut P., Makino J., 2001, MNRAS, 321, 199
- [] Portegies Zwart S.F., Makino J., McMillan S.L.W., Hut P., 2002, ApJ, 565, 265
- [] Pryor C., Meylan G., 1993, in Structure and Dynamics of Globular Clusters, ASP Conf. Ser. Vol. 30, Djorgovski S.G., Meylan G., eds., (ASP: San Francisco), p. 357
- [] Puxley P.J., Brand P.W.J.L., 1999, ApJ, 514, 675
- [] Reed L.G., Harris G.L.H., Harris W.E., 1994, AJ, 107, 555
- [] Sagar R., Bhatt H.C., 1989, MNRAS, 236, 865
- [] Salpeter E.E., 1955, ApJ, 121, 161
- [] Scalo J. M., 1986, Fundam. Cosm Phys. 11, 1
- [] Schlegel D.J., Finkbeiner D.P., Davis M., 1998, ApJ, 500, 525
- [] Schulz J., Fritze–v. Alvensleben U., Möller C.S., Fricke K.J., 2002, A&A, 392, 1
- [] Schweizer F., Seitzer P., 1998, AJ, 116, 2206
- [] Smith L.J., Gallagher J.S., 2001, MNRAS, 326, 1027
- [] Spitzer L., 1987, Dynamical Evolution of Globular Clusters, Ostriker J.P., ed., (Princeton Univ. Press: Princeton), p. 11
- [] Tosi M., Díaz A.I., 1985, MNRAS, 217, 571
- [] van den Bergh S., 1995, Nat., 374, 215
- [] van den Bergh S., Mackey A.D., 2004, MNRAS, 354, 713
- [] Vázquez G.A., Leitherer C., Heckman T.M., Lennon D.J., de Mello D.F., Meurer G.R., Marin C.L., 2004, ApJ, 600, 162
- [] Verma A., Lutz D., Sturm E., Sternberg A., Genzel R., Vacca W., 2003, A&A, 403, 829
- [] Walcher C.J., Häring N., Böker T., Rix H.-W., van der Marel R.P., Gerssen J., Ho L., Shields J., 2004, in Carnegie Observatories Astrophysics Series, Vol. 1: Coevolution of Black Holes and Galaxies, Ho L.C., ed., (Carnegie Observatories: Pasadena), in press
- [] Watson A.M., et al., 1996, AJ, 112, 534
- [] Whitmore B.C., Schweizer F., Leitherer C., Borne K., Robert C., 1993, AJ, 106, 1354
- [] Whitmore B.C., Schweizer F., 1995, AJ, 109, 960 (WS95)
- [] Whitmore B.C., Zhang Q., Leitherer C., Fall S.M., Schweizer F., Miller B.W., 1999, AJ, 118, 1551 (W99)
- [] Wilkinson M.I., Hurley J.R., Mackey A.D., Gilmore G.F., Tout C.A., 2003, MNRAS, 343, 1025