The core of the Canis Major galaxy as traced by Red Clump stars
Abstract
The recently-discovered stellar system in Canis Major is analysed using He-burning Red Clump stars as tracers. Canis Major turns out to be the strongest and most spatially confined overdensity of the whole Galactic Disc, both in terms of number density and of statistical significance. When projected onto the Galactic Plane, it appears as an elongated and compact overdensity extending from to with a roundish core toward . We find that the main body of the system has an integrated absolute magnitude , a central surface brightness mag/arcsec2 and a line-of-sight profile peaked at with Half Width at Half Maximum , in excellent agreement with the results obtained with widely different tracers (M giants and Main Sequence stars) in previous analyses. The mean distance to the main body of Canis Major is observed to increase with increasing Galactic longitude, from at , to at , in good agreement with the predictions of our more recent N-body simulation that models CMa as a dwarf galaxy being accreted in a planar orbit onto the disc of the Milky Way. We confirm that the Canis Major system has all the characteristics of the relic of a dwarf galaxy seen on top of a large-scale overdensity that we detect all over the third and fourth Galactic quadrants (, with a strong maximum around and ) that is identified as the stellar component of the southern Galactic Warp. On the other hand, the possibility that a peculiar deformation/asymmetry of the outer Galactic Disc may be at the origin of the observed distribution of overdensities toward CMa cannot be definitely ruled out with the data presented in this paper. We also address a recent claim that Canis Major is on the outskirts of a larger “Argo” structure centred at . Our analysis shows that the stellar populations in the latter are distributed over a very large distance range along the line of sight, and do not give rise to a narrow peak in density in this direction, contrary to what is observed in Canis Major. This suggests that the Argo structure is likely due to Galactic asymmetries such as the Warp.
keywords:
Galaxy: structure - galaxies: dwarf - open clusters: general - open clusters: individual: Tombaugh 2, AM-2, Heffner 111 Introduction
During the last decade, it has been fully realised that the relics of the latest accretion events that contributed to the assembly of the Milky Way can be observationally identified and studied in detail (see, for example Ibata et al., 2001; Newberg et al., 2002; Majewski et al., 2003, and references therein). These findings simultaneously provide a qualitative confirmation and a new challenge for the current cosmological models in which the growth of large galaxies is driven by the process of hierarchical merger of sub-units (White & Rees, 1978; White & Frenk, 1991). The tidal disruption of dwarf galaxies within the Galactic potential may lead to the production of long-lived stellar streams (as in the case of the dwarf spheroidal Sagittarius galaxy - Sgr dSph, see Ibata & Lewis, 1998; Ibata et al., 2001, 2002; Ivezic et al., 2000; Newberg et al., 2002; Majewski et al., 2003; Bellazzini, Ferraro & Ibata, 2003a) that may reveal fundamental information about the process of disruption, the mass distribution within the Galactic halo of Dark Matter, its degree of clumpiness, etc. (see Ibata et al., 2001; Helmi, 2004; Johnston, Law & Majewski, 2005; Law, Johnston & Majewski, 2005).
The recent discovery of a large stellar stream nearly coplanar with the Galactic disc (the Canis Major/Monoceros Ring, hereafter the Ring, for brevity Newberg et al., 2002; Yanny et al., 2003; Ibata et al., 2003; Majewski et al., 2003; Rocha-Pinto et al., 2003; Crane et al., 2003; Conn et al., 2005a, b) suggests that the accretion of small stellar systems may have had a considerable rôle also in the assembly of the disc components of the Milky Way (in particular, the Thick Disc) as envisaged by the latest detailed models of disc-galaxy formation within a cosmological context (Abadi et al., 2003a, b; Helmi et al., 2003).
In Martin et al. (2004a, hereafter Pap-I) we reported on the identification of a possible new stellar relic (the Canis Major dwarf galaxy, hereafter CMa) located at from the Sun whose approximate centre lies around , and that may be the progenitor of the Ring (see also Penarrubia et al., 2005; Dinescu et al., 2005). CMa was identified as a strong elliptical-shaped overdensity of M-giants by the comparison of star counts in Northern and Southern Galactic hemispheres (from the 2MASS All Sky Survey, Cutri et al., 2003). The structure was suggested to be possibly associated with some globular (but see Penarrubia et al., 2005; Martinez-Delgado et al., 2005b) and open clusters (Martin et al., 2004a; Bellazzini et al., 2004a; Crane et al., 2003). The relic appears to have luminosity and size similar to the Sgr dSph (Pap-I). The optical Color Magnitude Diagram (CMD) we obtained in Bellazzini et al. (2004a, hereafter Pap-II) revealed a narrow and well-defined Main Sequence typical of an intermediate to old (age Gyr) and moderately metal deficient () stellar system; these results have been fully confirmed by the deeper CMD presented by Martinez-Delgado et al. (2005a). A Blue Plume of possibly young stars or blue stragglers - also typical of dwarf spheroidal galaxies - has been detected in both optical CMDs. Carraro et al. (2005) detected the Blue Plume population in the background of several open clusters in the third Galactic quadrant. While these authors conclude that this population should be associated to the Norma and Perseus spiral arms of the Milky Way, it turns out that all the considered fields lie within the region of the sky where CMa is detected (from their Table 1 ; , see Pap-I and Sect. 3, below), and in the same range of distances as CMa (6.0 kpc 11.7 kpc, see Pap-I, Pap-II and Sect. 4, below). Moreover, the Blue Plume populations studied by Carraro et al. (2005) appear to follow a distance - Galactic longitude trend quite similar to that found here for the Red Clump population of CMa (see Sect. 4.1.1, below).
The first results of a large spectroscopic survey provided an estimate of the systemic radial velocity and velocity dispersion of CMa ( km/s; km/s Martin et al., 2004b, hereafter Pap-III), while an estimate of the systemic proper motion has been obtained by Momany et al. (2004). Martin et al. (2005, hereafter Pap-IV) analysed the kinematics of more than 1400 Red Giant Branch and Red Clump stars around the centre of CMa, confirming the essence of the results of Pap-III, namely that CMa stars have a systemic velocity and a velocity dispersion quite different from what expected from Galactic disc stars at the considered distance and quite typical of Galactic dwarf satellite galaxies. Moreover they detected a clear distance - radial velocity gradient among CMa stars that can be explained as the effect of on-going tidal disruption of the stellar system. A significant refinement of the proper motion estimate was also obtained in Pap-IV. Finally, Dinescu et al. (2005) very recently obtained a new accurate estimate of the proper motion of CMa and concluded that (a) the system has a significant component of motion perpendicular to the Galactic Plane ( km/s) and that (b) this W component of the space motion of CMa is in the opposite direction with respect to the expected W motion of stars associated with the Galactic Warp. Other interesting investigations of the CMa relic, not strictly related to the present work or in a too preliminary stage to be fully useful for the analysis, can be found in Kinman, Saha & Pier (2004); Forbes, Strader & Brodie (2004); Sbordone et al. (2005); Mateu et al. (2005).
Momany et al. (2004) suggested that the CMa overdensity may be an effect of the stellar component of the Galactic Warp (Djorgovski & Sosin, 1989; Yusifov, 2004; López-Corredoira et al., 2002; Vig, Ghosh & Ojha, 2005), whose broad southern maximum (as a South/North density asymmetry) lies in the range (López-Corredoira et al., 2002; Vig, Ghosh & Ojha, 2005). In Pap-II and Pap-III, in particular, we showed that such a conclusion can be reached only if the distance distribution of the adopted tracers (M giants) is neglected and that CMa is in fact an additional overdensity of different nature with respect to the large scale Warp of the Galactic disc. On the other hand the disentanglement of the two structures may prove difficult, limiting our possibility to obtain a detailed global description of CMa and the Warp (see Pap-III, for this discussion). A global analysis of CMa is also hampered by the large degree of contamination from Galactic stars, by the high and variable extinction toward the Galactic plane and by its proximity to us that imply a very low surface density in star counts per unit solid-angle of sky (see Sect. 4.4, below).
It is clear that a large scale study of CMa using a different tracer than the M-giants used in the previous wide-field studies of the system would provide a very useful independent check of the results of Pap-I and may help us to understand the relation between CMa and the Warp. In Pap-I we showed that the Red Clump (RC) of Helium-burning stars of the CMa system is clearly detected in the 2MASS database and in Pap-II we used the RC stars to show that CMa is an independent structure, superposed on the Galactic Warp. Here we extend the use of RC stars to trace the whole structure of the outer Galactic Disc, focusing on the CMa relic and of the Galactic Warp in its surroundings. In Sect. 2 we describe the adopted dataset and assumptions, and we introduce our analysis method. In Sect. 3 we study the spatial distribution of overdensities rising from asymmetries between the Southern and Northern Galactic hemisphere, focusing on the relation between Canis Major and the Galactic Warp. In Sect. 4 we derive some fundamental parameters of CMa as a stellar system, and, finally, in Sect. 5 we summarise and discuss the main results of these analyses.
2 Red Clump stars as tracers of outer Disc structures.
We extracted from the 2MASS Point Source Catalogue the sources comprised between and , having . The selected range of longitude and latitude cover the largest part of the Galactic Disc, avoiding only the surroundings of the Galactic Centre, where the stellar crowding and the interstellar extinction may prove too severe for a useful analysis in the present context. Stars were selected according to the quality of the photometry and to avoid spurious and contaminated sources as in Bellazzini et al. (2003b). Moreover, only stars having photometric uncertainties mag both in J and K magnitude have been included in the sample. The magnitudes of all the stars were corrected for extinction using the colour excesses interpolated on the COBE/DIRBE maps (Schlegel, Finkbeiner & Davis, 1998) and modified according to Bonifacio, Monai & Beers (2000), as done in Momany et al. (2004) and Pap-III. Obviously a 2-dimensional extinction map cannot account for the 3-dimensional distribution of the intersellar dust, thus the adopted correction may not always be good for nearby stars, but should be quite appropriate for the distant Red Clump stars we are interested in. The extinction laws by Rieke & Lebofsky (1985) have been adopted. In the following J, H, and K magnitudes denote reddening-corrected magnitudes , , and , unless otherwise stated. Only stars with were retained for the analysis.
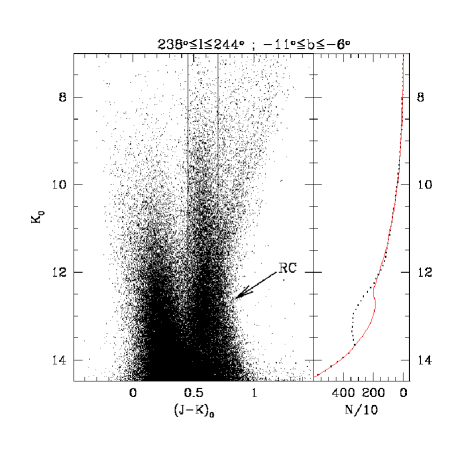
In Figure 1 we show the J-K, K CMD of a low-extinction field near the centre of the CMa structure. The diagram is dominated by Main Sequence (MS) stars of the Galactic disc for , for the M giants are contributed by both the disc and CMa, and the intermediate colour strip, , enclosed by continuous lines in Fig. 1, should be dominated by RC stars located at various distances. While the M giant sequence of CMa can be revealed only with the subtraction of a control field symmetric with respect to the Galactic Plane (Pap-I) the Red Clump of the system is clearly visible without subtraction in the range with an apparent peak around , as readily shown by the histogram in the left panel of Fig. 1 (dotted black line), in excellent agreement with Pap-I. Hence RC stars are very promising tracers of the CMa structure. In the following discussion we will limit our analysis to the stars in the colour strip enclosing the typical RC stars, , as in Pap-II (e.g., the region enclosed within parallel continuous lines in Fig. 1). In the left panel of Fig. 1 we also plotted the Luminosity Function (LF) obtained with the same selection criteria from a synthetic sample of the same region of the sky extracted from the Galaxy model by Robin et al. (2003, hereafter R03, red continuous line; see Appendix A for details). The R03 model includes a warped and flared disc (whose parameters have been fixed according to observations) and the effect of the displacement of the Sun with respect to the Galactic Plane by 15-16 pc (toward the Galactic North, Hammersley et al., 1995, R03). It is interesting to note that the R03 model reproduces excellently the observed LF for and , but completely lacks the strong bump around that we attribute to the RC of Canis Major.
With respect to M giants, RC stars may suffer from a larger degree of contamination by unrelated sources. While for the only possible contaminants for M giants are M dwarfs at faint magnitudes (), our colour-selected RC sample may be contaminated by K giants essentially at any magnitude, and significant numbers of both M and G dwarfs can be pushed into the RC colour range by photometric errors for (see López-Corredoira et al., 2002, and Appendix A, for discussion). However all the results presented below are in the form of subtractions of star counts in the Southern and Northern Galactic hemispheres. Since the degree of contamination from Galactic sources as a function of magnitude should be similar in both hemispheres, the subtraction should minimise any spurious effect associated with contaminants (see Appendix A, below). Moreover, all the results presented below remain unaltered if we limit our sample to RC stars having , where the contamination by dwarfs is not overwhelming (López-Corredoira et al., 2002). In Appendix A we study the problem of contamination by dwarfs in some detail, showing that (a) in spite of the large fraction of dwarf that may contaminate our samples and of the presence of North-South differences in the degree of contamination, the adopted technique traces trustworthy real asymmetries in the density of distant giants, for , and (b) the intrinsic asymmetry due to the pc displacement of the Sun above the Galactic plane (Hammersley et al., 1995) has a negligible effect on our analysis.
On the other hand RC stars should be intrinsically more numerous than M giants and they provide a completely independent and more reliable distance scale compared to the photometric parallax of M giants (see Bellazzini et al. (2003b), Majewski et al. (2003), Pap-I, Pap-II and Pap-III).
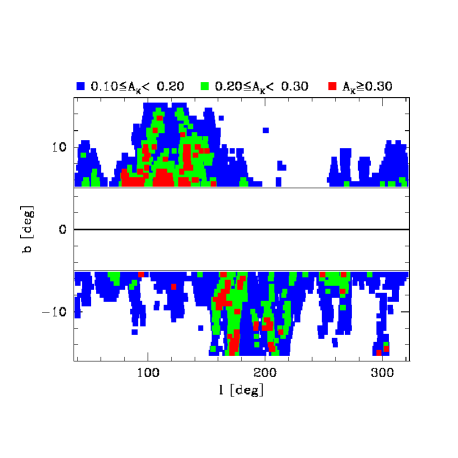
If not otherwise stated, we will use in the following analysis only stars with to avoid the regions where the extinction is most severe. Fig. 2 shows that once the strip is excluded, the region considered in the present analysis is largely free from high extinction regions (e.g. where mag). Since most of the structures we are interested in are enclosed in the latitude strip , most of the following analysis is limited to this range. Note that the 2MASS Point Source Catalogue is complete down to (Cutri et al., 2003), hence the luminosity range in which most of the RC stars we will consider lie ( ) is not expected to suffer from problems of incompleteness.
2.1 CMa and the Warp as South-North overdensities
It has to be noted that the origin of disc warps and the relationship between gaseous and stellar warps is far from understood (Binney, 1992; Kuijken & Garcia-Ruiz, 2001). Moreover the characterisation of the stellar Warp of the Milky Way is quite poor and uncertain, mainly because of the problems inherent with the analysis of stellar fields at low Galactic latitudes. Finally, it is important to realise that the adopted parametrisation may describe different characteristics of the warp and may induce some confusion in the use of terms. For instance, Djorgovski & Sosin (1989) identified the stellar warp as a sinusoidal variation of the mean latitude of their tracers (namely IRAS sources) as a function of longitude. In this case the ”maximum of the warp” coincides with the maximum angular height above the Galactic equator, similar to the parametrisation adopted when dealing with the gaseous warp. On the other hand, López-Corredoira et al. (2002) described the warp as the sinusoidal variation of the ratio of star counts in Northern and Southern Galactic hemisphere as a function of longitude, hence their ”maximum of the warp” is the region where the Southern (or Northern) projected overdensity reaches its maximum. The two definitions may provide very different views, depending on the structure of the disc and on the relative 3-D positions of the observed structures and the Sun. Since the CMa galaxy was identified as a South/North overdensity it should be compared with the Warp as a South/North overdensity (à la López-Corredoira et al., 2002), since this is the only relevant parameter in this context. The parametrisation of the amplitude of the Warp as the artificial shift to apply to the Galactic plane to match the star counts in the Northern and Southern hemisphere (as done by Momany et al., 2004) is not a fair description of South/North overdensities in the present context, since it turns into a comparison of stars lying at different distances, as shown in Pap-III. Hence, in the following we will always deal with CMa and the Warp as South/North overdensities.
2.2 The construction of subtracted density maps
Most of the following analysis will make use of subtracted density maps obtained form the above described sample of color-selected RC stars. In this section we will describe in detail how these maps are obtained.
RC stars are widely used as distance indicators (see, for example Paczynski & Stanek, 1998; Sarajedini et al., 2002; Babusiaux & Gilmore, 2005; López-Corredoira et al., 2002, and references therein). In Pap-II we assumed for the RC of CMa, since, according to the theoretical models by Salaris & Girardi (2002), this interval encloses the absolute K magnitude of the RC for populations of metallicity and age between 4 Gyr and 10 Gyr, i.e. the proper age and metallicity for CMa (see Pap-II). Here we adopt the same assumption to obtain the distance of each RC star in our sample. These individual distances should be regarded with some caution since the adopted distance scale is optimised for the RC of CMa and may provide misleading answers when is applied (a) to contaminant sources that are not RC stars (see sect. 2, above), and (b) to RC stars outside the age and metallicity ranges outlined above. On the other hand, the range of age and metallicity of stellar populations in the outer Galactic Disc that produce RC stars should not be too different from that outlined above. Hence, the assumed global distance scale is expected to provide a reasonable description of the overall spatial distribution of RC stars in this region of the Galaxy and a reliable representation of the CMa system. In particular, it should be considered that RC stars are much less sensitive to metallicity and age variations in the considered populations compared to M-giants (see, Majewski et al., 2003; Crane et al., 2003; Martin et al., 2004a; Rocha-Pinto et al., 2005, and references therein). Finally, it should also be recalled that in the following we will deal only with subtracted density distributions: the subtraction should cancel out many of the above effects if, as it very reasonable to assume, at a given Galactocentric distance the age and metallicity distributions are similar in both Galactic hemispheres.
We used the distances of individual RC stars in our sample to obtain their Cartesian Heliocentric coordinates:
| (1) |
| (2) |
| (3) |
In this system the coordinates of the Sun are (x,y,z)=(0.0,0.0,0.0) kpc and the centre of the Galaxy is located at (x,y,z)=(+8.0,0.0,0.0) kpc, having assumed that the distance to the Galactic center is . To avoid any possible effect of local inhomogeneities in the vicinity of the Galactic Plane we also removed the stars having kpc. Given the adopted selections this is equivalent to excluding stars within kpc from the Sun.
From these samples we computed the density of RC stars on an x,y grid with boxes of size , spaced by both in x and in y. The overlapping between adjacent boxes ensures some degree of smoothing, providing more clearly readable maps. In this way we obtained x,y density maps of the Southern and Northern Hemisphere that can be subtracted, ”pixel-to-pixel”, to obtain a map of the residual surface density in the x,y plane, that is residual maps of the Galactic Plane as seen from the Galactic pole. The density at each point of the subtracted map is computed as
Note that and are a sort of “column” density, since at the position (;) the derived density is equal to the number of RC stars having and , at any z within the limits of our sample. The imposed selection in latitude () imply that the range in z sampled by different pixels of the grid varies with their heliocentric distance. In particular, at kpc the sampled range of z is 0.5 kpc 1.5 kpc, at kpc: 0.9 kpc 2.6 kpc, at kpc: 1.1 kpc 3.3 kpc. It is important to realize that this has no consequence for the subtracted densities , since each pair of pixels to be subtracted have exactly the same volume.
Since a large absolute density residual (e.g. in number) does not necessarily imply a statistically significant signal, it is mandatory to obtain the subtracted density maps also in terms of Signal-to-Noise ratio, that is in units of :
where
Subtracted maps in terms of number density provide a physical idea of the extent of the detected overdensities, while subtracted maps in units allow us to discriminate structures that are statistically reliable and significant from those that can arise from mere statistical fluctuations.
3 Overdensities in the Outer Disc
Fig. 3 shows the maps of residuals obtained by subtracting the Northern hemisphere density map from the Southern hemisphere density map, in terms of number density (panel a) and in units of (panel b). We recall here that the regions and are excluded from the present analysis. In Appendix A it is shown that while the effect of contamination by dwarfs should not significantly affect subtracted density maps for , it may become quite relevant at fainter magnitudes. In this section we present subtracted maps that include also stars having to avoid abrupt distance thresholds in the proximity of the regions of interest. We caution the reader that the reliability of the maps may be drastically reduced beyond the heliocentric circle corresponding to the limit that is always clearly shown in Figs. 3, 4 and 5 below, as a reference. According to the results of Appendix A, the contamination by dwarfs can seriously affect the maps also around . On the other hand, the main structures we deal with in the following analysis lie safely in the range of latitudes and distances that should be correctly probed by our subtracted-density technique (see Appendix A).
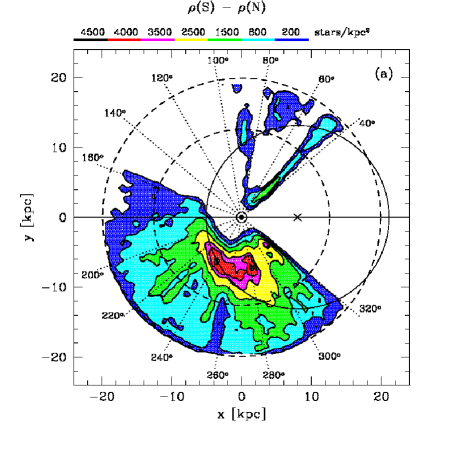
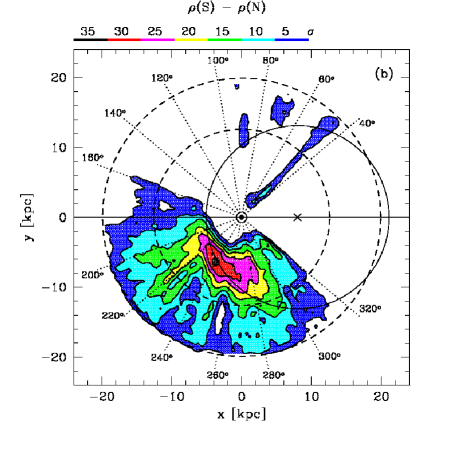
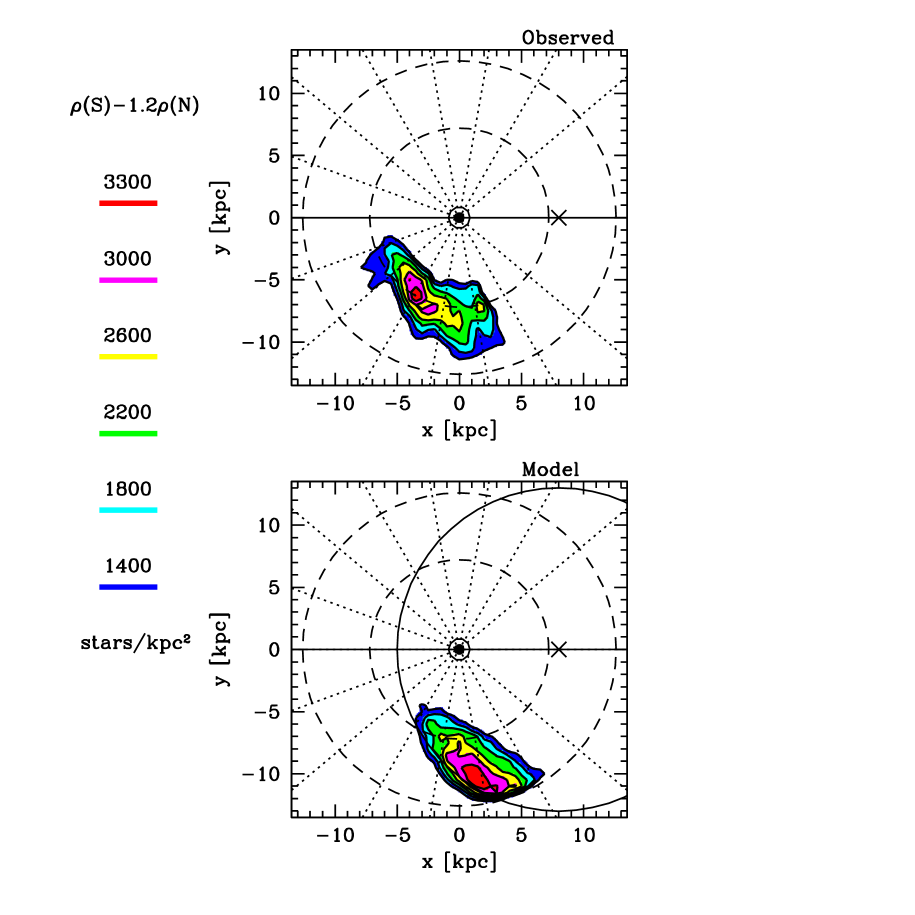
With the only exception of a few limited low-significance structures near the edges of the map (in particular near , probably due to edge effects), the strongest South-North overdensities are confined in the third and fourth Galactic quadrants (). This is not unexpected since it is well known that the Galactic Disc is warped toward the South Galactic hemisphere for and toward the North Galactic hemisphere for (Djorgovski & Sosin, 1989; Yusifov, 2004; López-Corredoira et al., 2002; Vig, Ghosh & Ojha, 2005, and references therein). The third and fourth Galactic quadrants appear dominated by a wide, galactic-scale overdensity that extends over the whole half of the disc with . On top of this large-scale asymmetry there is a strong and spatially confined overdensity, with an elongated, approximately elliptical shape, with a denser roundish core located at (x,y)=(-3.7 kpc, -6.4 kpc), toward , at kpc and kpc. This is the Canis Major structure, as described in Pap-I, Pap-II and Pap-III. Note that a secondary core that appears towards in Fig 3a is revealed as a non-statistically-significant structure by the inspection of the map in units (Fig. 3b).
The linear “finger of God” structures between and , and at correspond to asymmetric features in the distribution of the extinction (see Fig. 2) and are likely artefacts associated with the (unknown) three dimensional distribution of the interstellar dust. These features are present in all the South-North maps presented in this paper and will not be discussed further. Note also that the strongest and most significant parts of the detected overdensities (including the body of CMa) lie within the circle enclosing the RC stars with (inner heliocentric long-dashed circle, at kpc), that is in the region where the contamination by dwarf stars is less severe (i.e., the contribution of dwarfs is less than 50 per cent, according to López-Corredoira et al., 2002, and the contribution of dwarfs to subtracted densities in lower than 30 per cent, see Appendix A).
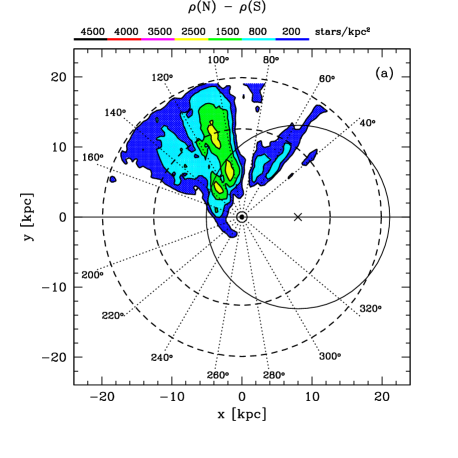
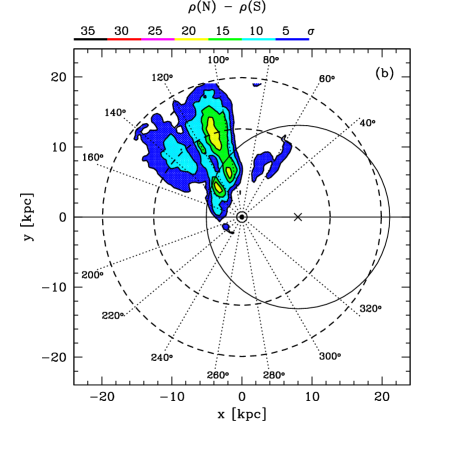
Fig. 4 shows the maps of residuals obtained by subtracting the Southern hemisphere density map from the Northern hemisphere density map, in terms of number density (panel a) and in units of (panel b). Also in this case the detected overdensities are confined to the Galactic quadrants that are expected to host the northern lobe of the Warp. The observed asymmetry has a large scale - as in the South-North maps - but is weaker and less significant than the large-scale Southern asymmetry. This may be due to differences in the structure of the Northern and the Southern Warp (see, for instance Yusifov, 2004; Porcel et al., 1997) and to the effect of the displacement of the Sun with respect to the Galactic Plane (Hammersley et al., 1995)). However, in the present context is interesting to note that (a) there is no overdensity comparable to CMa in the Northern Hemisphere and (b) the most significant asymmetries lie in the range , that is at from the densest part of the large-scale Southern overdensity ().
The inspection of Fig. 3 and Fig. 4 clearly demonstrates that CMa is the strongest (35 ) overdensity of the whole Galactic Disc. Moreover it is strongly spatially confined (the two innermost density contours have a typical scale of 4 kpc 2 kpc) and there is no corresponding structure either on the opposite side of the disc () or at the reflected position about the y or x axis.
Note that the detected excess of RC stars is quantitatively very similar to what was found for M giants in Pap-I (in terms of and of fractional excess). CMa appears as a strongly concentrated, cored overdensity on top of a galactic-scale asymmetry that has all the characteristics of the Galactic Warp.
3.1 Removing the large scale asymmetry
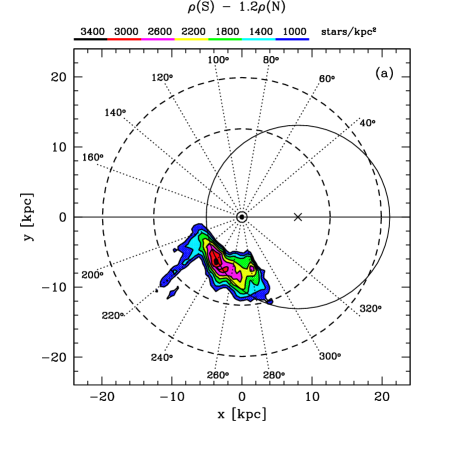
If the global smooth overdensity is related to the Galactic Disc (i.e. it reflects the Warp asymmetry) it should be possible to subtract it from the maps of Fig. 3. Since the overall number of southern RC stars in our sample is 1.2 times that found in the Northern hemisphere, as the simplest assumption we rescale the density of the Northern map by this factor and repeat the subtraction. The adopted normalization should account also for the effect of the off-plane position of the Sun. The resulting maps of residuals are shown in Fig. 5, both in terms of number density (panel a) and in units (panel b). Adopting a safe 10 cut, the only surviving structure is CMa plus tiny traces of the already discussed finger-of-God features at .
Note that large negative residuals () appear only near the edges of the maps (Fig. 5b). This means that the rescaled northern density map is a reasonable model of the large-scale overdensity observed in the southern hemisphere. We tried different simple models fitting the observed overall decline of the large-scale overdensity with : in all cases the only overdensity surviving the subtraction of the model from the southern density map is CMa, in all cases displaying the characteristic shape shown in Fig. 5a,b. This exercise strongly supports our interpretation of the southern overdensities in the considered region of the Galaxy in terms of a large-scale Galactic asymmetry (warp) plus an additional unexpected elongated compact structure with a dense core, i.e. the Canis Major overdensity.
3.2 Comparison with a Warp model
In response to the suggestion that the CMa overdensity may be associated with the Galactic Warp, we have compared the observed characteristics of CMa with two different models of the Galactic Warp, namely that enclosed in the Galactic model by Robin et al. (2003), in Pap-II, and the warp model by Yusifov (2004), in Pap-III. In both cases we found that the models were clearly unable to reproduce the very compact structure of CMa. In particular the distance profile of the overdensities predicted by models are much more extended than what is observed for Canis Major. Here we extend the comparison to the model by López-Corredoira et al. (2002, hereafter L02) that has been constructed to fit the overall distribution of RC stars in the Galactic Disc.
In order to compare density distributions obtained with the same technique, we constructed a Montecarlo realisation of the L02 model and we applied the same selections as to the observed sample (i.e., and kpc). We extended the L02 model outside its maximum Galactocentric distance ( kpc) with the following assumptions for the average elevation of the disc above the plane (see Eq. 20, in L02):
for 13.0 kpc 16.0 kpc,
where and deg, and
for kpc. This extrapolation produces a regime of nearly constant elevation for 13.0 kpc 16.0 kpc and a drop to the plane at larger galactocentric distances, that appear as the most appropriate for the Southern warp, according Porcel et al. (1997) and Yusifov (2004), for example. For homogeneity, we applied the kpc cut also to the observed sample. Note however that the region relevant for the comparison is largely included within the kpc limits, hence the adopted extension of the L02 model must have little effect on our results (see Fig. 6, below).
Finally, we limit the comparison to stars within kpc, corresponding to the for RC stars. After applying all of the above selection criteria, the Montecarlo realisation of the L02 model contains particles. Considering these particles as the analogues of RC stars, we have obtained subtracted density maps from the model in exactly the same way as we did for real stars (see Sect. 2.2). We normalized the density scale of the Model map by requiring that the maximum density is the same in the syntethic and observed map. We have tried also several other normalizations and we found that the essence of the results remains unchanged.
In Fig. 6 the observed South-North subtracted map (upper panel) is compared to the same map obtained from the L02 model. Both maps are represented in the same scale of density excess. The differences between the two maps are clearly evident. In the model map the Warp appears as a large wedge-shaped overdensity, somewhat similar – in shape – to the densest part of the large scale overdensity observed in Fig. 3. The density of this feature reaches a broad maximum in the range , over a large range of Heliocentric distances, around (x,y) (1.5;-10.3) – while the maximum of the observed density occurs at and (x,y) (-3.5;-6.2), more than 6 kpc apart. It is quite clear that the model is totally unable to reproduce the CMa structure presented in the upper panel of Fig. 6 as the only significant overdensity, extending from to , with its compact elliptical shape and short minor axis, and with its core at . The differences between the two structures (CMa and the L02 Warp model) clearly suggests that they are of a different nature and cannot be identified with one another, confirming the results presented in Pap-II and Pap-III (see also Fig. 1, here).
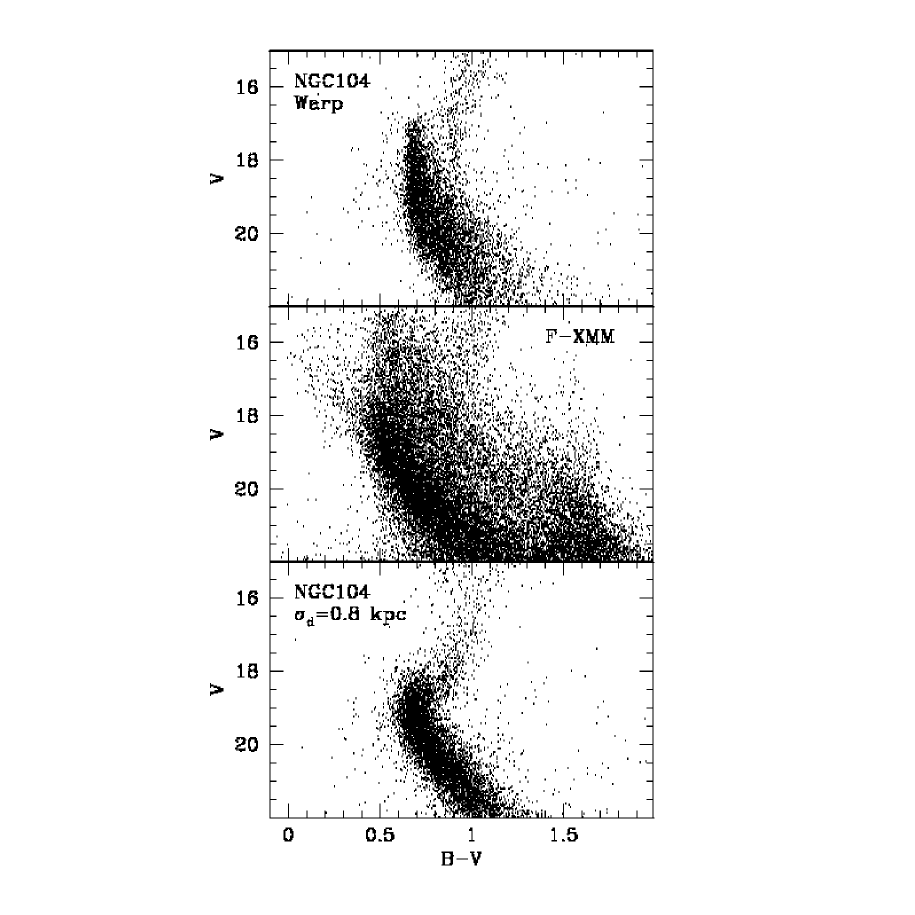
Despite the large differences shown in Fig. 6, it may still be argued that the L02 Warp model still predicts some South-North overdensity at the position of CMa. Are the observed and predicted distributions locally similar, at this position? To test this possibility we recur to the optical CMD of the XMM field (F-XMM, at and ) we presented in Pap-II, that is reproduced in the middle panel of Fig. 7. To have an idea of how the CMD of an ensemble of old stars distributed according to the L02 model would appear we proceeded as follows: (1) we take as template population the photometry of stars of the globular cluster 47 Tucanae presented by Bellazzini et al. (2004b), (2) we extracted, at random, 20000 stars from this sample and we corrected their magnitude for extinction and for distance (assuming E(B-V)=0.04 and (m-M)0=13.29 for the custer, from Ferraro et al., 1999), (3) we assigned to each star a distance randomly extracted from the distance distribution predicted by the L02 model toward , and (4) we corrected for the corresponding distance moduli and for the reddening of the F-XMM field (E(B-V)=0.14, see Pap-II).
The synthetic CMD thus obtained is shown in the upper panel of Fig. 7. Its morphology is completely different from that of the observed diagram. Stars around the Turn Off (TO) point of the cluster form a vertical sequence from to that abruptly bends to the red for in the way typical of CMDs of Galactic fields that sample populations at widely different distances along the line of sight. This result is similar to what we obtained in Pap-II while comparing the F-XMM CMD with the predictions of the warped and flared Galactic model by Robin et al. (2003). Note that 30% of the stars plotted in the upper panel of Fig. 7 have associated distances that place them in the regime in which we adopt an extrapolation of the L02 model. However, repeating the experiment while forcing the selection of stars with leads to a CMD having a morphology essentially indistinguishable from that shown here. Hence, also in this case the adopted extrapolation of the L02 model has a negligible effect on our results. In contrast, the F-XMM CMD shows a clear and narrow Main Sequence that bends continuously from the TO (around ) to the limit of the survey, clearly resembling a bound stellar system. This similarity is made clearer by the comparison with the CMD shown in the lower panel of Fig. 7. This synthetic diagram has been obtained repeating the steps 1, 2 and 4 described above but assigning to stars distances extracted from a Gaussian distribution having a mean kpc (i.e., the distance of CMa as derived in Pap-III) and kpc, as derived by Martinez-Delgado et al. (2005a) for CMa. Except for the foreground field population that is, obviously, present in the F-XMM and absent in the higher latitude 47 Tuc field, the two MS features are strikingly similar. This test confirms that the observed CMa overdensity in not predicted by current models of the Galactic Warp, neither on global or local scales. While all the considered models predict that the Galactic Warp should provide some overdensity at the position of CMa, in good agreement with the results shown in Fig. 3, none of them is able to reproduce anything remotely similar to the extremely compact, cored structure we observe in Canis Major.
It should be recalled that the Galaxy models including a warped and flared outer Disc, as those considered here and in Pap-II and Pap-III, are not meant to provide a perfect representation of the Galaxy, in particular for what concerns the outer parts of the Galactic Disc where the available observations are scanty and uncertain over large ranges of longitude. Hence, the fact that these models are unable to reproduce the observed structure of CMa is not an ultimate proof that Canis Major cannot be a substructure of the Galactic Disc. On the other hand, this is a proof that (a) Canis Major is a truly unexpected structure, since no similarly spatially confined and dense structure is included in existing warped and flared models of Galactic Disc and, (b) the CMa structure is fairly different from the general expectations of an overdensity due to the Galactic Warp, since it is a compact elongated and cored structure instead of a large wedge-shaped lobe, as shown in Fig. 6, and, above all, it appears at a significantly different position.
3.2.1 The Argo structure
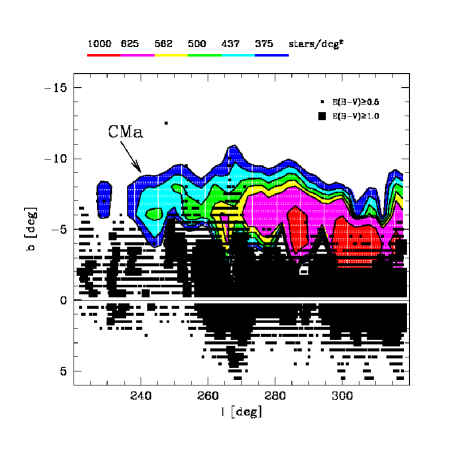
While the present paper was near completion a preprint was posted (Rocha-Pinto et al., 2005, hereafter RP05) studying the distribution of 2MASS M giants at low galactic latitudes (). Adopting an extinction grid with a finer resolution compared to previous analyses of M-giants (Majewski et al., 2003; Crane et al., 2003, Pap-I), and using a starcounts model to subtract the smooth Galactic components, they are able to follow overdensities down to lower absolute latitudes () than, for instance, in Pap-I. They find that, in the region, all the existing overdensities are enclosed in the range of Heliocentric distances . They confirm the presence of the CMa overdensity in this range but they claim that it is part of a larger and denser structure, centred around , that they interpret as a large dwarf galaxy which they name Argo. They suggest that Argo and CMa can be erroneously seen as separated entities only because of a plume of extinction located at extending to (see Fig. 2 and Fig. 8, below) that introduces an artificial discontinuity in the surface density.
In Fig. 8 we present the South-North subtracted surface density map of RC stars in the range , obtained by counting stars (in the distance range 5.0 kpc 13.0 kpc) within boxes spaced by both in longitude and latitude. In this case also stars with have been included in the sample, for a better comparison with RP05. The main body of the claimed Argo structure is clearly traced, in surface density, also by RC stars. In Fig. 8 it appears as a strong, elongated overdensity with a broad maximum around , with CMa placed at its low longitude edge (compare with Fig. 1 and Fig. 3 of RP05).
The maps displayed in Fig. 3a,b (as well as Fig. 5, 6, and 7, above) show that there is no spatially confined 3-D structure corresponding to this strong surface overdensity. Integrating over the range along the direction implies summing up the contribution of all the stars encountered along the line of sight that crosses the maximum of the overdensity produced by the Galactc warp. In any case, while in terms of surface density - integrated over 14 kpc along the line of sight - CMa is a much weaker structure compared to Argo (see Fig. 8), it corresponds to a much more spatially confined structure: CMa spans the range 5 kpc 12 kpc, with a line-of-sight Half Width at Half Maximum of just kpc (see Pap-II, Martinez-Delgado et al. (2005a) and Sect. 4.1, below). The major axis of CMa is approximately oriented along the path of a nearly-circular orbit around the centre of the Galaxy (see Fig. 5 and Fig. 11, below), consistent with the N-body simulation presented in Pap-IV (see Sect. 4.2, below). On the other hand, the Argo structure corresponds to a part of the large-scale southern overdensity that spans more than 15 kpc in heliocentric distance, toward and it does not appear as a coherent, cored structure as CMa (see, Fig. 3).
The above arguments are clearly displayed in Fig. 9, where we consider the surface density of RC stars confined to the very narrow range of Galactocentric distances including most of the main body of CMa (12.0 kpc 14.0 kpc). The subtracted surface density map in the upper panel of Fig. 9 has been obtained in the same way as Fig. 8, but is expressed in terms of fractional density excess to allow a comparison with the L02 model. It is quite evident that at this spatial location the only strong overdensity is CMa, while Argo has completely disappeared. On the other hand the fractional excess due to the Warp (integrated over , Fig. 9, lower panel), as predicted by the L02 model, reaches its maximum at the longitude corresponding to the maximum density of Argo ().
There is also a quantitative self-consistency problem to consider. RP05 derive (from M giants) an estimate of the total luminosity of for Argo. Limiting ourselves to the stars contributing to the map of Fig. 8 and within we count an excess of more than RC stars. With the assumptions stated in Sect. 4.3, below, we obtain a total luminosity of , orders of magnitude larger than the R05 estimate. Note that our estimate should be considered as a lower limit since (a) the contribution of CMa is not included, while RP05 consider it as a part of Argo, and (b) we limited the calculation to the approximate distance range , while R05 integrate over . Hence the beautiful consistency among the luminosity estimates obtained from M-giants, RC stars and MS stars achieved for CMa (see Sect. 4.3, below) is completely lost in the case of Argo. This strongly suggests that Argo is not a coherent stellar system, but is instead just a surface density structure that originates from the mix of different (and unrelated) populations that happen to lie along the same line of sight.
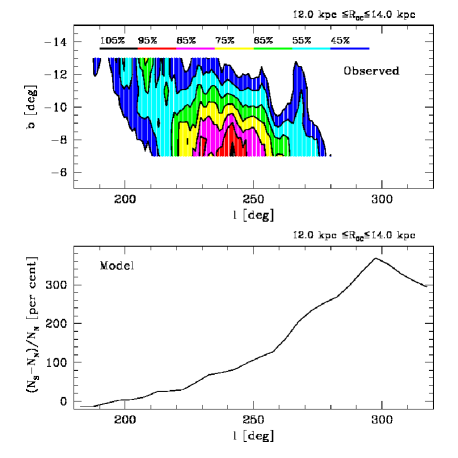
RP05 discard the warp hypothesis for the nature of Argo claiming that the shape of the structure is not ”warp-like”. However, in their view, all the southern overdensities in the region are due to Argo and CMa. The implicit conclusion is that the Galactic Warp (and flare) does not produce any observable South-North asymmetry in this region, at odds with the conclusions of López-Corredoira et al. (2002); Vig, Ghosh & Ojha (2005). The smooth nature of the global South-North asymmetry shown to be present in this region, its Galactic-scale dimensions, and the fact that a rescaled version of Northern density map is a good model for it (Fig. 5), strongly indicate that the surface density structure centred around is not a dwarf galaxy remnant (Argo) but the effect of the Warp (and flare) asymmetries of the Galactic disc.
Turning back our attention to CMa, there is an interesting point that can be appreciated from the comparison of Figs. 9 and 10. While the CMa structure is present in both maps, its appearance is quite different. Most of the difference is just apparent and is due to the density scale adopted in Fig. 8, that is best suited to provide a good view of ”Argo” and compress the whole structure of CMa to just three levels of density. However part of the difference is real, and is due to the much larger degree of foreground/background contamination affecting the map of Fig. 8, which includes stars at any Galactocentric distance. In particular, the center of the structure (i.e., the region of maximum density) is shifted from in the distance limited map (Fig. 9, that should be closer to the actual physical structure of the system) to in the all-distances map of Fig. 8, due to contamination by likely unrelated stars at various distances along the line of sight. This kind of effect should be always taken into account in studying the structure of CMa, since effects due to the integration along the line of sight can significantly change the overall view of the system.
3.3 The nature of the Canis Major overdensity
In our view there are only two possible explanations for the observational evidence presented above:
-
1.
Canis Major is a strong and unexpected substructure of the outer Galactic Disc. This would imply that the Disc hosts very dense and compact substructures of old stars (the age should be larger than 1-2 Gyr to have RC stars and should be larger than 4-5 Gyr according the optical CMDs, see Pap-II and Martinez-Delgado et al. (2005a)). Such substructure should be very different, in nature, from usual spiral arms, for instance, that host populations dominated by very young stars. A local distorsion of the outer Disc, coupled with a large scale warp, may also possibly reproduce the observed distribution of overdensities in the Southern Galactic Hemisphere.
-
2.
Canis Major is the remnant of a disrupting dwarf galaxy, as suggested in Pap-I, II, III, and IV. This interpretation naturally fits all the observational evidence collected up to now, with particular emphasis on the size and density of the structure and to the kinematics of its stars (see Pap-III, Pap-IV and Martinez-Delgado et al. (2005b)).
For the reasons described above and in the previous papers of this series, our preference goes to the second hypothesis, that appears to provide a much easier explanation of the whole observational scenario. In the following we will take this hypothesis as true and, on this basis, we will derive some interesting physical characteristics of CMa as a stellar system.
4 Physical parameters of Canis Major
4.1 Distance
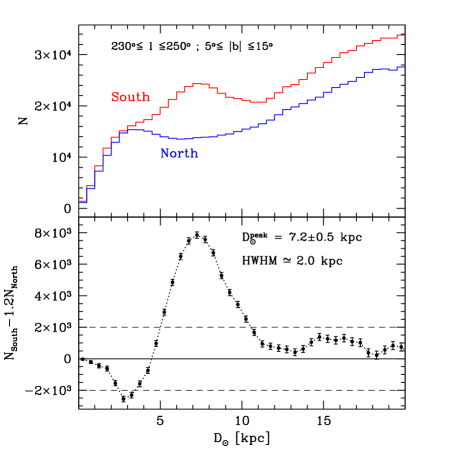
In Pap-III we obtained a distance profile of CMa using M-giants as distance indicators. Here we can repeat that analysis using the more reliable distance scale provided by RC stars. In the upper panel of Fig. 10 we show the distance distribution of the RC stars in our sample in the Northern (blue) and Southern (red) hemispheres, in a wide region toward the centre of CMa. The southern profile shows an overall excess at any distance, with respect to the northern one, plus an additional bump peaked around kpc. We rescaled the northern distribution by the same factor as in Fig. 5 (e.g., ) and subtract it from the southern profile. The result is shown in the lower panel of Fig. 10: the South-North excess appear to be confined within kpc and kpc. The peak of the profile is at kpc and the Half Width at Half Maximum is kpc, in excellent agreement with the results of Pap-I, Pap-III and Martinez-Delgado et al. (2005a). There are a few interesting considerations that can be deduced by inspecting Fig. 10:
-
•
The distance profile of CMa as obtained from its RC stars is strikingly similar to that derived from M-giants in Pap-III. Even leaving aside the perfect coincidence of the peaks of the two distributions, that may be ascribed to a mere coincidence within the uncertainties associated with the two distance scales, it remains a fact that the two independent tracers give essentially the same line-of-sight profile of the CMa system.
-
•
In our various analyses we have obtained distance estimates for CMa from four different and independent distance indicators. In order of accuracy: from the tip of the Red Giant Branch in the I band ( kpc, Pap-III), from the Red Clump in K band ( kpc, present analysis), from the photometric parallax of M giants in the K band ( kpc, Pap-I), and from Main Sequence fitting in the B and V bands (, Pap-II). All of these independent methods consistently provide a distance of the centre of CMa within and . Hence, the average distance of CMa should be now regarded as a very reliable piece of information about this system. Note that if is assumed, the age estimate obtained in Pap-II would shift toward older ages (i.e. 6 Gyr age Gyr, instead of 4 Gyr age Gyr).
4.1.1 The spatial orientation of CMa
The subtracted density maps of Figs. 3, 5 and 6 make evident that the physical orientation of the elongated body of CMa implies a heliocentric distance-longitude gradient: the heliocentric distance of CMa grows with Galactic longitude. Using the same technique as above we find that the distance of the main body of CMa varies from kpc at , to kpc at , to kpc at .
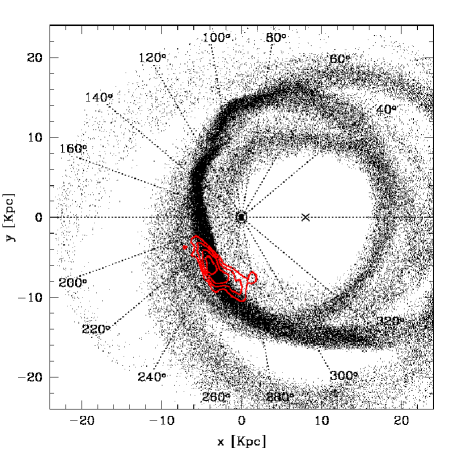
The effect is clearly depicted in Fig. 11, where the contours of the main body of CMa (in red, taken from Fig. 5b) are superposed on the results of the N-body simulation of the disruption of the CMa galaxy presented in Pap-IV. The simulation is produced by a dwarf galaxy model of mass that is accreted onto the Milky Way during Gyr (see Pap-IV for details) and it was built to reproduce the current mean position and 3-D velocity of CMa as well as the distance–radial velocity gradient discovered in Pap-IV. Hence the distance–longitude behaviour of the remnant is a prediction of the model, not an a priori requirement. Therefore the excellent qualitative and quantitative agreement with the observed and predicted spatial orientation of the main body of CMa may be considered as a success of the dwarf-galaxy-accretion scenario for the nature of CMa. In other words, the structure and spatial orientation of CMa as obtained from RC stars is fully consistent with the model of a disrupting dwarf galaxy that fits the observed position and kinematics of CMa.
4.2 Luminosity and surface brightness
The Evolutionary Flux relation (Renzini & Buzzoni, 1986; Renzini & Fusi Pecci, 1988; Renzini, 1998) states that the total number of stars in a given evolutionary phase () is proportional to the total luminosity of a stellar system (). Considering a Simple Stellar Population (SSP, i.e. a population of stars with the same age and chemical composition):
| (4) |
where is the duration of the evolutionary phase in years, and is the specific evolutionary flux, i.e. the number of stars entering or leaving any post Main Sequence evolutionary phase per year per solar luminosity as a function of time (, i.e. the age of the SSP).
We can use Eqn. 4 to obtain a distance-independent estimate of the total luminosity of CMa from the RC star counts. With some algebra we obtain:
| (5) |
where is the absolute integrated magnitude in the V-band and is the absolute V magnitude of the Sun. For the present case we adopt and from the SSP models by Maraston (1998, 2005) with , age Gyr and Salpeter Initial Mass Function 111see http://www.mpe.mpg.de/ maraston/SSP. is also adopted according to Maraston (1998), while the duration of the core He-burning phase ( yrs) for a population with age Gyr and has been taken from Pietrinferni et al. (2004)222see http://www.te.astro.it/BASTI/.
In the same way we can use Eqn. 5 by Renzini (1998) to obtain a distance-dependent estimate of the surface brightness near the centre of CMa ():
| (6) |
where is the number of stars in the evolutionary phase within the considered Field of View (FoV, in , for example), and the term encompasses all the theoretical assumptions:
We assume the distance modulus , as derived in Pap-III and in the present contribution.
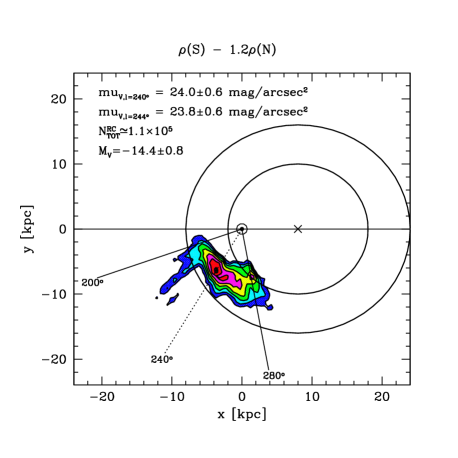
To estimate the observables required by Eqn. 5 and Eqn. 6 ( and ) we proceeded as follows. We selected from our sample the RC stars of both hemispheres within , and 10.0 kpc 16.0 kpc (the adopted selection is displayed in Fig. 12). Then we subtracted the total number of Northern RC stars - rescaled by the usual 1.2 factor - from the total number of Southern RC stars in this region. We obtain an excess of RC stars that can be associated to CMa, corresponding to a total luminosity of . The integrated absolute magnitude is , where the uncertainty includes a per cent variation in the scaling factor adopted to take into account the contribution of the large-scale overdensity (Warp) to the detected excess. This estimate is in excellent agreement with those obtained in Pap-I from M giants and by Martinez-Delgado et al. (2005a) from optical photometry (). We estimate that the inclusion or exclusion from the sample of the stars within the region may change the value of the V-band integrated magnitude by mag.
To estimate the surface brightness we computed the South- North excess of RC stars within a box centred on and on . We chose two different positions to provide estimates of the surface brightness for the centre of the structure as obtained from a distance-selected sample (as in Fig. 9) and from the straight surface density distribution, as in Fig. 8. We obtain a density of RC stars at , corresponding to mag/arcsec2, and RC stars at , corresponding to mag/arcsec2. These values are in reasonable agreement with the results of Martinez-Delgado et al. (2005a) obtained from data at ( mag/arcsec2).
Note that , at fixed , varies from at Gyr to at Gyr, and, for fixed age Gyr, it ranges from at to at . The variation of over the same range of age and metallicity is just of a few per cent (Pietrinferni et al., 2004). Hence the particular choices of the above parameters do not seriously affect our final estimates. Other factors, not completely accounted for, as the uncertainty in the exact position of the center of CMa, the overall extent of the system, and the adopted SSP hypothesis, are expected to be the dominant contributors to the uncertainty of our estimates of the integrated magnitude and of the central surface brightness of the system.
CMa turns out to have a total luminosity and a surface brightness quite similar to those of the Sgr dSph, as already noted in Pap-I, but the above results suggest that it may be slightly more luminous and with a brighter , in agreement with the relation of dwarf spheroidal galaxies (see Martinez-Delgado et al., 2005a, and references therein).
It is interesting to note the striking effect of the relative distance on the number densities for two stellar systems of similar central surface brightness. Monaco et al. (2003) measured a density of RC stars of deg-2 in the central degree of the Sgr dSph, while here we observe just deg-2 at , yet the surface brightness of the two systems is similar. This may largely account for the great difficulty in the identification of the RC in optical CMDs from off-centred fields of deg2 or less as those presented in Pap-II and in Martinez-Delgado et al. (2005a). This argument will be developed further in Sect. 4.4, below.
4.3 How should a nearby galaxy appear?
CMa is by far the nearest dwarf galaxy known, a factor closer than the previous “record holder”, the Sgr dSph (Monaco et al., 2004). This is the main reason why it appears so unusual, at first glance: a structure covering tens of degrees on the sky and with as few as RC stars in its central square degree. This is very far from our idea of the typical dwarf satellite of the Milky Way, that has been acquired by studying much more distant examples. To show that there is nothing unusual in CMa except its distance we undertook the exercise of seeing how the Sgr dSph galaxy would appear if it were placed at the same distance and position as CMa. In the following we will adopt the structural parameters of Sgr (core radius , limiting radius , central surface brightness and axis ratio) as derived by Majewski et al. (2003), the distance from Monaco et al. (2004) and the surface density of Horizontal Branch stars from Monaco et al. (2003).
Fig. 13 shows the core and the limiting contours of Sgr once placed at the distance and position of CMa. The upper panel of Fig. 13 has the same longitude scale as Fig. 9, to allow a direct comparison. The core of the “mock” Sgr shows a major axis of more than () and the overall appearance is strikingly similar to CMa. Note that the limiting contour extends well beyond on the low longitude side, and beyond on the other (). Note also that the outskirts of the “mock” Sgr galaxy extends into the Northern Galactic Hemisphere, up to .
From Eqn. 6 the following relation can be derived between the surface brightness (at any chosen wavelength ) , and the number of stars per given area in a given evolutionary phase () for two stellar systems located at distances and :
| (7) |
The second term on the right hand side of Eqn. 7 displays the effect of distance on the number surface density of a system of a given surface brightness333It has to be noted that the effect of the physical size of a system on the spread of sequences on a CMD weakens with increasing distance. This is an additional factor that favours the easier recognition of distant stellar structures compared to more nearby systems.. To rescale the number surface density of Sgr from to we must assume . In the present case we find that the observed surface number density of Sgr stars should be reduced by a factor 0.075, if the galaxy is placed at the distance of CMa. Hence, in this case, we would observe RC stars deg-2, 10 RR Lyrae deg-2 and 12 Blue Horizontal Branch stars deg-2 in the centre of the Sgr galaxy. This effect fully accounts for the difficulty of detecting clearly-defined sequences of evolved stars in small fields (smaller than 1 deg2) even within the main body of CMa, as well as for the low yield in searches of rare stellar species (as RR Lyrae stars in a system dominated by an intermediate-age and metal rich population, see Kinman, Saha & Pier, 2004; Mateu et al., 2005).
In conclusion, the apparent size of CMa and the number density of its stellar populations are fully compatible with those of a dwarf galaxy similar to Sgr and located at kpc from us.

4.4 Old open clusters in CMa
The possible association of some old open clusters with CMa was already suggested in Pap-I (see also Pap-II; Crane et al., 2003; Frinchaboy et al., 2004). A thorough analysis of these clusters is clearly beyond the scope of the present contribution. However, the use of the Red Clump as a tracer may provide the unique opportunity of placing a few clusters onto the same distance scale as the field population of CMa. In Table 1 we list a number of open clusters selected to be older than Gyr and to lie in the surroundings of the main body of CMa (according to the WEBDA database, Mermilliod, 1995). In particular the first group presented in Tab. 1 is composed of three clusters that directly project onto the main body of CMa (as seen in Fig. 8 and 10, for instance), and for which it has been possible to estimate the K magnitude of the Red Clump from 2MASS photometry. Hence the distance estimates for To 2, AM 2 and Haf 11 have been derived in exactly the same way and under the same assumptions (luminosity of the standard candle and reddening) used for the analysis of the field population performed above. These estimates strongly indicate that To 2, AM 2 and Haf 11 are physically located within the main body of CMa (see Pap-II for further discussion and references). Note that, while AM 2 and Haf 11 lack any radial velocity estimate, To 2 has km/s, fully consistent with the systemic velocity of CMa (Pap III, Pap IV).
| Name | l | b | E(B-V) | [kpc] | ||
| Tombaugh 2 | 232.83 | -6.88 | 0.29 | |||
| Haffner 11 | 242.39 | -3.54 | 0.57 | |||
| Arp-Madore 2 | 248.12 | -5.88 | 0.51 | |||
| Berekeley 36 | 227.38 | -0.59 | 6.1 | |||
| NGC 2243 | 239.48 | -18.01 | 4.4 | |||
| Melotte 66 | 259.56 | -14.24 | 4.3 | |||
| Ruprecht 75 | 276.79 | -4.48 | 4.3 | |||
| CC06 | 238.48 | -4.28 | 4.5 | |||
| Van den Bergh-Hagen 66 | 276.00 | -3.01 | 7.0 | |||
| Saurer 2 | 257.99 | -1.01 | 4.8 | |||
| 444All the reported data, with the exception of those relative to the RC distance of To 2, AM 2 and Haf 11, are drawn from the WEBDA database (Mermilliod, 1995), see http://obswww.unige.ch/webda/. Data for CC06 are from (Ivanov et al., 2002). First group: clusters within , and 4.0 kpc 11.0 kpc, with age Gyr. Second group: clusters within , and 4.0 kpc 11.0 kpc, with age Gyr. |
5 Summary and Conclusions
We have performed a differential analysis of the distribution of the Southern Galactic hemisphere excess of colour-selected Red Clump stars extracted from 2MASS in the region and . Our main aim was to trace the structure of the main body of the newly discovered Canis Major stellar system (Pap-I) and of the stellar component of the southern part of the Galactic Warp (Pap-II, Pap-III).
We have obtained detailed maps of the South-North and North-South overdensities in the Galactic Disc. These maps show that the third and fourth Galactic quadrants () are dominated by a smooth large-scale South-North asymmetry that extends all over the considered half of the Disc and over a large range of heliocentric distances. The above characteristics, the comparisons with the large-scale North-South asymmetries observed in the first and second quadrants () and the comparison with the warped and flared Galactic model of L02 strongly suggest that such a wide South-North overdensity is due to an asymmetry of Galactic scale, in particular the southern lobe of the Warp of the Galactic Disc.
The Canis Major structure, as recognized in Pap-I and Pap-2, appears - in the South-North density maps - as the strongest spatial overdensity of the whole Galactic Disc, either in terms of number density or of statistical significance. Simply subtracting a rescaled version of the Northern hemisphere density map (by a factor 1.2) from the Southern hemisphere density map, the large scale asymmetry attributable to the Galactic Warp is completely removed and Canis Major remains as the only significant overdensity, with a peak at more than 25 . The structure appears elongated along the tangential direction, extending from to . It has a nearly elliptical shape and it is strongly spatially confined, with a HWHM along the line of sight at its center of kpc (in excellent agreement with the results of Pap-I, Pap-III, and Martinez-Delgado et al., 2005a). All the maps show that Canis Major has a roundish core, located at kpc, toward , at a Galactocentric distance of kpc.
The L02 model of the Galactic Warp is unable to predict the existence of Canis Major as a structure of Galactic origin, both on the large and on the local scale. The same has been shown to be true also for the Yusifov (2004) and the Robin et al. (2003) models, in Pap-III and in Pap-II, respectively (see also Fig. 1, above). Within the framework set by the observational evidence listed above, Canis Major appears as a compact and confined stellar system that is “superposed” on the Warp structure (see Fig. 3, for example).
We also investigate the claim made in the recent study by Rocha-Pinto et al. (2005), that Canis Major is an external field of a larger Argo structure, which would be the true centre of the dwarf galaxy remnant accreted onto the Milky Way. The distribution of red clump stars along the line of sight does not support this conclusion, however. Unlike the situation in the Canis Major region, we find no significant spatially-confined structure in the line of sight through Argo. This line of sight, instead, crosses the region of the disc were the large-scale overdensity associated with the Galactic Warp reaches its maximum. We conclude that Argo is most likely not related to Canis Major, and is probably an asymmetry of Galactic origin.
The above observational scenario does not provide the ultimate word on the nature of CMa. Given our poor knowledge of the outermost region of the Galactic Disc and the obvious limitations in current models of the Disc itself, the possibility that CMa is a substructure of the Galactic Disc cannot be excluded yet. However, in this case, we should admit the presence of an unexpected large and very dense substructure and/or local distorsion in the outer Disc, hosting essentially old stars, at odds with, for instance, usual spiral arms.
In our view, the evidence collected here, in Pap-I, Pap-II and by Martinez-Delgado et al. (2005a), together with the kinematics of Canis Major stars as described in Pap-III, Pap-IV and the possible links with the Monoceros Ring (Pap-I, Pap-IV, Penarrubia et al., 2005; Martinez-Delgado et al., 2005b; Dinescu et al., 2005; Conn et al., 2005b) are more naturally explained by the hypothesis that Canis Major is the remnant of the disrupting dwarf galaxy in a nearly-circular and nearly-planar orbit about the centre of the Galaxy. Accepting this hypothesis as the one that best fits all the available data we have derived several physical characteristics of CMa as a stellar system, that are summarised in Table 2. In particular we draw the attention of the reader on the following specific results of the present analysis:
-
•
RC stars provide a quantitative description of CMa that is in full agreement with those obtained from other independent tracers (M giants and MS stars, see Pap-I, Pap-II, Pap-III and Martinez-Delgado et al., 2005a). In particular we obtained a (distance-independent) estimate of the integrated V magnitude and a (distance-dependent) estimate of the central surface brightness in good agreement with those obtained by Martinez-Delgado et al. (2005a) from deep optical photometry of MS stars. We also obtained a distance profile (along the line of sight) of CMa that is essentially indistinguishable from that obtained in Pap-III from M giants. The high degree of self-consistency achieved among the various analyses — using different tracers — may be considered also as a validation of our criterion of selection of RC stars. We confirm, with independent tracers and an independent distance scale with respect to Pap-I and Pap-III, that the mean distance of CMa is kpc, around .
-
•
We have detected a clear relation between the mean distance to CMa and Galactic longitude within the main body. The derived spatial orientation of the system is in good agreement with the predictions of the N-body simulation presented in Pap-IV, that models CMa as a dwarf galaxy being accreted in a planar orbit onto the disc of the Milky Way.
-
•
Using the same dataset (2MASS), the same tracer (RC stars) and the same distance scale as in the analysis summarised above, we showed that the old open clusters AM 2, To 2 and Haf 11 are located (in space) within the main body of Canis Major.
| kpc | |
| 555As derived from Fig. 8. Adopting the distance selected sample of Fig. 10, is obtained (see Sect. 3.2.1). | |
| 666As derived from Fig. 8. | |
| kpc | |
| x | kpc |
| y | kpc |
| z | kpc |
| mag | |
| mag/arcsec2 | |
| mag/arcsec2 | |
| kpc |
In summary, the present study fully (and independently) confirms the results presented in previous papers of this series and in Martinez-Delgado et al. (2005a): Canis Major has the size, the luminosity and the kinematics typical of a large dwarf galaxy, seen during the last stages of its disruption within the tidal field of the Milky Way (see also Sbordone et al., 2005). While a Galactic origin for CMa cannot be definitely ruled out with the present data, the dwarf galaxy hypothesis appears as best suited to fit the overall observational scenario.
While further details emerge — as, for example, the distance-longitude gradient — we begin to obtain a clearer view of this challenging system. Future studies should try to overcome the several observational challenges posed by this nearby, low latitude object, to unveil the details of its stellar content (age, chemical composition) and to clarify its possible connection with the Monoceros Ring.
Acknowledgments
The financial support of INAF and MIUR is acknowledged. M.B. is grateful to the ULP/Observatoire de Strasbourg for the kind hospitality during a period in which a significant part of the analysis presented in this paper was performed. The Referee, M. López-Corredoira, is acknowledged for his very helpful comments that led us to a much deeper analysis of the scientific problems considered here. This publication makes use of data products from the Two Micron All Sky Survey, which is a joint project of the University of Massachusetts and the Infrared Processing and Analysis Center/California Institute of Technology, funded by the National Aeronautics and Space Administration and the National Science Foundation. This research has made use of NASA’s Astrophysics Data System Abstract Service. The assistance of P. Montegriffo in the development of the software required for the present analysis is also acknowledged.
References
- Abadi et al. (2003b) Abadi M.G., Navarro J.F., Steinmetz M., Eke V.R., 2003b, ApJ, 597, 21
- Abadi et al. (2003a) Abadi M.G., Navarro J.F., Steinmetz M., Eke V.R., 2003a, ApJ, 591, 499
- Babusiaux & Gilmore (2005) Babusiaux C., Gilmore G., MNRAS, 358, 1309
- Bellazzini, Ferraro & Ibata (2000) Bellazzini M., Ferraro F.R., Ibata R., 2002, AJ, 124, 915
- Bellazzini, Ferraro & Ibata (2003a) Bellazzini M., Ferraro F.R., Ibata R., 2003a, AJ, 125, 188
- Bellazzini et al. (2003b) Bellazzini M., Ibata R., Ferraro F.R., Testa V., 2003b, A&A, 405, 577
- Bellazzini, Ibata & Ferraro (2003c) Bellazzini M., Ibata R., Ferraro F.R., 2003c, in Satellites and Tidal Tails, D. Martinez-Delgado and F. Prada Eds., S. Francisco, ASP, ASP Conf. Series, Vol. 327, 220
- Bellazzini et al. (2004a) Bellazzini M., Ibata R., Monaco L., Martin N., Irwin M.J., Lewis G.F., 2004a, MNRAS, 354, 1263 (Pap-II)
- Bellazzini et al. (2004b) Bellazzini M., Ferraro F.R., Sollima A., Pancino E., Origlia L., 2004b, A&A, 424, 199
- Binney (1992) Binney J., 1992, ARAA, 30,51
- Bonifacio, Monai & Beers (2000) Bonifacio P., Monai S., Beers T.C., 2000, AJ, 120, 2065
- Brown et al. (1996) Brown J.A., Wallerstein G., Geisler D., Oke J.B., 1996, AJ, 112, 1551
- Carraro et al. (2005) Carraro G., Vàzquez R.A., Moitinho A., Baume G., 2005, ApJ, 630, L153
- Cole (2001) Cole, A.A., 2001, ApJ, 559, L17
- Conn et al. (2005a) Conn B., Lewis G.F., Irwin M.J., Ibata R.A., Irwin J.M., Ferguson A.M.N., Tanvir N., 2005a, MNRAS, 362, 475
- Conn et al. (2005b) Conn B., Martin N., Lewis G.F., Ibata R.A., Bellazzini M., Irwin M.J., 2005b, MNRAS Lett., in press (astro-ph/0508366)
- Crane et al. (2003) Crane J.D., Majewski S.R., Rocha-Pinto H., Frinchaboy P.M., Skrutskie M.F., Law R.D., 2003, ApJ, 594, L119
- Cutri et al. (2003) Cutri et al., 2003, Explanatory Supplement to the 2MASS All Sky Data Release, http://www.ipac.caltech.edu/2mass/releases/allsky/doc/explsup.html
- Dinescu et al. (2005) Dinescu D.I., Martínez-Delgado D., Girard T.M., Peñarrubia J., Rix H.W., Butler D., van Altena W.F., 2005, ApJ Letters, in press (astro-ph/0508247)
- Djorgovski & Sosin (1989) Djorgovski S., Sosin C., 1989, ApJ, 341, L13
- Ferraro et al. (1999) Ferraro F.R., Messineo M., Fusi Pecci F., de Palo A., Straniero O., Chieffi A., Limongi M., 1999, AJ, 118, 1738
- Forbes, Strader & Brodie (2004) Forbes D.A., Strader J., Brodie J.P., 2004, AJ, 127, 3394
- Frinchaboy et al. (2004) Frinchaboy P.M., et al., 2004, ApJ, 602, L21
- Hammersley et al. (1995) Hammersley P. L., Garzon F., Mahoney T., Calbet X., 1995, MNRAS, 273, 206
- Helmi (2004) Helmi A., 2004, ApJ, 610, L97
- Helmi, White & Springel (2003) Helmi A., White S.D.M., Springel V., 2003, MNRAS, 339, 834
- Helmi et al. (2003) Helmi A., Navarro J., Meza A, Steinmetz M., Eke V., 2003, ApJ, 592, L25
- Ibata et al. (1994) Ibata, R.A., Irwin, M.J., Gilmore, G., 1994, Nature, 370, 194
- Ibata et al. (1997) Ibata, R.A., Wyse, R.F.G., Gilmore, G., Irwin, M.J., & Suntzeff, N.B., 1997, AJ, 113, 634
- Ibata & Lewis (1998) Ibata R., Lewis G., 1998, ApJ, 500, 575
- Ibata et al. (2001) Ibata R., Lewis G., Irwin M., Totten E., Quinn T., 2001, ApJ, 551, 294
- Ibata et al. (2002) Ibata R., Lewis G., Irwin M., Cambrésy L., 2002, MNRAS, 332, 921
- Ibata et al. (2003) Ibata R., Irwin M., Lewis G., Ferguson A., Tanvir N., 2003, MNRAS, 340, L21
- Ivanov et al. (2002) Ivanov V.D., Borissova J., Pessev P., Ivanov G.R., Kurtev R., 2002, A&A, 394,1
- Ivezic et al. (2000) Ivezic, Z., et al., 2000, AJ, 120, 963
- Johnston, Sackett & Bullock (2001) Johnston K., Sackett P.D., Bullock J.S., 2001, ApJ, 557, 137
- Johnston, Law & Majewski (2005) Johnston K.V., Law D.R., Majewski S.R., 2005, ApJ, 619, 800
- Kinman, Saha & Pier (2004) Kinman T.D., Saha A., Pier J.R., 2004, ApJ, 605, L25
- Kubiak et al. (1992) Kubiak M., Kaluzny J., Krzemińsky W., Mateo M., 1992, Acta Astronomica, 42, 155
- Kuijken & Garcia-Ruiz (2001) Kuijken K., Garcia-Ruiz I. ,2001, in Galaxy Disks and Disk Galaxies, J.G. Funes, S. J. and Enrico Maria Corsini Eds., San Francisco: ASP , ASP Conf. Series, Vol. 230, 401
- López-Corredoira et al. (2002) López-Corredoira M., Cabrera-Lavers A., Garzón F., Hammersley P.L., 2002, A&A, 394, 883
- Law, Johnston & Majewski (2005) Law D.R., Johnston K.V., Majewski S.R., 2005, ApJ, 619, 807
- Majewski et al. (2003) Majewski S., Skrutskie M., Weinberg M., Ostheimer J., 2003, ApJ, 599, 1082
- Maraston (1998) Maraston C., 1998, MNRAS, 300, 872
- Maraston (2005) Maraston C., 2005, MNRAS, 362, 799
- Martin et al. (2004a) Martin N., Ibata R.A., Bellazzini M., Irwin M.J., Lewis G.F., Dehnen W., 2004a, MNRAS, 348, 12 (Pap-I)
- Martin et al. (2004b) Martin N., Ibata R.A., Bellazzini M., Conn B., Irwin M.J., Lewis G.F., McConnachie A.W., 2004b, MNRAS, 355, L33 (Pap-III)
- Martin et al. (2005) Martin N., Ibata R.A., Conn B., Lewis G.F., Bellazzini M., Irwin M.J., 2005, MNRAS, submitted
- Martinez-Delgado et al. (2005a) Martinez-Delgado D., Butler D.J., Rix H.-W., Franco I., Peñarrubia J., 2005a, ApJ, in press (astro-ph/0410611)
- Martinez-Delgado et al. (2005b) Martinez-Delgado D., Penarrubia J., Dinescu D., Butler D.J., Rix H.-W., 2005b, in Near field Cosmology with Dwarf Elliptical Galaxies, H. Jerjen and B. Binggeli Eds., IAU Coll. 198, in press (astro-ph/0506012)
- Mateo (1998) Mateo M., 1998, ARA&A, 36, 435
- Mateu et al. (2005) Mateu C.E., Vivas A.K., Zinn R., Miller L., 2005, in International Workshop Astronomia Dinamica en Latino-America (ADeLA 2004), C. Abad, A. Bongiovanni and Y. Guillen Eds., Rev. Mex. A.A. Conf Ser., in press (astro-ph/0504333)
- Mermilliod (1995) Mermilliod J.-C., 1995, in Information and On-Line Data in Astronomy, D. Egret and M.A. Albrecht Eds., Dordrecht, Kluwer, 127
- Monaco et al. (2003) Monaco, L., Bellazzini, M.,Ferraro, F.R., Pancino, E., 2003, ApJ, 597, L25
- Monaco et al. (2004) Monaco, L., Bellazzini, M.,Ferraro, F.R., Pancino, E., 2004, 353, 874
- Momany et al. (2004) Momany Y., Zaggia S.R., Bonifacio P., Piotto G., De Angeli F., Bedin L.R., Carraro G., 2004, A&A, 421, L29 [M04]
- Morrison et al. (2000) Morrison H.L., Mateo M., Olszewski E.W., et al., 2000, AJ, 119, 2254
- Newberg et al. (2002) Newberg H., et al. 2002, ApJ, 569, 245
- Newberg et al. (2003) Newberg H., et al. 2003, ApJ, 596, L191
- Ortolani, Bica & Barbuy (1995) Ortolani S., Bica E., Barbuy B., 1995, A&A, 300, 726
- Paczynski & Stanek (1998) Paczynski B., Stanek K., 1998, ApJ, L219
- Penarrubia et al. (2005) Penarrubia J., Martinez-Delgado D., Rix H.-W., et al., 2005, ApJ, 626, 128
- Pietrinferni et al. (2004) Pietrinferni A., Cassisi S., Salaris M., Castelli F., 2004, ApJ, 612, 168
- Porcel et al. (1997) Porcel C., Battaner E., Jiménez-Vicente J., 1997, A&A, 322, 107
- Renzini (1998) Renzini A., 1998, AJ, 115, 2459
- Renzini & Buzzoni (1986) Renzini A., Buzzoni A., 1986, in Spectral evolution of galaxies, C. Chiosi and A. Renzini Eds., Dordrecht, Reidel, p. 135
- Renzini & Fusi Pecci (1988) Renzini A., Fusi Pecci F., 1988, ARAA, 26, 1999
- Rieke & Lebofsky (1985) Rieke G.H, Lebofsky M.J., 1985, ApJ, 290, 116
- Robertson et al. (2005) Robertson B., Bullock J.S., Font A.S, Johnston K.V., Hernquist L., 2005, ApJ, submitted (astro-ph/0501398)
- Robin et al. (2003) Robin A.C., Reylé S., Derrière S., Picaud S., 2003, A&A, 409, 523 [R03]
- Rocha-Pinto et al. (2003) Rocha-Pinto H., Majewski S., Skrutskie M., Crane J., 2003, ApJ, 594, L115
- Rocha-Pinto et al. (2005) Rocha-Pinto H., Majewski S., Skrutskie M., Patterson R.J., 2005, ApJ L, submitted (astro-ph/0504122)
- Salaris & Girardi (2002) Salaris M., Girardi L., 2002, MNRAS, 337, 332
- Sarajedini et al. (2002) Sarajedini A., Grochlski A.J., Levine J., Lada E., 2002, AJ, 124, 2625
- Sbordone et al. (2005) Sbordone L., Bonifacio P., Marconi G., Zaggia S., Buonanno R., 2005, A&A, 430, L13
- Schlegel, Finkbeiner & Davis (1998) Schlegel D., Finkbeiner D., Davis M., 1998, ApJ 500, 525 (SFD98)
- Vig, Ghosh & Ojha (2005) Vig S., Ghosh S.K., Ojha D.K., 2005, A&A, 436, 867
- White & Rees (1978) White S., Rees M., 1978, MNRAS, 183, 341
- White & Frenk (1991) White S., Frenk C., 1991, ApJ, 379, 52
- Yanny et al. (2003) Yanny B., et al. 2003, ApJ 588, 824
- Yusifov (2004) Yusifov I., 2004, in The Magnetized Interstellar Medium, B. Uyaniker, W. Reich & R. Wielebinski Eds., in press (astro-ph/0405517)
Appendix A Contamination by dwarfs
To study the effect of the contamination by dwarfs in our color-selected sample of candidate RC stars on subtracted density maps, we recur to the Galactic model by Robin et al. (2003). This model includes the effect of the Galactic Warp and of the disc flaring, and takes into account the off-plane position of the Sun. The main advantages of using the R03 model for our purpose can be summarized as follows:
-
•
we can obtain (K,J-K) CMDs of the synthetic samples, therefore we can apply exactly the same selections and analysis adopted for the observed sample;
-
•
synthetic stars from the R03 models are individually classified into different species with the flag , hence the discrimination of dwarfs from giants is straightforward. In particular stars having are giants, those with are subgiants and those with are dwarfs. Since the synthetic CMDs reveal that both and stars can fall into our selection color-window, from now on we will consider all the stars of class 4 or 5 as dwarfs.
The obvious disadvantage is that the result will not reflect the real Galaxy but just a model of it. However, in the present context, the unavoidable approximations inherent to a Galactic model should not represent a major concern. In the following we will mainly focus on the magnitude range , that is the range enclosing essentially all the stars that contribute to the main structures we discuss in the present paper, and CMa in particular.
To allow the possibility of a direct comparison with observed CMDs (a very useful sanity check) and to limit the dimensions of the synthetic catalogues we choose to work on deg2 windows in the latitude range , i.e. exactly the same as the observed sample whose CMD is shown in Fig. 1. To study the dwarf contamination toward different directions of interest, we selected three windows at , (i.e., the same as Fig. 1), and . We extracted from the model the corresponding samples in the Southern and Northern Galactic hemispheres, at the above longitudes, for a total of six catalogues. The extraction was performed using the large field option, that takes into account the variations of the population across the considered fields 777See the web form of the R03 model and the explanations provided therein, http://bison.obs-besancon.fr/modele/.. To reproduce as well as possible the real case we let the model include the effects of interstellar extinction according to the default assumptions included in the web form.
From the observed dataset of Fig. 1 we fitted the following relations for the photometric errors in K(J) as a function of - not extinction-corrected - K(J) magnitude:
| (8) |
| (9) |
To simulate realistically the effect of photometric errors on synthetic stars we computed and for each of them with the above equations, we randomly extracted a Gaussian deviate (, positive or negative, in units) for each of them, and then we added the resulting synthetic errors and to their K and J magnitudes, respectively. After that, we corrected the synthetic stars for extinction, using the value associated by the model to each star. In the following J and K stand for extinction-corrected magnitudes, as in the rest of the paper.
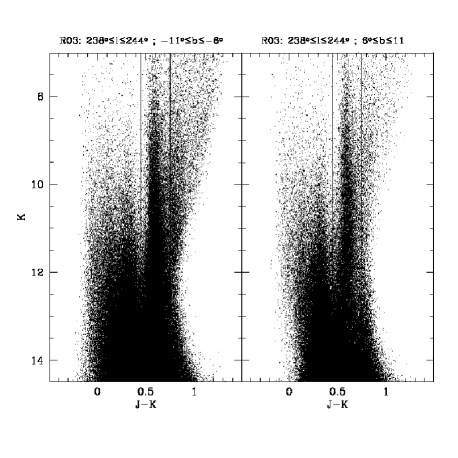
The above procedure should provide synthetic samples as similar as possible to the observed ones, including the effect of photometric errors. The comparison of the final synthetic CMDs for the window (Southern and Northern hemisphere) shown in Fig. A1 with the observed CMD of Fig. 1 demonstrates that this objective has been achieved: the overall similarity between observed and synthetic CMDs is striking. In Fig. A1 we report also the adopted color window we use to select RC stars in the observed sample. A shift of mag in J-K has been applied to all the synthetic samples to center the vertical plume of RC stars within the selection window, as it is in the observed case. This small mismatch in color is likely due to a non-perfect match between the theoretical star tracks used by the R03 model and real stars (quite a usual occurrence) as well as to tiny differences in the adopted extinction laws. In any case the following results are essentially unaffected by the small color shift applied. In the following we will consider only syntethic stars falling in our color-selection window. Hence, when we speak of dwarfs we mean stars of class 4 or 5 (R03) having , and for giants we mean stars of class 3 having , that is, the stars that we would have selected as RC stars in our analysis.
Before proceeding with our set of tests, Fig. A1 deserves a few comments. It is quite clear that there is a strong asymmetry between the Southern and Northern samples: the Southern sample contains many more stars and the difference is particularly evident in the RC plume. This is the effect of the Warp included in the model. However the comparison of the LFs of the observed (Fig. 1, left panel) and of the synthetic (Fig. A1, left panel) Southern samples shown in the right panel of Fig. 1 demonstrates that (a) the R03 model provides an excellent overall representation of the observed distribution of stars in the considered color window (except for the total normalization, which appears too large by a factor ), and (b) it still fails to reproduce the strong bump in the observed LF around , i.e. the putative RC of CMa. This comparison is fully consistent with the coesistence of the Galactic Warp and an additional stellar system, CMa. Finally, the excellent agreement between the syntetic and observed LFs outside the range, seems to confirm that our samples are essentially complete down to , as stated in Cutri et al. (2003).

In Fig. A2 the fraction of dwarfs falling into our color-selection as a function of K magnitude () is shown for the Northern (open squares) and Southern (crosses) samples for the three selected directions. There are several interesting conclusions that can be drawn from this plot:
-
•
First of all, since the line of nodes of the warp included in the R03 model lies exactly toward the direction, any South-North difference in and/or in the detected South-North asymmetries in the sample must be due to the effect of the pc displacement of the Sun to the North of the Galactic Plane. The upper panel of Fig. A2 shows that difference in is very small, less than 5 per cent in any bin for and 1 per cent in the whole range. Moreover, the South-North difference in giants at is 5 per cent of that at and 2 per cent of that at . Finally the South-North difference in the total number of color selected RC stars at is 12 per cent of that at and 6 per cent of that at . The conclusion is that the off-plane position of the Sun has very little effect both on the contamination by dwarfs and on the amplitude of observed South-North asymmetries, for the applications considered here. Hence our decision to neglect it in the analysis described in this paper appears to be fully justified.
-
•
In the range most relevant for the present study () is quite large, reaching the 80 per cent level at , in some cases.
-
•
The overall degree of contamination is quite similar independent of the considered directions, from the Anticenter to .
-
•
There are significant differences in the Northern and Southern toward and , up to per cent in some bins. However is always higher in the Northern hemisphere than in the Southern one. It appears that, according to the R03 model, N-S differences in the contamination by dwarfs are working against the detection of real overdensities in the Southern hemisphere.
The latter result may appear puzzling at a first glance, but it can be easily explained by looking into the synthetic samples. It turns out that it is due to the presence of a significant South-North asymmetry at large Galactocentric distances (i.e. the Warp) that is much larger in giants than in dwarfs, in the magnitude ranges of interest. For example, in the range , at the South-North ratio of dwarf density is while for giants . Therefore, even if there are more dwarfs in the South than in the North, the imbalance in giants is much larger and the final is consequently larger in the North (76 per cent) than in the South (50 per cent). At , , while , in the same range of magnitudes. This implies that in presence of a distant South-North asymmetry (as the Warp, as in the R03 model we are presently considering, or CMa, or both), the observed imbalance in dwarfs is small in this magnitude range, such that the contribution by dwarfs essentially disappears when Southern and Northern counts are subtracted.
The above results drive us to the two key questions we have to answer to really check the reliability of the results of the present paper:
-
1.
What is the contribution of dwarf contamination to subtracted densities?
-
2.
Is our observable, the subtracted density of color selected RC stars , a good tracer of the real overdensity of giants? In other words, is it a good estimator of the quantity we are interested in ()?

Fig. A3 answers to the first question. There we plot the fraction of the total S-N density difference that is due to dwarfs
as a function of magnitude, for the three considered directions. The subscript T stands for TotalDwarfsGiants. The ratio of the total Southern-to-Northern density is also reported within each panel. This plot shows that in absence of a real South-North asymmetry (, ) the contribution is quite significant ( 40per cent) for . On the other hand, toward directions that cross the Warp asymmetry (, ) the dwarf contribution remains lower than 30 per cent everywhere, for . Hence, even in a regime of strong contamination by dwarfs, the effects on South-North subtraction are quite limited for and in the presence of an overdensity like the Warp and/or CMa. On the other hand, our subtracted maps may be significantly affected (or even dominated, in some cases) by dwarf contamination around and for . It is very interesting to note that in those regions we see a low-significance and smooth South-North residual (Fig. 3) that completely disappears when we subtract by the rescaled Northern density map (Fig. 5). On the other hand all the structured overdensities we deal with in this paper lie in the region where dwarfs provide a minor contribution to the subtracted densities ( and ). Within this context, there is another interesting point worth considering. Since the contribution of dwarfs to our subtracted densities grows continuously with magnitude even for , if our maps were seriously affected by dwarf contamination we would expect to see a corresponding growth of density with heliocentric distance. On the contrary, in the direction of CMa we see both a growth and a decrease of the density (see Figs. 3 and 5). The distance profile of Fig. 11 shows that toward the subtracted density reaches a maximum at kpc, corresponding to , and then essentially falls to zero at kpc, corresponding to , a completely different profile with respect to what is expected from a distribution of Galactic dwarf stars. This occurrence strongly suggests that dwarfs cannot have a major role in determining the observed distribution of the CMa overdensity. The same argument is valid also when considering the trend of contamination of subtracted densities as a function of Galactic longitude. Since the degree of contamination grows toward , if dwarfs were dominant contributors to the subtracted density we should see the maximum density toward . On the contrary, the density in that direction is low and smooth, while it is much higher and more strongly peaked toward .

Fig. A4 tries to answer question (ii), above. This is simply a plot of the S-N density difference in the total number of stars selected in color as RC candidates with our technique (i.e., our observable ), versus the actual difference in the S-N density of giants (i.e. the quantity we want to estimate, ), in the range , for the three directions we are considering. The correlation between and is very strong and essentially linear. Moreover the cofficient of the linear best-fit model is near unity, hence our observable appears as an excellent estimator of the true South-North density difference in giants, at least in the presence of an asymmetry like the warp embedded in the R03 model.
In summary, based on the above experiments with the R03 Galactic model, we can conclude that:
-
•
The neglection of the displacement of the Sun with respect to the Galactic plane has very little effect on our analysis, and can be safely ignored.
-
•
While our samples of color-selected RC stars may be heavily contaminated by dwarfs, the effects of the contamination are much lower on the subtracted-density maps. The contribution of dwarfs to the “observed” is lower than 30 per cent for toward and , and much lower than this for . Note that these numbers take into account only known Galactic components, the presence of an extra asymmetry in the considered range of distances (i.e. CMa, see Fig. 1) would further reduce the rôle of dwarfs.
-
•
The observable we adopt () appears to trace very well the true South-North imbalance of giants under the realistic conditions provided by the R03 model.
It is conceivable that the CMa overdensity we observe using color-selected putative RC stars may be in fact produced by an unexpected asymmetry in dwarfs. However the dwarfs contributing to our counts in the range have heliocentric distances 0.0 kpc 4.5 kpc. Their distance distribution shows a strong peak at , the mean is kpc and the standard deviation is kpc, and 89 per cent have kpc. Hence a strong and very compact clump of dwarfs888Actually it must be significantly more compact than the distribution of RC stars we attribute to CMa, since the selected dwarfs would span a much larger range of absolute magnitudes, with respect to RC stars. would have to be present in the Southern hemisphere, at kpc from the Sun toward , a feature that is obviously not present in the R03 model. As far as we know there is no report in the literature of such a local overdensity. Finally, it should be recalled that the position and size of the RC overdensity studied here matches very well those derived for CMa with other tracers (M giants and MS stars) that are much less affected by contamination from spurious sources.