Testing the massive disk scenario for IRAS 18089-1732
Abstract
Investigating in more detail the previously suggested massive disk scenario for the High-Mass Protostellar Object IRAS 18089-1732, we observed the source in the 860 m band with the Submillimeter Array in various spectral lines and the submm continuum emission at (sub-)arcsecond spatial resolution. Fifty spectral lines from eighteen different species spanning upper level energy states between 17 and 747 K were detected. One of the assumed best tracers for massive disks, CH3CN, is optically thick and does not allow a further disk investigation. However, the complex molecule HCOOCH3 appears optically thin and exhibits a velocity shift across the central core perpendicular to the emanating outflow. This signature is comparable to well-known low-mass disks and confirms the detection of a massive rotating structure likely associated with the central accretion disk. Assuming equilibrium between centrifugal and gravitational force, the estimated mass for this rotating structure is 16/(sin) M⊙ (with the unknown inclination angle), of the same order as the gas mass derived from the continuum emission. Therefore, in contrast to low-mass disks, a considerable amount of the central gas mass is associated with the rotation, implying that massive disks may not be Keplerian. A temperature estimate based on the CH3CN(19–18) K-ladder results in K, thus a hot core has already formed in this region. An analysis of the submm continuum emission reveals even at this high spatial resolution only one isolated massive dust core without any detectable companions down to mass limits between 0.2 and 3 M⊙ (depending on the assumed temperature). Potential implications for the massive cluster formation are discussed. The radial intensity distribution of the core is highly non-symmetric, outlining the difficulties of density structure investigations based on radial averaging.
1 Introduction
The phenomenon of massive protostellar disks is one of the central questions in high-mass star formation. Indirect indicators for the existence of massive disks has been accumulated over recent years but unambiguous evidence for massive disks is still missing. High-spatial-resolution observations of massive molecular outflows revealed that they could be as collimated as their low-mass counterparts (e.g., Beuther et al. 2002a; Gibb et al. 2003; Garay et al. 2004; Davis et al. 2004) indicating some underlying protostar-disk interaction as the driving mechanism. Furthermore, there have been various approaches to study massive disks in a more direct way. Infrared and mm continuum observations find interesting disk-candidates (e.g., Shepherd et al. 2000; Chini et al. 2004), but they lack the necessary velocity information to provide kinematic proof of potential accretion disks. Contrary to this, Class II CH3OH and H2O maser emission found disk-like kinematic signatures in a few cases (e.g., Torrelles et al. 1996; Pestalozzi et al. 2004), but since maser emission is very selective and requires special conditions such studies do not allow a more statistical investigation of massive disk properties. The most promising approach to find and investigate disks in high-mass star formation appears to be the observation of thermal line emission which should be sensitive to the gas properties and kinematics of the disks. Various investigations have been directed this way: one of the first massive disk studies were the CH3CN observations toward IRAS 20126+4104 which found a velocity gradient perpendicular to the outflow (Cesaroni et al., 1997, 1999). More recently, Beltrán et al. (2004) also used CH3CN observations to analyze potential rotating structures toward two even more massive high-mass star-forming regions, and again they found velocity gradients perpendicular to observed molecular outflows. A different approach was followed by Zhang et al. (1998, 2002) who investigated the disks of IRAS 20126+4104 and AFGL5142 by the means of NH3 observations. While these approaches are promising, there is still no unambiguous evidence for disks in high-mass star formation. Even more troubling is the fact that we still do not know which is the best molecular transition to study massive disks, CH3CN seems to be a promising candidate and NH3 works in some cases as well, but we also know a number of sources where the NH3 observations apparently do not trace the disks (Zhang, priv. comm.). One of the challenges of the coming years is to establish a reliable procedure to find massive disks and study their properties, which is important to constrain any theory of high-mass star formation.
With this problem in mind, we began high-spatial-resolution observations of the HMPO IRAS 18089-1732 in various molecular lines with the Submillimeter Array (SMA111The Submillimeter Array is a joint project between the Smithsonian Astrophysical Observatory and the Academia Sinica Institute of Astronomy and Astrophysics, and is funded by the Smithsonian Institution and the Academia Sinica.) last year (Beuther et al., 2004b, a). This source at a distance of kpc with a luminosity of L⊙ is part of a sample of 69 HMPOs intensively studied over recent years by Sridharan et al. (2002); Beuther et al. (2002b, c, d). The single-dish millimeter continuum observations reveal a gas mass of M⊙, and H2O and Class II CH3OH maser emission as well as a weak cm continuum source (0.9 mJy) has been detected at the core center. Previous SMA observations found an outflow in north-south direction and HCOOCH3 emission centered at the mm continuum peak exhibiting a velocity gradient approximately perpendicular to the outflow (Beuther et al., 2004a). The latter observations were interpreted as indicative of a possible rotating disk-like structure around the central protostar which could be influenced by the outflow as well as infall. The SiO outflow emission is slightly offset from the mm continuum peak (), allowing to speculate about a potential secondary source undetected so far. Observations of a series of other molecular transitions revealed that many of them trace to some degree the outflow as well, and only a few remain confined to the core center, CH3OH being one of the latter species (Beuther et al., 2004b). However, some of the typical disk-tracers like CH3CN were not covered by the spectral setup. Furthermore, the spatial resolution was marginal for our purposes ( corresponding to approximately 7000 AU at the given distance). Therefore, we followed up on the previous observations via higher spatial resolution () observation covering a CH3CN series as well. These observations are intended to get a better understanding of the potential massive accretion disk as well as to investigate which molecular lines are best suited for future massive disk studies.
2 Observations
We observed the HMPO IRAS 18089-1732 in 3 nights during the summer of 2004 with the SMA in two configurations covering unprojected baseline lengths between 20 and 340 m. The phase center was R.A. 18:11:51.4/Dec. -17:31:28.5 (J2000) and the tuning frequency 349.45 GHz in the upper sideband (). Two out of the three nights the weather was good with a zenith opacity of 0.18 at 348 GHz – scaled from the 225 GHz opacity measurement of the NRAO tipping radiometer operated by the CSO . In the third night, the weather was worse with , the latter data were weighted considerably lower in the data reduction. The spectral resolution over the whole bandpass of 4 GHz (upper + lower sideband) was 0.8125 kHz corresponding to a velocity resolution of km/s. The initial flagging and calibration was done in the IDL superset MIR originally developed for the Owens Valley Radio Observatory (Scoville et al., 1993) and adapted for the SMA222The MIR cookbook by Chunhua Qi can be found at http://cfa-www.harvard.edu/cqi/mircook.html.. The imaging and data analysis was conducted in MIRIAD. The passband calibration was derived from a variety of different sources for each track including Jupiter, Neptune, Uranus, Callisto, Mars and 3c279 (for the largest baselines). Flux calibration was conducted with observations of Uranus, Callisto and 3c279 (again for the largest baselines). The flux density scale is estimated to be accurate within 15%. For the phase and amplitude calibration we used regularly interleaved observations of the quasar NRAO530 (about from the target source) with an approximate flux of Jy at the given frequency. We applied different weightings for the continuum and line data resulting in synthesized beams for the continuum of and for the lines of . The 1 rms of the continuum image is 35 mJy.
3 Results
3.1 860 m continuum emission
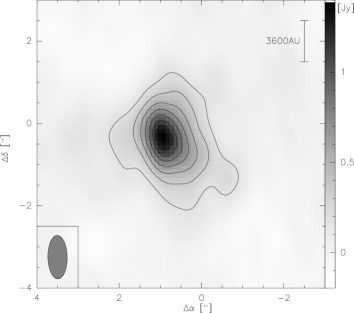
Figure 1 shows the continuum image with . In spite of some structure, it remains a single source and does not split up into multiples. Two corresponding amplitude versus uv-distance plots are shown in Figure 2. While the shortest baselines show a halo component, the range between 50 and 90 k appears rather flat consistent with the previously modeled point source (Su et al., 2004). However, from 90 k onward the flux densities decrease further, indicating additional sub-structure on the corresponding spatial scales. Beyond 200 k, the S/N ratio is low, and in the 5 k bin plot (Fig. 2 left) one cannot differentiate the emission from statistical noise. Averaging the data into larger 40 k bins to increase the S/N ratio (Fig. 2 right), we can discern emission above the noise. The large baseline data are consistent with a point source of approximate flux density Jy. The integrated flux density of the shorter baseline halo component can be fitted with a Gaussian to Jy.
As a continuation of our radial profile study toward this source with single-dish 1.2 mm continuum observations (with the MAMBO array at a spatial resolution of , Beuther et al. 2002b), we now attempted to derive radial intensity profiles from these higher spatial resolution data. Since the beam is elliptical, we extracted a strip in the east-west direction (smallest beam size of ) and derived the profiles in the directions of positive and negative R.A. offsets, respectively. The results and some fits to the data are shown in Figure 3. Obviously, the intensity profiles do vary significantly in the two directions with power-law indices between and . Thus, the typical approach of circular averaging is not useful here. Nevertheless, to better quantify the errors often introduced by circular averaging, we restored the image with a circular beam of and derived the intensity profile using circular averaging. Not surprisingly, the derived power law index (not shown) is between the ones shown in Figure 3 with an index of . One result to be kept in mind is that circular averaging has to be done cautiously, at least at this spatial resolution.
Table 1 shows the submm continuum peak and integrated intensity . Comparing these values with the previously derived continuum flux densities (Beuther et al., 2004a), we find nearly the same peak intensity but about three times the integrated flux densities. The synthesized beam of the new dataset is a bit smaller than that of last years observations ( vs. ). However, as shown in Fig. 2, data k do not contribute strongly to the measurable flux densities, and thus finding similar peak fluxes densities in both datasets is reassuring that the calibration of the SMA is reliable. The fact that we observe significantly higher integrated flux densities in the new dataset is due to the better uv-coverage we have this time. Due to this better uv-coverage we suffer less from missing short spacings and recover more of the extended halo emission. Nevertheless, measuring the integrated flux densities of the 850 m single-dish SCUBA observations (Williams et al., 2004) in an aperture with a radius of , we get an integrated flux density of Jy. Thus, we only recover about 20% of the single-dish flux densities with the SMA, the remaining 80% mostly reside in a larger-scale halo filtered out by the interferometer, and a smaller fraction of the integrated flux is lost because of the negative side-lobe emission.
Following Hildebrand (1983), assuming the submm continuum emission to be due to optically thin dust emission, we calculate the gas mass and column density of the central core. The procedure and equations we use are outlined in Beuther et al. (2002b). Based on the spectral index analysis from Beuther et al. (2004a) we assume a dust opacity index . Furthermore, we calculate the gas mass on the one hand using a typical hot core temperature of 100 K to better compare it with the results by Beuther et al. (2004a), and on the other hand using the temperature of 350 K derived from the CH3CN observations (see §3.2.1). As discussed in (Beuther et al., 2002b), the errors are dominated by systematics, e.g., the exact knowledge of the dust opacity index or the temperature. While we take different temperatures into account the other parameters are more difficult to acknowledge and we estimate the masses and column densities to be correct within a factor 5.
Assuming 100 K we get a gas mass of 45 M⊙ close to the 38 M⊙ derived last year from the 1.3 mm continuum observations (Beuther et al., 2004a), whereas using the 350 K results in a lower gas mas of 12 M⊙. The values will be compared below with the masses derived from the kinematic HCOOCH3 observations (see §3.2.2). Regarding the gas column density , both temperatures result in values of the order cm-2, close to the column densities previously derived from the lower spatial resolution 1.3 mm data (Beuther et al., 2004a). Assuming a relation between column density and extinction of we get a visual extinction of the order 1000.
3.2 Spectral line data
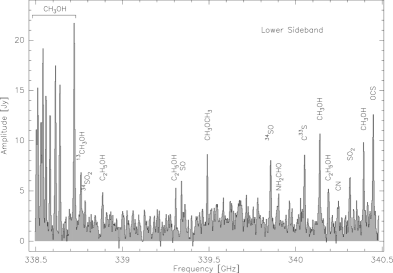
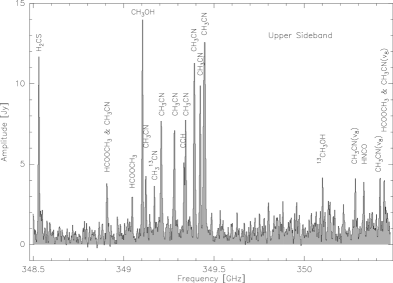
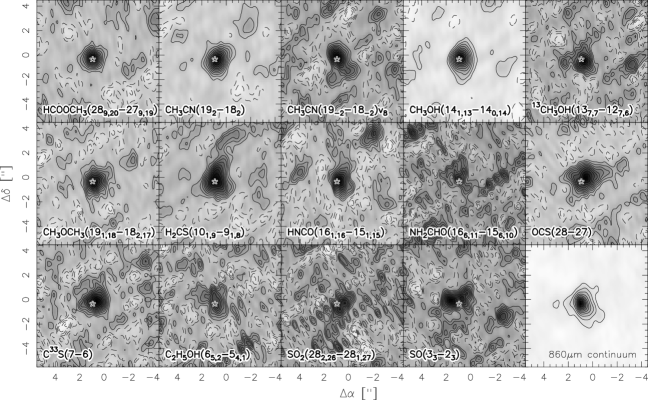
Figure 4 shows vector-averaged spectra of the complete spectral setup taken on a short baseline of 26 m, and Table 2 lists the detected lines. Line identification were conducted with the 350 GHz spectral line survey by Schilke et al. (1997a) and the molecular line databases JPL (Poynter & Pickett, 1985) and CDMS (Müller et al., 2001). Altogether 50 spectral lines from 18 species are observed (we consider different isotopomers as different species: CH3OH, 13CH3OH, SO2, 34SO2, SO, 34SO, C2H5OH, CH3OCH3, NH2CHO, C33S, CN, OCS, H2CS, HCOOCH3, CH3CN, CHCN, CCH, HNCO). Interestingly, within this single spectral setup we detect molecular lines spanning upper state energy levels from 17 to 747 K (Table 2). Fourteen species are sufficiently strong to be imaged. Figure 5 shows the integrated images of these species, and only HCOOCH3 does peak exactly on the continuum image. A more detailed analysis of the HCOOCH3 data is given in §3.2.2. The lines we were originally mainly interested in, the CH3CN K-ladder, appear to be optically thick, and do not properly trace the most central core (see §3.2.1).
Comparing the other molecular lines with the previously observed SiO outflow emission leaving the core in the northern direction (Beuther et al., 2004a), some lines show contributions from the outflow as well, most strongly H2CS. Most of the other species appear to peak close to the continuum emission – usually within corresponding to AU – but none directly toward it. Interestingly, for most species this offset is toward the west and north-west, similar to the peculiar offset of the SiO outflow axis (Beuther et al., 2004a). Since we do not detect any companion source in the submm continuum data (see also §4.1), it is unlikely that a secondary source is causing this offset. It appears more plausible that shock interactions of the outflow with the ambient molecular core enhance the molecular abundances and thus at least partly cause the observed offsets. It is difficult to quantify the relative contributions from excitation, chemistry, opacity, outflow and other kinematic effects to the morphological differences between the various species, and likely an interplay of these effects has to be taken into account to explain all observational features.
Comparing the spatial extent of the 50% contour levels from some of the molecules in Table 3 (we selected just the strong ones with reasonable S/N ratio), we find that HCOOCH3 is confined most strongly, approximately within the same region as the 860 m continuum emission, whereas all other molecules, even density tracers like CH3CN/CH3OH/C33S, are more extended. With HCOOCH3 peaking exactly toward the submm continuum peak and showing the smallest spatial extend, it appears to be one of the best dense gas tracers within this mini-line-survey.
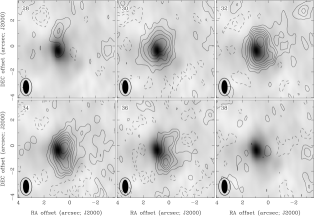
3.2.1 CH3CN
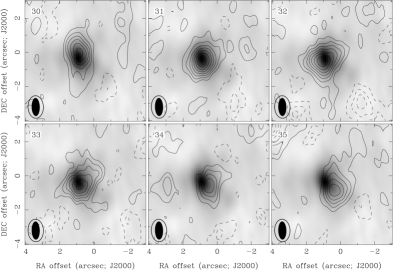
All CH3CN velocity channels peak offset from the mm continuum peak, and we cannot distinguish a clear velocity structure (Fig. 6). The picture is similar for all 8 detected CH3CN K-lines (K=0,…,7). While physical reasons like the above mentioned outflow contributions can account for some of the offsets, the rather random-like distribution of offsets in this channel map is indicative of high optical depths throughout the whole K-ladder (see also the discussion about the spectral fits below). Thus, the CH3CN lines appear not to be suited well as a disk tracer for this source.
Nevertheless, we can use the CH3CN K-ladder to get a temperature estimate of the core. For this purpose, we used the XCLASS superset of the CLASS program (Schilke, priv. comm.). This software-package uses the line catalogs from JPL and CDMS, Poynter & Pickett 1985; Müller et al. 2001). We tried to fit the whole CH3CN spectrum simultaneously assuming optically thin emission in local thermodynamic equilibrium. Figure 7 presents the whole CH3CN spectrum toward the submm peak position and a model spectrum using a temperature of 350 K and a CH3CN column density of cm-2. This model fits the data good for the K=0,1,2,4,5,7 lines but bad for K=3,6. The ortho-CH3CN (A-species) lines K=3,6 have double the statistical weight than the other observed lines, whereas the observed line strengths of the K=3,4,5,6 lines (including para and ortho species) are similar. The observed line ratio close to unity between ortho- and para-CH3CN lines is additional evidence for the large optical depths of the lines. In spite of these difficulties, the temperature of 350 K is consistent with our previous temperature estimate based on HCOOCH3 observations (Beuther et al., 2004b) and thus gives a reasonable temperature for the central forming hot molecular core.
3.2.2 Disk signature in HCOOCH3
In contrast to the CH3CN emission, HCOOCH3 traces the central dust emission well and thus appears to be likely optically thin. Unfortunately, the spectral line at GHz is weaker than most of the CH3CN lines, and it is a blend of two HCOOCH3 lines and the CH3CN() line (see Table 2). However, the energy levels of the HCOOCH3 lines are at K whereas for CH3CN() it is at K (Table 2). Therefore, the spectrum is dominated by the HCOOCH3 lines. Furthermore, using the rest-frequency of the HCOOCH3()-E line at 348.9095 GHz, the line center is at 32 km/s consistent with the line centers of other dense gas tracers, e.g., CH3CN. The frequency of the corresponding HCOOCH3()-A line should be blue-shifted by km/s but we do not find a significant secondary peak toward this velocity. Likely, there is underlying emission from this A-type line, although at weaker intensities, but the spectrum is dominated by the HCOOCH3 line of the corresponding E-species. Thus, it appears feasible to use this HCOOCH3 line for a closer analysis of the kinematics of the central core.
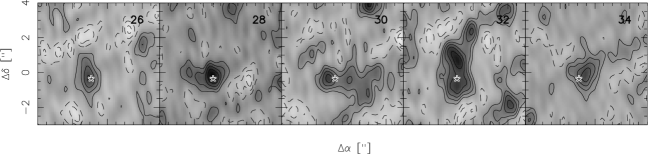
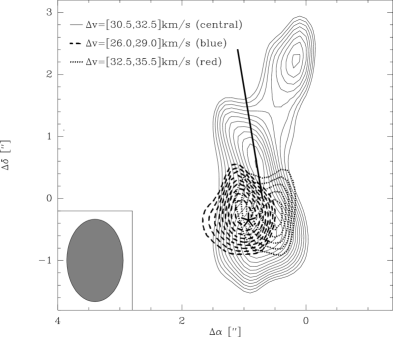
Figure 8 shows a channel map of this HCOOCH3()-E line. Consistent with our previous investigation (Beuther et al., 2004a), we find a velocity shift in the east-west direction over the core333We note that one cannot directly compare the velocity channels of the previous HCOOCH3 observation near 216.966 GHz with our new data, because in last year’s analysis we set the rest-frequency to a central component of the line blend whereas for the new data it is set to the strongest component HCOOCH3()-E. This introduces slightly different velocity ranges for both observations, but it does not change the relative velocity shift over the source. . This can be depicted in the blue channels at 26 and 28 km/s, which show compact emission close to and a bit east of the mm continuum peak, and the red channel at 34 km/s, which shows compact emission west of the submm continuum peak. The intermediate channels at 30 and 32 km/s show slightly more extended emission features. The fact that we see blue emission over a little bit wider velocity range than red emission may be due to the weaker HCOOCH3()-A line, which is blue-shifted with regard to the main HCOOCH3()-E line. The red emission of the HCOOCH3()-A line would then be undetectable because of the stronger ambient gas emission at 30 and 32 km/s from the HCOOCH3()-E line. Figure 9 presents an overlay of the HCOOCH3 data binned into blue/central/red components. Additionally, the outflow axis is sketched as traced by the SiO(5–4) observations (Beuther et al., 2004a). With the rotation axis, defined by the high-density tracer HCOOCH3, being approximately perpendicular to the outflow axis, these observations in IRAS 18089-1732 show a disk signature similar to those known from many low-mass sources (e.g., D Tauri, Guilloteau & Dutrey 1998). This confirms at higher spatial resolution our previously proposed disk scenario for this High-Mass Protostellar Object. While the HCOOCH3 observations at 216.966 GHz showed a P.A. of (from north), the axis of the new data is closer to . Considering the different energy levels of the various HCOOOCH3 transitions ( K & K), this implies that the lower-energy-level transitions are more strongly affected by the infalling surrounding envelope. In contrast, the higher-energy-lines appear to be better probes of the actual underlying disk properties.
The deconvolved source size of the integrated HCOOCH3 map in Fig. 5 is AU (using the 50% contour as the observed image size), similar to the separation of the blue- and red-shifted HCOOCH3 peaks in Fig. 9 of AU. With this source size, we cannot clearly distinguish whether we observe the outer regions of a circumstellar disk or rather a larger-scale rotating molecular envelope/torus which could feed the inner accretion disk. Assuming equilibrium between the centrifugal and gravitational forces at the outer radius of the disk the enclosed dynamical mass can be estimated via:
| (1) | |||||
| (2) |
where is the disk mass, the disk radius, in our case half the separation of the blue and red HCOOCH3 emission peaks at most extreme blue and red velocities, and the Half Width Zero Intensity (HWZI) of the spectral line. Equations 1 & 2 have to be divided by sin where is the unknown inclination angle between the disk plane and the line of sight. Adopting the values km/s and AU, the resulting disk mass is /(sin) M⊙444The HWZI of the whole observed line is km/s. Since there is some blending between the HCOOCH3() main E-type and weaker A-type line, we adopt a slightly smaller value of HWZI= km/s for the HCOOCH3()-E transition.. This value is close to the 22/(sin) M⊙ value derived from our previous lower resolution 1.3 mm HCOOCH3 observations (Beuther et al., 2002c). It also compares well to the 12 M⊙ core mass derived assuming 350 K (in contrast to the estimated 45 M⊙ assuming 100 K, see §3.1 and Table 1). As already noticed by several studies (e.g., Cesaroni et al. 1997; Zhang et al. 1998; Sandell et al. 2003; Beltrán et al. 2004; Beuther et al. 2004a), in contrast to low-mass disks where the disk mass is usually negligible compared with the core mass, a considerable amount of the gas mass appears to be associated with large accretion disks and/or rotating envelopes in the central regions of high-mass star formation.
3.3 Varying spatial distributions of CH3OH
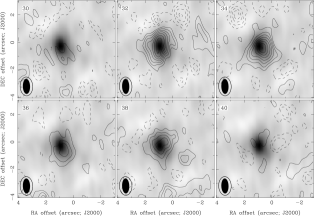
The previously observed CH3OH line at 216.946 GHz peaked toward the mm continuum and exhibited a velocity gradient in the east-west direction (Fig. 3 in Beuther et al. 2004b). Figure 10 presents channel maps for the CH3OH(), CH3OH, and CH3OH lines at 340.141, 338.722, and 349.107 GHz, respectively. The spatial distribution of the three lines is not exactly the same: the CH3OH() and CH3OH both show red emission to the west of the continuum peak but only weak or barely detectable blue emission to the east (Fig. 10 top and bottom). Contrary to this we cannot discern such a signature in the CH3OH line, the emission peaks north and south of the submm continuum peak and seems to be affected by the outflow in that direction (Fig. 10 middle). While none of the lines shows a clear east-west velocity gradient indicative of the proposed disk as suggested by the previous CH3OH observations, the red emission of the CH3OH() and CH3OH lines are at least consistent with it.
Since CH3OH is a slightly asymmetric rotor with a very rich spectrum in the mm and submm bands (see Table 2 or Leurini et al. 2004 for a more detailed CH3OH discussion), it is interesting to investigate in what kind of environment one finds the molecule. As shown in Table 2, within the given bandpass we observe CH3OH lines spanning upper level energy ranges between 44 and 695 K. Since the lower energy CH3OH() ( K) and the higher energy CH3OH ( K) lines are more confined to the inner center than the intermediate energy CH3OH line ( K), one could speculate that the temperatures within the outflow might be in the latter regime and thus influence this line most strongly. However, not all lines of the CH3OH series resemble the outflow-influenced morphology, but others also trace the inner core again (e.g., CH3OH). In the literature one finds cases where CH3OH traces the protostellar cores (e.g., Wyrowski et al. 1999; van der Tak et al. 2000) as well as molecular outflows (e.g., Bachiller et al. 1998; Beuther et al. 2002a; Jørgensen et al. 2004), and currently it is not well understood which CH3OH line is suitable to trace one or the other effect. Nevertheless, because CH3OH is a molecule with often more than one line in a given spectral setup, it is a potentially useful tool to investigate the different processes. Since the CH3OH collisional rates were calculated recently (Pottage et al., 2004), the potential of CH3OH as an interstellar tracer is likely going to be exploited more extensively than before (e.g., Leurini et al. 2004).
4 Discussion
4.1 Continuum emission
It is interesting to see that even at this high spatial resolution IRAS 18089-1732 still does not split up in any sub-fragments. The 3 continuum sensitivity of 105 mJy corresponds to a mass sensitivity of 0.3, 0.7, or 3.0 M⊙, depending on the assumed temperature which we set to 350 K (the derived CH3CN hot core temperature), 100 K (a more typical hot core temperature), and 30 K (which should be the temperature of the surrounding envelope), respectively. Since potential lower-mass companions of an evolving massive cluster should be distributed a little bit further out from the central core (e.g., Lada & Lada 2003), lower temperature values of 100 and/or 30 K appear to be a more realistic for potential companions. Nevertheless, we find no companion down to a mass limit of 0.7 and 3 M⊙ at 100 and 30 K, respectively. The non-detection of any companion source supports the previous reasoning that the SiO outflow is indeed emanating from the main massive submm continuum source and not caused by a lower-mass cluster member (Beuther et al., 2004a). The small offset of the SiO outflow axis from the submm peak position (, Beuther et al. 2004a) is still a bit puzzling, but it can likely be attributed to the underlying flow geometry and the resulting shock-induced local SiO enhancements (e.g., Schilke et al. 1997b).
The single submm continuum peak is also distinctively different to the recent study by Beuther & Schilke (2004) who found the HMPO IRAS 19410+2336 to split up into a cluster of sources with a protocluster mass function resembling the stellar Initial Mass Function. Contrary to this, there exist other prominent examples which do not split up into clusters, e.g., IRAS 20126+4104, but remain one mm continuum source down to the highest spatial resolution (Cesaroni et al., 1999)555It is noteworthy that the mm continuum peak in IRAS 20126+4104 contains a ionized double jet indicating a binary system (Hofner et al., 1999). This may be responsible for the large-scale precession of the molecular outflow (Shepherd et al., 2000; Cesaroni et al., 2005)., similar to the case of IRAS 18089-1732.
What is causing these observational differences? On the one hand, it is possible that the study by Beuther & Schilke (2004) had very favorable observational circumstances, because they observed IRAS 19410+2336 in three configurations with the Plateau de Bure Interferometer and thus had an exceptionally good uv-coverage sampling various spatial scales. Our SMA data have been observed with baselines not shorter than 20 m and thus does not trace the corresponding larger spatial scales, especially at this high frequencies. Excluding the compact Plateau de Bure configuration, Beuther & Schilke (2004) would not have detected that many sub-sources in IRAS 19410+2336 as well. Therefore, observational differences might account to some degree for the discussed differences. On the other hand, could it be possible that some massive star-forming regions evolve in a fragmenting cluster-like way like IRAS 19410+2336, whereas other star-forming regions exhibit the core-halo structure like IRAS 18089-1732 at the earliest evolutionary stages and develop the cluster-like structure at later evolutionary stages? This scenario would imply that at least for such kind of sources the massive cluster members would form first and the low- and intermediate-mass members later. One way to solve this question is to choose a number of similar sources (similar in the sense of evolutionary stage, luminosity and distance; IRAS 20126+4104 and IRAS 19410+2336 for example fulfill these criteria) and observe all these sources with exactly the same interferometric configurations to trace the same spatial scales. If this experiment would still result in the same observational differences as encountered here, this would be a hint to the existence of a variety of evolutionary paths for massive star-forming regions.
Another result from the continuum study is that it is difficult to derive a consistent intensity distribution and thus density distribution on this small spatial scales because apparently IRAS 18089-1732 is not symmetric at all. It is likely that the central core still harbors multiple unresolved sources which could cause these asymmetries. In any regard, the usual approach of circular averaging and then deriving density distributions which are interpreted within one or the other theoretical model has to be approached cautiously and needs to be re-checked for each studied source separately.
4.2 Disks in massive star formation
We are able to confirm the previously suggested disk/outflow scenario for the HMPO IRAS 18089-1732 at higher spatial resolution. The HCOOCH3 velocity shift is approximately perpendicular to the SiO outflow axis. However, even at this spatial resolution it is hard to judge whether we really trace a Keplerian accretion disk (Keplerian in the sense of a Keplerian velocity profile dominated by the central protostar) or rather a rotating larger-scale envelope which rotates perpendicular to the outflow but which might not be Keplerian at all. The fact that a large fraction of the central gas core appears to be associated with the rotation indicates that it might not be in Keplerian motion. This implies a follow-up question whether massive accretion disks need to be Keplerian like their low-mass counterparts, or whether massive disks may be non-Keplerian, potentially self-gravitating structures (self-gravitating in the sense that the gravitational potential of the disk-star system is dominated by the disk). While the observations toward prototypical high-mass disk source IRAS 20126+4104 favor a Keplerian disk, although with a central mass of M⊙ it is not a very massive source (e.g., Cesaroni et al. 2005), other sources indicate disk masses well in excess of the central source (e.g., Sandell et al. 2003; Chini et al. 2004). For IRAS 18089-1732, we find a rotating structure which is consistent with an accretion disk/rotating envelope, but unfortunately the data still lack the spatial resolution to study the physical structure of the disk. Follow-up observations at higher angular resolution are one tool to tackle these questions.
In addition, the question posed in §1 to find the most suitable disk-tracing molecules has not been sufficiently answered. The previously successful molecule CH3CN has proved in this source as not suitable. It is not clear whether simply the chosen K-ladder line series is a bad one because the opacity scales with the frequency like:
| (3) | |||||
| (4) |
with A the Einstein coefficient, the line width, and the column density of the upper state. Using the temperature estimate of 350 K and assuming the same line width for all CH3CN line series, we can approximate the change in optical depth for the CH3CN line series in the 349 GHz and 220 GHz bands by:
| (5) |
In case the CH3CN column densities in both transitions are similar, which is given to first order in thermal equilibrium at the estimated temperature of 350 K, the line opacity in the 860 m band would be approximately 2.5 times larger than in the 1 mm band. Therefore, higher optical depth at 860 m could contribute to the observation that we do not find a disk signature in the CH3CN transitions. However, it is possible that already the 1 mm lines are optically thick which has to be checked via future observations of the latter line series.
Contrary to this, the HCOOH3 molecule traces the disk-like structure in the 1 mm and the 860 m band successfully and apparently does not suffer from too high opacity. However, in spite of its ubiquity in many spectral bands (Sutton et al., 1985; Schilke et al., 1997a, 2001), spectral HCOOCH3 lines are often rather weak and and blended with various components, and therefore observationally more difficult to tackle. To start statistically significant studies of massive accretion disks, we still have to find a suitable molecular transition which unambiguously can trace disks and does not require a too large amount of observing time.
In spite of these problems, it is promising that more and more massive disk candidates are being studied. With concerted efforts from various groups employing all available interferometers, it is likely that we will get a much better understanding of massive disks over the next decade.
5 Conclusions and Summary
Fifty spectral lines from eighteen different species spanning an energy range from 17 to 747 K were detected within the 4 GHz bandpass at 860 m. While the previously assumed best disk tracer CH3CN in this band is optically thick and thus not suitable for follow-up disk studies in this source, HCOOCH3 appears optically thin and shows a velocity-disk signature similar to well-known low-mass disk sources. The estimated mass of this rotating structure, assuming equilibrium between the gravitational and centrifugal forces, is 16/(sin) M⊙, of the same order as the core mass derived from the submm dust continuum emission. This implies that a significant fraction of the central core mass is associated with the rotation, and the assumed disk-like structure may not be Keplerian. Within this mini-line-survey, HCOOCH3 appears as one of the best disk-tracing molecules.
Although CH3CN is optically thick, we can use the K-ladder to estimate a temperature in the region. We find a temperature of approximately 350 K, consistent with previous HCOOCH3 estimates (Beuther et al., 2004b), and a hot molecular core has already formed.
Even at spatial resolution, we do not detect any companion source in the field of view down to mass limits between 0.2 and 3 M⊙ (depending on the assumed temperature). Since this finding is distinctively different to the recent study toward the HMPO IRAS 19410+2336 it might indicate different evolutionary paths for the formation of massive clusters. However, observational systematics can also account for some of the differences, and more detailed investigations of various sources with the same observational settings are necessary to draw firm conclusions. Furthermore, the central dust core is highly non-circular, indicating potential difficulties for circular averaged studies of intensity profiles at this high spatial resolution.
References
- Bachiller et al. (1998) Bachiller, R., Codella, C., Colomer, F., Liechti, S., & Walmsley, C. M. 1998, A&A, 335, 266
- Beltrán et al. (2004) Beltrán, M. T., Cesaroni, R., Neri, R., et al. 2004, ApJ, 601, L187
- Beuther et al. (2004a) Beuther, H., Hunter, T. R., Zhang, Q., et al. 2004a, ApJ, 616, L23
- Beuther & Schilke (2004) Beuther, H. & Schilke, P. 2004, Science, 303, 1167
- Beuther et al. (2002a) Beuther, H., Schilke, P., Gueth, F., et al. 2002a, A&A, 387, 931
- Beuther et al. (2002b) Beuther, H., Schilke, P., Menten, K. M., et al. 2002b, ApJ, 566, 945
- Beuther et al. (2002c) Beuther, H., Schilke, P., Sridharan, T. K., et al. 2002c, A&A, 383, 892
- Beuther et al. (2002d) Beuther, H., Walsh, A., Schilke, P., et al. 2002d, A&A, 390, 289
- Beuther et al. (2004b) Beuther, H., Zhang, Q., Hunter, T. R., et al. 2004b, ApJ, 616, L19
- Cesaroni et al. (1999) Cesaroni, R., Felli, M., Jenness, T., et al. 1999, A&A, 345, 949
- Cesaroni et al. (1997) Cesaroni, R., Felli, M., Testi, L., Walmsley, C. M., & Olmi, L. 1997, A&A, 325, 725
- Cesaroni et al. (2005) Cesaroni, R., Neri, R., Olmi, L., Walmsley, C., & Hofner, P. 2005, A&A accepted
- Chini et al. (2004) Chini, R., Hoffmeister, V., Kimeswenger, S., et al. 2004, Nature, 429, 155
- Davis et al. (2004) Davis, C. J., Varricatt, W. P., Todd, S. P., & Ramsay Howat, S. K. 2004, A&A, 425, 981
- Garay et al. (2004) Garay, G., Faúndez, S., Mardones, D., et al. 2004, ApJ, 610, 313
- Gibb et al. (2003) Gibb, A. G., Hoare, M. G., Little, L. T., & Wright, M. C. H. 2003, MNRAS, 339, 1011
- Guilloteau & Dutrey (1998) Guilloteau, S. & Dutrey, A. 1998, A&A, 339, 467
- Hildebrand (1983) Hildebrand, R. H. 1983, QJRAS, 24, 267
- Hofner et al. (1999) Hofner, P., Cesaroni, R., Rodríguez, L. F., & Martí, J. 1999, A&A, 345, L43
- Jørgensen et al. (2004) Jørgensen, J. K., Hogerheijde, M. R., Blake, G. A., et al. 2004, A&A, 415, 1021
- Lada & Lada (2003) Lada, C. J. & Lada, E. A. 2003, ARA&A, 41, 57
- Leurini et al. (2004) Leurini, S., Schilke, P., Menten, K. M., et al. 2004, A&A, 422, 573
- Müller et al. (2001) Müller, H. S. P., Thorwirth, S., Roth, D. A., & Winnewisser, G. 2001, A&A, 370, L49
- Pestalozzi et al. (2004) Pestalozzi, M. R., Elitzur, M., Conway, J. E., & Booth, R. S. 2004, ApJ, 603, L113
- Pottage et al. (2004) Pottage, J. T., Flower, D. R., & Davis, S. L. 2004, MNRAS, 352, 39
- Poynter & Pickett (1985) Poynter, R. L. & Pickett, H. M. 1985, Appl. Opt., 24, 2235
- Sandell et al. (2003) Sandell, G., Wright, M., & Forster, J. R. 2003, ApJ, 590, L45
- Schilke et al. (2001) Schilke, P., Benford, D. J., Hunter, T. R., Lis, D. C., & Phillips, T. G. 2001, ApJS, 132, 281
- Schilke et al. (1997a) Schilke, P., Groesbeck, T. D., Blake, G. A., & Phillips, T. G. 1997a, ApJS, 108, 301
- Schilke et al. (1997b) Schilke, P., Walmsley, C. M., Pineau des Forets, G., & Flower, D. R. 1997b, A&A, 321, 293
- Scoville et al. (1993) Scoville, N. Z., Carlstrom, J. E., Chandler, C. J., et al. 1993, PASP, 105, 1482
- Shepherd et al. (2000) Shepherd, D. S., Yu, K. C., Bally, J., & Testi, L. 2000, ApJ, 535, 833
- Sridharan et al. (2002) Sridharan, T. K., Beuther, H., Schilke, P., Menten, K. M., & Wyrowski, F. 2002, ApJ, 566, 931
- Su et al. (2004) Su, Y.-N., Liu, S.-Y., Lim, J., et al. 2004, ApJ, 616, L39
- Sutton et al. (1985) Sutton, E. C., Blake, G. A., Masson, C. R., & Phillips, T. G. 1985, ApJS, 58, 341
- Torrelles et al. (1996) Torrelles, J. M., Gomez, J. F., Rodriguez, L. F., et al. 1996, ApJ, 457, L107+
- van der Tak et al. (2000) van der Tak, F. F. S., van Dishoeck, E. F., & Caselli, P. 2000, A&A, 361, 327
- Williams et al. (2004) Williams, S. J., Fuller, G. A., & Sridharan, T. K. 2004, A&A, 417, 115
- Wyrowski et al. (1999) Wyrowski, F., Schilke, P., Walmsley, C. M., & Menten, K. M. 1999, ApJ, 514, L43
- Zhang et al. (1998) Zhang, Q., Hunter, T. R., & Sridharan, T. K. 1998, ApJ, 505, L151
- Zhang et al. (2002) Zhang, Q., Hunter, T. R., Sridharan, T. K., & Ho, P. T. P. 2002, ApJ, 566, 982


| 1.400 mJy | |
|---|---|
| 6440 mJy | |
| at 100 K | 45 M⊙ |
| at 100 K | cm-2 |
| at 350 K | 12 M⊙ |
| at 350 K | cm-2 |
| line | |||
|---|---|---|---|
| GHz | [K] | [K] | |
| LSB | |||
| 338.5041 | CH3OH()E | 5.0 | 153 |
| 338.5126 | CH3OH()A | 4.1 | 145 |
| 338.5303 | CH3OH()E | 3.7 | 160 |
| 338.5408 | CH3OH()A+a | 4.9 | 115 |
| 338.5432 | CH3OH()A-a | 115 | |
| 338.5599 | CH3OH()E | 5.8 | 128 |
| 338.5832 | CH3OH()E | 5.3 | 113 |
| 338.6150 | CH3OH()E | 5.0 | 86 |
| 338.6399 | CH3OH()A+ | 4.9 | 103 |
| 338.7216 | CH3OH()Ea | 4.8 | 87 |
| 338.7229 | CH3OH()Ea | 91 | |
| 338.7604 | 13CH3OH()A+ | 2.2 | 206 |
| 338.7858 | 34SO2() | – | 134 |
| 338.8862 | C2H5OH()a | – | 162 |
| 338.8873 | C2H5OH()a | – | 162 |
| 339.3126 | C2H5OH() | – | 126 |
| 339.3415 | SO() | 1.6 | 25 |
| 339.4917 | CH3OCH3()AA | 3.4 | 176 |
| 339.8576 | 34SO() | 2.6 | 77 |
| 339.9041 | NH2CHO() | – | 246 |
| 340.0527 | C33S() | 2.6 | 65 |
| 340.1412 | CH3OH()A+ | 4.4 | 44 |
| 340.1893 | C2H5OH() | 1.6 | 49 |
| 340.2486 | CN() | – | 32 |
| 340.3164 | SO2() | 1.6 | 392 |
| 340.3937 | CH3OH()A+ | 3.4 | 508 |
| 340.4492 | OCS() 2.3 | 237 | |
| USB | |||
| 348.5319 | H2CS() | 4.3 | 105 |
| 348.9095 | HCOOCH3()Ea | 1.7 | 294 |
| 348.9114 | CH3CN()a | 745 | |
| 348.9150 | HCOOCH3()Aa | 294 | |
| 349.0485 | HCOOCH3()E | – | 294 |
| 349.1070 | CH3OH()A | 6.2 | 259 |
| 349.1253 | CH3CN() | 2.1 | 517 |
| 349.1732 | CH313CN() | – | 281 |
| 349.2121 | CH3CN() | 3.8 | 424 |
| 349.2858 | CH3CN() | 3.2 | 346 |
| 349.3379 | CCH() | – | 41 |
| 349.3461 | CH3CN() | 3.4 | 281 |
| 349.3930 | CH3CN() | 3.4 | 231 |
| 349.4266 | CH3CN() | 4.8 | 196 |
| 349.4467 | CH3CN()a | 175 | |
| 349.4534 | CH3CN()a | 6.1 | 167 |
| 350.1031 | 13CH3OH()A+ | – | 17 |
| 350.2877 | CH3OH() | 2.0 | 695 |
| 350.3333 | HNCO() | 3.0 | 185 |
| 350.4235 | CH3CN()() | 2.1 | 747 |
| 350.4423 | HCOOCH3()Ea | 2.1 | 283 |
| 350.4449 | CH3CN()()a | 693 |
| Area | |
|---|---|
| [arcsec2] | |
| 860 m continuum | 1.0 |
| HCOOCH3()E | 1.2 |
| CH3CN() | 1.8 |
| CH3CN()() | 1.6 |
| CH3OH()A | 1.7 |
| 13CH3OH()A+ | 1.3 |
| CH3OCH3()AA | 1.9 |
| H2CS() | 2.7 |
| HNCO() | 1.6 |
| OCS() | 3.8 |
| C33S(7–6) | 2.3 |