X-ray spectroscopy of PSR B1951+32 and its pulsar wind nebula
Abstract
We present spatially resolved X-ray spectroscopy of PSR B1951+32 and its pulsar wind nebula (PWN) in supernova remnant (SNR) CTB 80 using a Chandra observation. The Chandra X-ray map reveals clearly various components of a ram-pressure confined PWN embedded in the SNR ejecta: a point source representing the pulsar, X-ray emission from the bow shock, a luminous X-ray tail, a 30 diameter plateau whose northwestern part is absent, and the outside more diffuse X-ray emission. The plateau is just surrounded by the radio, [O III], [S II], and [N II] shells, and the outside diffuse emission is mostly within the H shells. While the spectra of all the features are well fitted with power law models, a power law plus blackbody model can fit the spectrum of the pulsar significantly better than using a power law model alone. Generally the spectra of these components obey the trend of steepening from the inside to the outside. However, the edge of the plateau probably has a harder spectrum than that of the central region of the plateau. The cause of the apparent hard spectrum of the plateau edge is unclear, and we speculate that it might be due to a shock between the PWN and the SNR ejecta. The possible blackbody radiation component from the pulsar has a temperature of 0.13 keV and an equivalent emitting radius of 2.2 (d/2 kpc) km, and is thus probably from the hot spots on the pulsar. We also show in this paper that the blackbody temperature of the entire surface of PSR B1951+32 is much lower than those predicted by the standard neutron star cooling models.
1 Introduction
It is generally accepted that only a small fraction ( 10%) of the spin-down energy of a young pulsar is converted into observable pulsed emission, and most of the energy leaves the pulsar in the form of a highly relativistic electron/positron wind. This relativistic wind eventually interacts (through a termination shock) with the external medium, emits synchrotron radiation, and produces a pulsar wind nebula (PWN) (e.g., Rees & Gunn, 1974; Kennel & Coroniti, 1984). The pulsar wind particles are usually confined by the supernova ejecta or interstellar medium (ISM) (e.g., Reynolds & Chevalier, 1984), and the morphology of the PWN relies strongly on how the wind particles are confined. Some PWNe (e.g., IC 433, W44, N157B, B1957+20, B1757-24, Duck nebula, Mouse, Geminga) have cometary morphologies, which are suggested to be due to the supersonic motion of their respective pulsars in the ISM or supernova remnants (SNRs) (Wang et al., 1993; Olbert et al., 2001; Wang et al., 2001; Kaspi et al., 2001; Chatterjee & Cordes, 2002; Petre et al., 2002; Caraveo et al., 2003; Lu et al., 2003; Stappers et al., 2003; Gaensler et al., 2004; Gvaramadze, 2004). In such a system, there is a bow shock running ahead of the pulsar, most of the wind particles are confined to the direction opposite to the pulsar proper motion, and the pulsar is well offset from the center or even at the apex of the PWN (Wang et al., 1993; Wilkin, 1996; Wang & Gotthelf, 1998; Bucciantini, 2002; Caraveo et al., 2003; van der Swaluw et al., 2003; Gaensler et al., 2004; Gvaramadze, 2004; van der Swaluw, 2004). Detailed spatially resolved X-ray spectroscopy of a PWN should be important for examining and refining those models, because the X-ray emitting particles are young and have a short lifetime, and thus the spatial variations of the X-ray spectra reflect very well the particle track and energy evolution in the PWN.
Radio and optical observations suggest that the PWN energized by PSR B1951+32 in SNR CTB 80 (G69.0+2.7) is an ideal laboratory to study the interaction between an SNR and the embedded PWN. CTB 80 has a peculiar radio morphology composed of three ridges and a core in the southern central portion of the extended component (e.g., Koo et al., 1993; Mavromatakis et al., 2001; Castelletti et al., 2003). The 39.5 ms pulsar PSR B1951+32, located at the south-western edge of the core, moves towards the south-west (, north through east) with a transverse velocity of 24040 km s-1 for a distance of 2 kpc (Migliazzo et al., 2002). Radio observation revealed a “” like loop and a bright bow shock feature at the southwest of the loop, indicating strong interaction of the wind of the fast moving pulsar with the environment (Strom, 1987; Migliazzo et al., 2002). The optical structure of the PWN of PSR B1951+32 was delineated by forbidden-line ([O III], [S II], and [N II]) emission as shell-like (Hester & Kulkarni, 1988, 1989). These optical features suggest that they arise behind shocks which are being driven into a magnetized thermal plasma by the confined relativistic wind from PSR B1951+32 (Hester & Kulkarni, 1989).
The optical and radio properties make the PWN of PSR B1951+32 also a hot target for various X-ray telescopes. The EINSTEIN observations show a central filled X-ray source with nonthermal X-ray spectrum (photon index =3.8), and the morphology of the source was suggested as a result of the relativistic jets energized by the central pulsar (Becker et al., 1982; Wang & Seward, 1984). The EXOSAT observation confirmed the nonthermal nature of the X-ray spectrum but inferred a smaller photon index of 1.9 (Angelini et al. 1988). Safi-Harb et al. (1995) studied CTB 80 and PSR B1951+32 with the Position Sensitive Proportional Counter (PSPC) and the High Resolution Imager (HRI) onboard ROSAT. They found a bright compact core of 1 radius surrounding the pulsar and a diffuse nebula extending eastward of the pulsar, and the spectra of these two features are both nonthermal. These observational properties are well consistent with those of a PWN. However, due to the limited spatial and spectral resolution of the previous X-ray telescopes, the detailed morphological and spectral structures of the X-ray emission remains not well resolved.
The superb spatial resolution and moderate spectral resolution of the Chandra X-ray Observatory (hereafter Chandra) permit a detailed morphological study and spatially resolved X-ray spectroscopy of PSR B1951+32 and its PWN. Chandra can isolate the pulsar from the surrounding nebula and we can then study the spectrum of the pulsar proper, which has not been done so far yet. The lifetime of the synchrotron X-ray emitting particles is short, and therefore the spectral variation across the nebula presents important clues to the particle acceleration and the energy losing processes. Recently, Moon et al. (2004) studied the high resolution X-ray (with Chandra), H (with Hubble), and IR (with 5-m Palomar Hale telescope) structures of the region around PSR B1951+32 and revealed a cometary PWN which appears to be confined by a bow shock produced by the high-velocity motion of the pulsar. In this paper, we give more detailed analyses of the Chandra data. We first introduce the data reduction in 2, then present our analyses and results in 3, discuss the structure of PWN in 4, and conclude our work in 5. All through the paper, the errors are at the 90 significance level.
2 Observation and Data Reduction
Chandra observed the PWN of PSR B1951+32 by the Advanced CCD Imaging Spectrometer (ACIS) on July 19th, 2001 with an exposure time of 74 ks. The target was positioned at the aim-point on the back illuminated ACIS-S3 in the “VFAINT” mode and at a working temperature of 120C. ACIS is sensitive to X-rays in 0.2-10 keV with an energy resolution of at 1 keV, and the full width at half maximum (FWHM) of the point spread function (PSF) is 0. The frame read out time for this observation is 0.74 s, since only a small portion of the CCD chip was illuminated.
We calibrated the data using CIAO (version 3.1) and its CALDB (version 2.27). We reprocessed the Level 1 data for correction of the charge transfer inefficiency (CTI) effects, cleaned the background, and removed the afterglow. Time intervals with anomalous background rates associated with particle flare events were further rejected for the Level 2 data, and the final net exposure time is 71 ks. The spectra were fitted with XSPEC.
3 Analysis and Results
3.1 Spatial structure
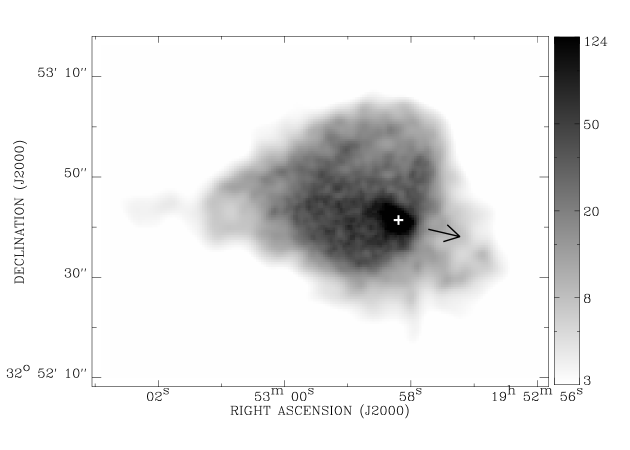
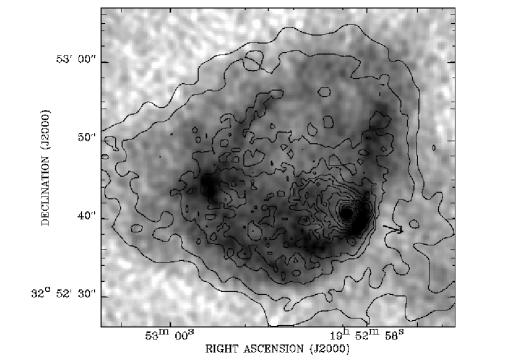
Figure 1 shows an ACIS image of the PWN of PSR B1951+32. This image reveals several major components of the PWN: a point source at RA (J2000) = , DEC (J2000) = , a bright elongation lies in the northeast of the point source, a 30 diameter plateau with absence in its northwest, and more diffuse emission in between and beyond these features. The position of the point source was obtained by the celldetect tool in CIAO and has an uncertainty 02, which is well consistent with the radio position of PSR B1951+32 (Migliazzo et al., 2002). The X-ray point source thus represents the X-ray emission from this pulsar. The X-ray plateau is just within the radio and optical shells (Hester & Kulkarni, 1989), and therefore corresponds to the main body of the PWN. The overall structure of the X-ray nebula is similar to the radio structure, as shown in figure 2, except that the radio nebula is limb-brightened and that the bright X-ray elongation in the northeast is absent in the radio map (Strom, 1987; Migliazzo et al., 2002).
In order to show the diffuse X-ray emission near the pulsar more clearly, we plot in Figure 3 the X-ray counts (per 0 pixel) profile (solid line) along the pulsar proper motion. In this profile the contribution from the pulsar has been removed by subtracting the convolution of a delta function with the telescope PSF. The PSF is energy-weighted and was simulated with ChaRT111http://cxc.harvard.edu/chart/threads/index.html. The dashed line in Figure 3 represents the 1.5 GHz radio profile from Migliazzo et al. (2002). It is clear that there is high brightness diffuse emission within 2 radius from the pulsar. There is also significant X-ray emission in the radio bow shock region, although the overall trend of the diffuse emission is declining.
3.2 Spectra
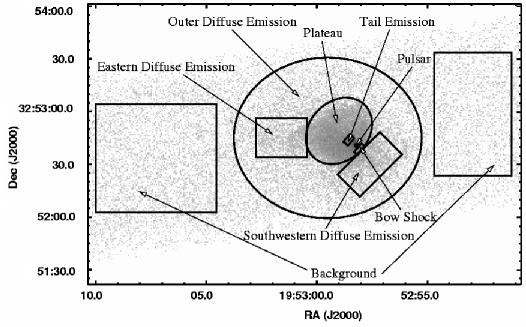
According to our analyses of the morphology of the nebula, we divided it into a few regions (see Figure 4), from which we extracted the spectra of various components. The background used in the spectral analysis of the diffuse features was extracted from two boxes where there are no prominent emission, while the background of the pulsar spectrum was extracted from an annulus centered on the pulsar, with inner and outer radii of 1 and 3 respectively. We fitted the spectra of the diffuse features jointly with a power law (PL) model by forcing all the spectra to share the same absorbing column density (). As shown in Figure 5, such a model fits the spectra very well. The resulted is 3.0 cm-2, and the other parameters are listed in Table 1. As seen in other PWNe, these spectra have a trend of softening with distance from the pulsar due to the fast energy-losing of the high energy electrons (e.g., Slane et al., 2002; Lu et al., 2002; Kaspi et al., 2003).
The pile up fraction of the pulsar emission was estimated as 6 by using sherpa, and thus the pile up effect was neglected in our analysis of the pulsar spectrum. We first fitted the pulsar spectrum with a PL model by fixing the column density to 3.0 cm-2 as derived above. This gives a photon index of 1.74 and of 223 with 208 degrees of freedom (dof). We then fitted the spectrum with a power law + blackbody (PL+BB) model, and this yields a photon index of 1.63, BB temperature of 0.13 keV, and a of 190 with 206 dof. If we only check the data in 0.5-1.5 keV (to which energy region the BB component contributes), the and dof of the spectral fitting with and without the BB component are 61, 60 and 84, 62, respectively. shows that the substitution of the PL model by the PL+BB model is necessary at a significance level of 99.99%. In comparison, Figure 6 gives the 0.5-1.5 keV spectrum of the pulsar fitted with a PL model and a PL+BB model. The fitted BB flux corresponds to an equivalent emitting radius of 2.2 km assuming a distance of 2.0 kpc to the pulsar.
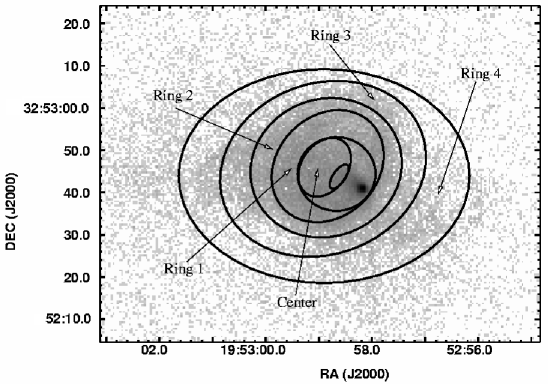
In order to see whether there is any spectral variation in the plateau and in the very outside region surrounding the plateau, we extracted spectra from the 5 quasi-annulus regions defined in Figure 7 and fitted them with a PL model using the background identical to that used above. Table 2 lists the spectral fitting results, which show that the edge of the plateau (rings 1, 2, and 3 in Table 2, and so the radio shell region) has apparently a harder spectrum than the neighboring inner (the center region) and outer regions (the ring 4).
A monte-carlo simulation has been used to estimate how significant the spectrum of the plateau edge is flatter than that of the center region. We generated 100,000 pairs of random numbers. In each pair, the first is a random number from a gaussian distribution with mean and standard deviation of 1.76 and 0.04, while the second number is from a gaussian distribution with mean and standard deviation of 1.64 and 0.015. The standard deviations are smaller than the errors listed in Table 2 since those in Table 2 are at 90% significance level. We found that only 235 out of the 100,000 pairs have their first numbers smaller than the corresponding second numbers. Therefore, the overall spectrum of rings 1 to 3 is flatter than the spectrum of the center region at a significance of 99.7%.
We have also fitted the spectrum of the entire nebula (excluding the pulsar) with a power law model. This gives an of 3.0 cm-2, a photon index of 1.73, an unabsorbed 0.2-10 keV energy flux of 9.6 ergs cm-2 s-1, and of 296 for 312 dof.
4 Discussion
4.1 The magnetic field strength in the nebula
The radio and X-ray spectra of the PWN can be used to estimate the magnetic field strength in the nebula. The radio emission of this PWN has a flat spectrum of () and flux of 500 mJy (Angerhofer et al., 1981). From 3.2 we inferred these two values for the X-ray emission as 0.73 and 1 Jy, respectively. Therefore the spectral break frequency between the radio and X-ray band is around 1010 Hz. Assuming that this spectral break arises from synchrotron losses, the magnetic field in the nebula is then determined by the age of this nebula. The proper motion of the pulsar indicates that the pulsar can cross the X-ray plateau in about 1200 yr. Nonetheless, this seems unlikely the age of the PWN of PSR B1951+32. Most of the electrons injected by the pulsar in the history are probably still confined in the bubble by the highly ordered magnetic field (Hester & Kulkarni, 1988), as indicated by the much higher radio brightness of this region (than the neighboring regions) and the nice radio shells (Migliazzo et al., 2002). Therefore, we use the pulsar dynamic age (64 kyr, Migliazzo et al. 2002) to represent the age of the PWN. Using the formula reproduced by Frail et al. (1996) from Pacholczyk (1970), we derived that the magnetic field strength in the nebula is G. This estimated magnetic field strength is comparable with the values given by Angerhofer et al. (1981), Hester & Kulkarni (1989), and Moon et al. (2004), but much higher than those by Safi-Harb et al. (1995) and Castelletti et al. (2003).
The discrepancy between our result and that (5.2 G) of Castelletti et al. (2003) is due to that they used a much higher of 2.4 Hz and a much lower PWN age of 18,200 yr. We found that both the high and the low PWN age are problematic. Their reason of choosing = 2.4 Hz is that is not much lower than the X-ray energies given the similar X-ray and radio sizes of the PWN. However, as we discussed above, the PWN has the similar X-ray and radio sizes most probably because the pulsar wind particles are well confined rather than diffuse freely. 18,200 yr is the time for the pulsar to move across the 10 radio nebula. But, again, since most of the wind particles ejected by the pulsar in the history are likely still in the bubble. To use the pulsar dynamic age as the PWN age is more reasonale.
We now discuss whether the spectral break between the radio and X-ray bands is mainly due to synchrotron cooling. Kaspi et al. (2001) suggested that more than one electron populations are being injected into the PWN of PSR B1757-24. The injected wind particles of PSR B1951+32 may have similar energy spectrum. However, synchrotron cooling does play an important role in the X-ray to radio spectrum in the PWN of PSR B1951+32. The particle energy spectrum of the bright X-ray tail (see Figures 1 and 3) may represent the injected particle energy spectrum well, because these particles are young. The non-detection of radio emission in this region suggests that the current overall particle energy spectrum in the PWN is significantly steeper than the injected one, due to synchrotron cooling. Therefore, although not very certain, the magnetic field strength we obtained is reasonable.
4.2 The PWN geometry
The PWN of PSR B1951+32 represents the pulsar wind material confined by the ram pressure of the ambient medium, a typical example of the model suggested by many authors (e.g., Wilkin, 1996; Wang & Gotthelf, 1998; Bucciantini, 2002; van der Swaluw et al., 2003; Gaensler et al., 2004; van der Swaluw, 2004). It has the following regions:
-
•
The pulsar wind cavity and termination shock: In the immediate region surrounding the pulsar the relativistic wind flows freely outwards with very little emission, and this region is shown as a cavity. The size of the cavity is determined by the radius of the termination shock over where the pulsar wind ram pressure () balances the ram pressure of the ISM due to the motion of the pulsar (), where is the ambient medium density, and the velocity and spin-down energy of the pulsar, the radius of the termination shock, and the speed of light. For PSR B1951+32, g cm g cm-3(Hester & Kulkarni, 1989), 240 km s-1, erg s-1, and thus cm, corresponding to 0.5 at the distance (2.0 kpc) to the pulsar. Because PSR B1951+32 moves supersonically in the SNR, as the simulation shows (e.g., Gaensler et al., 2004), this region is more likely elongated opposite to the pulsar proper motion rather than spheric.
In the X-ray counts profile of the nebula along the pulsar proper motion (Figure 3) we see strong diffuse emission in the nearby region of the pulsar. The FWHM of this emission is about 3, and the emission following the pulsar extends a little further out ( compared to ) than that ahead of the pulsar. We propose that this high brightness region represents most probably the emission from the termination shock, giving their roughly similar angular sizes. The bigger extension opposite to the pulsar proper motion is consistent with the distorted termination shock geometry because of the supersonic motion of the pulsar (Gaensler et al., 2004). The pulsar wind cavity in this nebula is unresolved, giving the contamination from the high brightness emission from the pulsar and the termination shock.
-
•
The particle tunnel: The X-ray elongation (tail) about 4 to 10 northeastern from the pulsar represents most probably the particle tunnel suggested by Wang & Gotthelf (1998) and Gaensler et al. (2004) (Region B2 in Figure 9 of Gaensler et al’s paper). Reasons to identify this emission as from the particle tunnel rather than from the termination shock are the tail like morphology and its much lower brightness than that of the region neighboring the pulsar. The bright radio and X-ray features at RA (J2000) = , DEC (J2000) = (Figure2; Strom, 1987; Migliazzo et al., 2002) may represent the termination site of the particle tunnel (Wang & Gotthelf, 1998). Since this bright radio feature does not align with the pulsar’s motion, it is possible that the particle tunnel has been bent due to interaction with a gradient in the ambient density and/or magnetic field, as also seen in the Crab nebula and the PWN of PSR B1509-58 (Weisskopf et al., 2000; Gaensler et al., 2002).
-
•
The interface between the PWN and SNR: In 3.1 we have mentioned that bright X-ray plateau are well surrounded by the radio and [O III], [S II] and [N II] shells. This implies that the main body of the PWN is well confined by the SNR ejecta. The radio map is much more shell-like than the X-ray map, suggesting that the old wind particles have accumulated at the interface between the PWN and SNR, since the radio emitting particles have a much longer lifetime than the X-ray emitting particles. As suggested by Hester & Kulkarni (1988), there may exist highly ordered magnetic field in the shell, which might prevent the old particles from diffusing out.
The low surface brightness X-ray diffuse emissions in front of the bow shock and outside of the eastern edge of the PWN are positionally consistent with the bipolar H structure (Figure 2 of Moon et al. 2004). We propose that this is the consequence of the non-uniform distribution of the SNR ejecta. In the directions of the two low surface brightness X-ray protrusions, the ejecta are of so low density that they can not effectively confine the wind particles and so the wind particles extend further out. Finally the wind particles are stopped by the ISM that has low metallicity, and the interaction between them ionizes the hydrogen in the ISM to be H emitting.
4.3 The origin of the apparent hard edge of the X-ray plateau
Now we discuss the origin of the possible spectral hardening at the plateau edge. Although, generally, the apparent harder spectrum can be the result of either a higher or an intrinsic hardening of the emitting spectrum, the first possibility can be ruled out for the hard edge of the X-ray plateau in this PWN. As shown in Table 2, with the photon index () fixed, to the plateau edge needs to be higher than those to the neighboring regions. From the radio and optical observations we know that the shell has a width of 0.03 pc and an inner radius of about 0.1 pc. If the higher to the plateau edge (and so the radio shell) is due to the additional absorbing material in the shell, the required number density of the shell will be , about 20 times higher than 50-100 , the value measured in optical observations (Hester & Kulkarni, 1989). This implies that the apparent X-ray spectrum hardening of the edge of the plateau is not a consequence of the higher absorption but an intrinsic harder emitting spectrum.
In turn, the intrinsic harder emitting spectrum may be due to either the re-acceleration of the pulsar wind particles at the edge or the contribution from a second emission component over there. For both cases, a shock wave is needed, and a shock wave at the interface between the PWN and SNR ejecta does have already been proposed by Hester & Kulkarni (1989) to explain the filamentary optical emission from the core of CTB 80. This shock is in the SNR ejecta rather than in the PWN because of the high sound velocity () in the PWN, and thus the shock can not re-accelerate the pulsar wind particles. However, it is not unlikely that this shock accelerates new relativistic particles and these particles radiate synchrotron X-ray emission at the shock front, like those observed from several SNRs (e.g., Koyama et al., 1995). This shock generalized X-ray emission might have a flat spectrum, which makes the overall spectrum of the X-ray emission from this region harder than those from neighboring regions.
4.4 Constraints on the NS cooling models
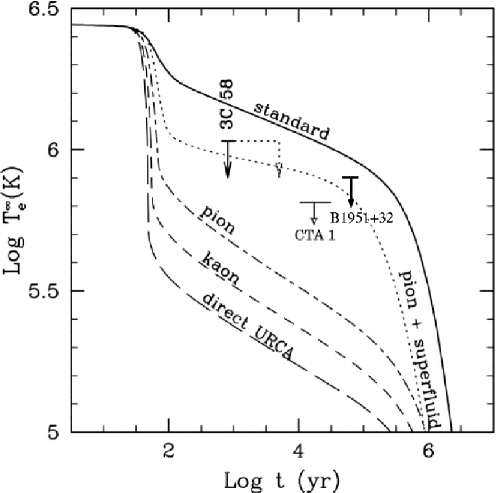
The cooling of NS (age yr) is realized mainly by neutrino emission from the entire stellar body. The standard cooling model only includes neutrino emission via the modified URCA process and the nonstandard models involves pion (kaon) condensates, strong magnetic field, or neutron superfluidity (e.g., Page, 1998; Slane et al., 2002; Yakovlev et al., 2002; Yakovlev & Pethick, 2004).
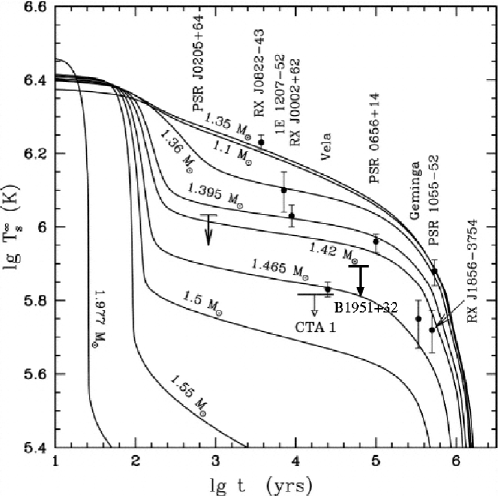
With the Chandra observation we estimated the effective blackbody temperature of the entire surface of PSR B1951+32 and compared it with the cooling models. The majority of equations of state yield an effective NS radius larger than 12 km for any range of masses (Haensel 2001). In order to estimate the blackbody temperature of PSR B1951+32, we fitted its X-ray spectrum with a PL+BB model by fixing the emitting radius as 12 km, and obtained a blackbody temperature of K with 3 upper limit of 7.8 K. We plot in Figures 8 and 9 this temperature upper limit and the various theoretical NS surface cooling curves. In the figures the pulsar’s dynamic age (6418 kyr) has been used, but the characteristic age of 107 kyr is not much larger than the dynamic age (Migliazzo et al., 2002; Fruchter et al., 1988) and will not change the results much. Similar to Slane et al. (2002) and Halpern et al. (2004), the effective blackbody temperature falls considerably below the predictions of the standard cooling models, suggesting the presence of some exotic cooling contribution (such as pion, kaon condensates or strong magnetic field effects) in the interior (Slane et al., 2002; Yakovlev et al., 2002). The influence of the mass to the cooling of the NS has been discussed by Yakovlev et al. (2002). The larger mass NS tends to cool faster because the modified or direct URCA process are less suppressed by strongly proton superfluidity. As seen from Figure 9, our result may also indicate that the mass of PSR B1951+32 is higher than 1.42M☉.
In 3.2 we pointed out that there is a 0.13 keV blackbody component in the X-ray spectrum of PSR B1951+32. However, this component is not from the entire NS surface giving the small equivalent emitting radius. In the above paragraph, this component had not been excluded in deriving the temperature of the entire surface of PSR B1951+32, and thus this surface temperature upper limit is modest. If the emission from the surface of a NS is not a blackbody, then the modification by the presence of a whatever atmosphere component other than H will not make the temperature of the NS surface higher than the estimated effective temperature upper limit (Slane et al., 2002). In short, the above upper limit of the surface temperature of PSR B1951+32 and its constraints on the NS cooling models are safe.
5 Conclusions
We studied the morphology and spectra of PSR B1951+32 and its PWN. The overall morphology of the PWN is consistent very well with that of a ram pressure confined PWN. The X-ray map shows a bright plateau which is within the radio and optical shells positionally, and thus represents the main body of a PWN confined in the SNR. We found that the spectrum of the edge of the X-ray plateau is probably harder than those of the neighboring regions, which are possibly due to the shock between the PWN and the SN ejecta. We detected thermal X-ray emission from hot spots on the NS, and the temperature of the entire surface of PSR B1951+32 is shown to be much lower than that predicted by the standard NS cooling model.
References
- Angelini et al. (1988) Angelini, L., White, N. E., Parmar, A. N., Smith, A., & Stevens, M. A. 1988, ApJ, 330, L43
- Angerhofer et al. (1981) Angerhofer, P. E., Strom, R. G., Velusamy, T., & Kundu, M. R. 1981, A&A, 94, 313
- Becker et al. (1982) Becker, R. H., Helfand, D. J., & Szymkowiak, A. E. 1982, ApJ, 255, 557
- Bucciantini (2002) Bucciantini, N. 2002, A&A, 387, 1066
- Caraveo et al. (2003) Caraveo, P. A., Bignami, G. F., DeLuca, A., Mereghetti, S., Pellizzoni, A., Mignani, R., Tur, A., & Becker, W. 2003, Science, 301, 1345
- Castelletti et al. (2003) Castelletti, G., Dubner, G., Golap, K., Goss, W. M., Velázquez, P. F., Holdaway, M., & Rao, A. P. 2003, AJ, 126, 2114
- Chatterjee & Cordes (2002) Chatterjee, S. & Cordes, J. M. 2002, ApJ, 575, 407
- Frail et al. (1996) Frail, D. A., Giacani, E. B., Goss, W. M., & Dubner, G. 1996, ApJ, 464, L165
- Fruchter et al. (1988) Fruchter, A. S., Taylor, J. H., Backer, D. C., Clifton, T. R., & Foster, R. S. 1988, Nature, 331, 53
- Gaensler et al. (2002) Gaensler, B. M., Arons, J., Kaspi, V. M., Pivovaroff, M. J., Kawai, N., & Tamura, K. 2002, ApJ, 569, 87
- Gaensler et al. (2004) Gaensler, B. M., van der Swaluw, E., Camilo, F., Kaspi, V. M., Baganoff, F. K., Yusef-Zadeh, F., & Manchester, R. N. 2004, ApJ, 616, 383
- Gvaramadze (2004) Gvaramadze, V. V. 2004, A&A, 415, 1073
- Haensel (2001) Haensel, P. 2001, A&A, 380, 186
- Halpern et al. (2004) Halpern, J. P., Gotthelf, E. V., Camilo, F., Helfand, D. J., & Ransom, S. M. 2004, ApJ, 612, 398
- Hester & Kulkarni (1988) Hester, J. J. & Kulkarni, S. R. 1988, ApJ, 331, L121
- Hester & Kulkarni (1989) Hester, J. J. & Kulkarni, S. R. 1989, ApJ, 340, 362
- Kaspi et al. (2001) Kaspi, V. M., Gotthelf, E. V., Gaensler, B. M., & Lyutikov, M. 2001, ApJ, 562, L163
- Kaspi et al. (2003) Kaspi, V. M., Roberts, M. S. E., & Harding, A. K. 2004, astro-ph/0402136
- Kennel & Coroniti (1984) Kennel, C. F., & Coroniti, F. V. 1984, ApJ, 283, 694
- Koo et al. (1993) Koo, B., Yun, M., Ho, P. T. P., & Lee, Y. 1993, ApJ, 417, 196
- Koyama et al. (1995) Koyama, K., Petre, R., Gotthelf, E. V., Hwang, U., Matsuura, M., Ozaki, M., & Holt, S. S. 1995, Nature, 378, 255
- Lu et al. (2002) Lu, F. J., Wang, Q. D., Aschenbach, B., Durouchoux, P., & Song, L. M. 2002, ApJ, 568, L49
- Lu et al. (2003) Lu, F. J., Wang, Q. D., & Lang, C. C. 2003, AJ, 126, 319
- Mavromatakis et al. (2001) Mavromatakis, F., Ventura, J., Paleologou, E. V., & Papamastorakis, J. 2001, A&A, 371, 300
- Migliazzo et al. (2002) Migliazzo, J. M., Gaensler, B. M., Backer, D. C., Stappers, B. W., van der Swaluw, E., & Strom, R. G. 2002, ApJ, 567, L141
- Moon et al. (2004) Moon, D.-S., et al. 2004, ApJ, 610, L33
- Olbert et al. (2001) Olbert, C. M., Clearfield, C. R., Williams, N. E., Keohane, J. W., & Frail, D. A. 2001, ApJ, 554, L205
- Page (1998) Page, D. 1998, in The Many Faces of neutron Stars, ed. R. Buccheri, J. van Paradijs, & M. A. Alpar (Dordrecht: Kluwer), 539
- Petre et al. (2002) Petre, R., Kuntz, K. D., & Shelton, R. L. 2002, ApJ, 579, 404
- Pacholczyk (1970) Pacholczyk, A. G. 1970, Series of Books in Astronomy and Astrophysics, San Francisco: Freeman, 1970
- Rees & Gunn (1974) Rees, M. J. & Gunn, J. E. 1974, MNRAS, 167, 1
- Reynolds & Chevalier (1984) Reynolds, S. P. & Chevalier, R. A. , 1984, ApJ, 278, 630
- Safi-Harb et al. (1995) Safi-Harb, S., Ogelman, H., & Finley, J. P. 1995, ApJ, 439, 722
- Slane et al. (2002) Slane, P. O., Helfand, D. J., & Murray, S. S. 2002, ApJ, 571, L45
- Stappers et al. (2003) Stappers, B. W., Gaensler, B. M., Kaspi, V. M., van der Klis, M., & Lewin, W. H. G. 2003, Science, 299, 1372
- Strom (1987) Strom, R. G. 1987, ApJ, 319, L103
- van der Swaluw et al. (2003) van der Swaluw, E., Achterberg, A., Gallant, Y. A., Downes, T. P., & Keppens, R. 2003, A&A, 397, 913
- van der Swaluw (2004) van der Swaluw, E. 2004, AdSpR, 33, 475
- Wang et al. (1993) Wang, Q. D., Li, Z., & Begelman, M. C. 1993, Nature, 364, 127
- Wang & Gotthelf (1998) Wang, Q. D. & Gotthelf, E. V. 1998, ApJ, 494, 623
- Wang et al. (2001) Wang, Q. D., Gotthelf, E. V., Chu, Y.-H., & Dickel, J. R. 2001, ApJ, 559, 275
- Wang & Seward (1984) Wang, Z. R. & Seward, F. D. 1984, ApJ, 285, 607
- Weisskopf et al. (2000) Weisskopf, M. C., et al. 2000, ApJ, 536, L81
- Wilkin (1996) Wilkin, F. P. 1996, ApJ, 459, L31
- Yakovlev et al. (2002) Yakovlev, D. G., Kaminker, A. D., Haensel, P., & Gnedin, O. Y. 2002, A&A, 389, L24
- Yakovlev & Pethick (2004) Yakovlev, D. G., & Pethick, C. J. 2004, ARA&A, 42, 169
| Region | /T(keV) | Flux |
|---|---|---|
| Point Source | ||
| Powerlaw+blackbody | ||
| powerlaw | 353 | |
| blackbody | ||
| Powerlaw | 352 | |
| Bow shock | 2.1 | |
| Tail Emission | 3.60.7 | |
| Plateau | 614 | |
| Southwestern Diffuse Emission | 8.00.9 | |
| Eastern Diffuse Emission | 5.40.7 | |
| Outer Diffuse Emission | 131 | |
| Entire nebula | 1.730.03 | 965 |
| cm-2 | |||
|---|---|---|---|
| Regions | Flux | cm | |
| Center | 101 | ||
| Ring 1 | 201 | ||
| Ring 2 | 141 | ||
| Ring 3 | 101 | ||
| Ring 4 | 81 | ||
| Ring 123 | 422 | ||