The complex Star Formation History of NGC 1569 ††thanks: Based on observations with the NASA/ESA Hubble Space Telescope, obtained at the Space Telescope Science Institute, which is operated by AURA Inc. for NASA under contract NAS 5-26555.
Abstract
We present new results on the star formation history of the dwarf irregular galaxy NGC 1569. The data were obtained with Hubble Space Telescope’s NICMOS/NIC2 in the F110W (J) and F160W (H) near-infrared (NIR) filters and interpreted with the synthetic color-magnitude diagram method. The galaxy experienced a complex star formation (SF) activity. The best fit to the data is found assuming three episodes of activity in the last 1 2 Gyr. The most recent and strong episode constrained by these NIR data started yr ago and ended yr ago, although we cannot exclude that up to three SF episodes occurred in this time interval. The average star-formation rate (SFR) of the episode is M⊙ yr-1 kpc-2, in agreement with literature data. A previous episode produced stars between yr and yr ago, with a mean SFR about 2/3 lower than the mean SFR of the youngest episode. An older SF episode occurred about yr ago. All these SFRs are 2 3 orders of magnitude higher than those derived for late-type dwarfs of the Local Group. In all cases an initial mass function similar to Salpeter’s allows for a good reproduction of the data, but we cannot exclude flatter mass functions. These results have been obtained adopting a distance of 2.2 Mpc and a reddening E(B-V)=0.56. A larger distance would require younger episodes and higher SFRs. We have explored some possible scenarios using the astrated mass in the best fit model, in order to constrain the past star formation history. We cannot rule out a low rate in the past SF but we can safely conclude that the last 1 2 Gyr have been peculiar.
Subject headings:
galaxies: evolution — galaxies: individual: NGC 1569 — galaxies: irregular — galaxies: dwarf — galaxies: stellar populations1. Introduction
In the last decade the field of galaxy evolution has gained substantial momentum, owing to the wealth of high-quality multi-wavelength surveys from the main ground and space-based telescopes and sophisticated theoretical models. Nonetheless, the current knowledge of the major physical mechanisms for galaxy formation and evolution is still affected by serious uncertainties. Traditionally, star formation (SF) in cosmology and galaxy formation studies is naively described by simple universal laws, and the stellar initial mass function (IMF) is assumed to be constant in time and space. The only way to obtain detailed information on these crucial evolution parameters is to study the stellar populations of nearby galaxies and derive the SF history (SFH) over cosmological timescales. One of the fundamental tools is the color-magnitude diagram (CMD) of the galaxies resolved into single stars. Since all the CMD features are related to the evolutionary state of the stellar populations, we can understand the SFH of a certain region within a galaxy by interpreting its CMD in terms of stellar evolution theory with the method of the synthetic CMDs. In theory, from the CMD we can infer how many bursts have occurred, their duration and star formation rate (SFR), and the initial mass function (Tosi et al., 1991; Greggio et al., 1998) for any star-formation law and metallicity. In practice, observational errors and theoretical uncertainties impose severe restrictions. The requirement of resolving a galaxy into stars limits the exploration of the SFH to nearby galaxies. At present, even the largest telescopes only permit such studies for galaxies with distance 15 20 Mpc, i.e., in the local universe. In this limited space volume we find many spirals and a plethora of both late and early dwarf galaxies.
Dwarf irregular galaxies (dIrrs) and blue compact galaxies (BCDs) play a major role in the field of galaxy evolution (Grebel, 1997; Mateo, 1998). With their high gas content and low metallicity, they could be similar to primeval galaxies (Izotov et al., 1997) and the best possible sites for determining the primordial 4He abundance (Izotov & Thuan, 2004; Olive & Skillman, 2004). It has been suggested that the excess of number counts of faint blue galaxies at redshift z 1 may be ascribed to dwarf galaxies undergoing their first burst of SF(Ellis, 1997). Dwarf galaxies are important in galaxy formation models since in hierarchical models they are assumed to be the building blocks from which other types of galaxies form through merging.
Key questions on the evolution of late-type dwarfs are: did all the dIrrs and BCDs experience SF in the past? If so, what are the properties of the SF episodes? Several stellar population studies have suggested that dIrrs are characterized by a gasping (episodes of moderate activity separated by short quiescent phases) SF with no evidence of extended gaps (Tosi et al., 1991; Schulte-Ladbeck et al., 2001; Dolphin et al., 2003; Skillman et al., 2003). Their SFR is not strong enough to explain the faint galaxy counts excess.
NGC 1569 is a dIrr near the Local Group. Its intrinsic distance modulus has been estimated to be 26.71 0.60 (Arp & Sandage, 1985; Israel, 1988; Waller, 1991), corresponding to a distance of 2.2 0.6 Mpc. O’Connell, Gallagher & Hunter (1994) obtained a distance modulus of 27.0 0.5 corresponding to 2.5 0.5 Mpc, while Karachentsev, Tikhonov & Sazonova (1994) and Richer & McCall (1995) found 1.8 0.4 Mpc and 1.7 Mpc, respectively. Recently, Makarova & Karachentsev (2003) derived a new distance to NGC 1569 based on the I magnitude of the tip of the red giant branch (RGB). Their data are consistent with two possible distances: 1.95 0.2 or 2.8 0.2 Mpc. Hereafter we adopt a distance of 2.2 0.6 Mpc (Israel, 1988), which encompasses the wide range of distances proposed in the literature.
The low Galactic latitude (b ) of NGC 1569 implies significant Galactic reddening. Burstein & Heiles (1984) estimated a value of for the foreground extinction using the HI column density. Israel (1988) found a total extinction of from the UV color-color diagram. Furthermore, many authors have suggested the existence of a strong, differential, internal reddening. Gonzalez-Delgado et al. (1997) found a total reddening of in the direction of the super star clusters (SSCs), where the component of the intrinsic reddening is . Devost, Roy & Drissen (1997) estimated the Galactic extinction to be and the intrinsic mean extinction , using optical emission spectra of the ionized gas in NGC 1569. Kobulnicky & Skillman (1997) found a variation of the total reddening in the galaxy from to with an average value (with R = 3.1). They found it reasonable to assume a Galactic foreground of and ascribe the difference to the internal reddening. In Kobulnicky & Skillman (1997), the extinction for the area discussed in the present paper is , except for the SSCs and HII regions. Origlia et al. (2001) derived a foreground extinction of and an intrinsic reddening of from UV spectra. The simulations presented in this paper assume (Israel, 1988).
The mean oxygen abundance of NGC 1569 found in the literature is dex. With an assumed [O/Fe], the average metallicity is then 0.25 corresponding to (see Greggio et al., 1998, and references therein) if 111In the last years, the solar abundances have undergone major revisions (Asplund et al., 2004). The current estimate of the solar metallicity is .
This rather exceptional dwarf galaxy is known to contain two SSCs, SSC-A and SSC-B, with SSC-A having two components, A1 and A2 (De Marchi et al., 1997; Origlia et al., 2001). Many HII regions are observed in those zones where SF is currently active (Waller, 1991). Nevertheless, NGC 1569 is considered a “post” star-forming galaxy with a total dynamical mass of Mdyn M⊙ (Israel, 1988), one–third of which is neutral hydrogen gas (MHI 1.3 M⊙, Stil & Israel, 2002). This galaxy is a gas-rich system in a relatively early stage of chemical evolution. Many filaments are found at different wavelengths, and there is a strong spatial correlation between the extended X-ray emission and the Hα filaments (Martin et al., 2002). The HI emission of NGC 1569 shows a dense, clumpy ridge distribution surrounded by a more extended diffuse neutral hydrogen. There are discrete features such as arms and bridges (Stil & Israel, 2002). In the IR, Lisenfeld et al. (2002) found both large and very small grains exposed to a strong radiation field. Galliano et al. (2003) found different dust properties in NGC 1569 (most of the grains are small) compared to other more metal rich galaxies. These results are consistent with the presence of shocks having dramatic effects on the dust. In the optical, deep images show filaments and arcs of warm ionized gas. These filaments have a length of several kiloparsecs with typical velocities around 50 100 km s-1. The highest velocities, up to 200 km s-1, have been attributed to expanding superbubbles with dynamical ages of 10 Myr (Waller, 1991) generated by a strong SF episode. At high energy, X-ray observations reveal that of the soft X-ray emission in NGC 1569 is centered between the two SSCs. Its origin is attributed to thermal emission from the hot gas of a galactic superwind emanating from the disk (Heckman et al., 1995). Chandra observations find many high-mass X-ray binary systems and large inhomogeneities in the metal abundances of the interstellar medium (ISM) with ranges from to (Martin et al., 2002). This is evidence that the ISM has been affected by numerous supernova explosions from a recent SF episode (Martin et al., 2002). Hydrodynamical simulations of D’Ercole & Brighenti (1999) demonstrated that a galactic wind triggered only by SNII explosions (i.e. without stripping or other environmental effects) would not be very effective in removing the ISM in NGC 1569. In fact, even if most of the metal-rich stellar ejecta can be efficiently expelled from the galaxy and dispersed in the intergalactic medium, cold and dense gas replenishes the central region of the galaxy a few hundred million years after the starburst.
The SFH of NGC 1569 has most recently been studied by two groups with Hubble Space Telescope (HST) data. In optical bands (V and I), Vallenari Bomans (1996) found a global SF episode from 100 Myr ago to 4 Myr ago and hints of an older episode of SF from 1.5 Gyr ago to 150 Myr ago. They ruled out the existence of long quiescent phases in the last 1.5 Gyr. Based on B and V data, Greggio et al. (1998, hereafter G98) found a global SF episode of 0.1 Gyr duration, ending Myr ago. During the burst, the SFR was approximately constant, and, if quiescent periods occurred, they lasted less then 10 Myr. The derived SFR is very high and equal to 3, 1 or 0.5 M⊙ yr-1 for a single slope initial mass function222Throughout this paper we parameterize the IMF as . In this notation, Salpeter’s slope is 2.35 with an exponent 3, 2.6 or 2.35, respectively, and a mass range from 0.1 to 120 M⊙. From HST NICMOS images, Aloisi et al. (2001, hereafter AL01) found that young stars (M M⊙, age Myr) are more clustered around the two SSCs, while the intermediate-age objects ( M⊙ M M⊙, 50 Myr age 1 Gyr) have an almost uniform distribution, and the old stars (M M⊙, age Gyr) are located at the outskirts of the starbursting region.
All these studies show that NGC 1569 experienced a strong SFR in recent epochs. With a total mass of M⊙, the system cannot have sustained such a strong activity over a Hubble time, since it would have consumed all the gas in less than 1 Gyr (G98). The question then is whether the SF in NGC 1569 has started only in relatively recent epochs or has lasted for several gigayears but at much lower rates. Our goal is to obtain a better understanding of the past history of this galaxy. The best way to study old stellar populations, at least in principle, is to observe in the IR bands where the RGB phase is more evident, and where reddening effects are not as severe as in optical bands.
In this work, we derive the SFH with the synthetic CMD method [Tosi et al. (1991) and G98] using the data of AL01 in the NIR filters. In Section 2 we summarize the data and the observed CMD. In Section 3 we briefly describe the CMD method and the artificial star experiment in order to derive completeness and photometric errors. The results are presented in Section 4. They are discussed and compared with the literature in Section 5.
2. From the observations to the CMD
We briefly summarize the main characteristics of the observations and photometric reductions; for further details, see AL01. The observations of NGC 1569 were performed in 1998 with the NICMOS/NIC2 camera on board of HST in the F110W and F160W filters. The images cover the crowded central region of the galaxy, where SSC-A, SSC-B, cluster #30, and part of an extended HII region complex are present. The NIC2 camera has a field of view of , corresponding to pc2 at a distance of 2.2 Mpc. The observations were taken with dithering. The resulting “drizzled” images have a point-spread function (PSF) FWHM of 3.0 and 3.9 pixels in F110W and F160W, respectively, and a pixel size of , which corresponds to pc.
The photometric reduction has been performed by AL01 using DAOPHOT via PSF fitting. PSF-fitting photometry is not the ideal procedure for drizzled images, because drizzle creates a position-dependent PSF smearing and produces correlated noise between adjacent pixels (Fruchter & Hook, 2002). However PSF-fitting is the only viable technique in a crowded field like the central region of NGC 1569. AL01 used the deepest image (F110W) to locate the stars and used their coordinates to force photometry in the F160W image. This implies that all of the objects detected in the F160W image are also present in F110W but the opposite is not necessarily true. Then, they selected the objects by adopting the DAOPHOT parameters and sharpness and obtained the final catalog of 3177 stars. The objects rejected by the selection criteria described above are typically the brightest objects in the SSCs, smaller star clusters, extended objects, and blends. The star magnitudes were calibrated in the HST VEGAMAG system.
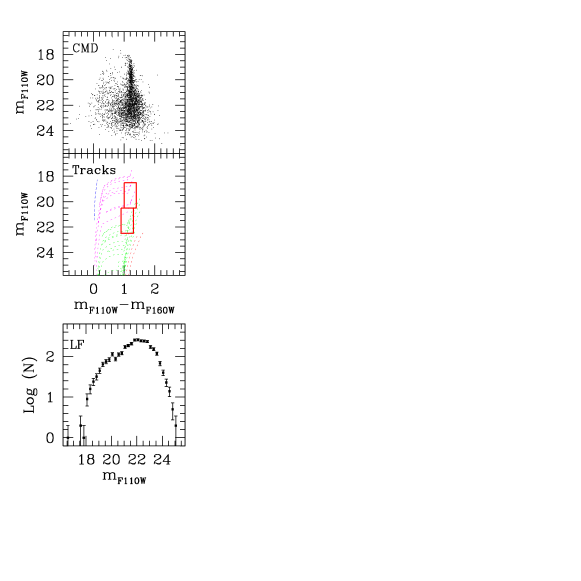
The CMD and luminosity function (LF) for NGC 1569 derived by AL01 are plotted in Figures 1. The limiting magnitude is mF110W 24.5, and the color range is mF110W-mF160W - 3. To easily identify the main evolutionary phases, we plotted the Padova tracks (Fagotto et al., 1994) for a metallicity of Z = 0.004 on the same scale (Fig. 1). The dominant feature is the “red plume” extending from mF110W to . It has a small spread in color (0.2 mag) and a long range in magnitude. The region corresponds to the He burning phases of stars with masses approximately from 9 to 20 M⊙. The more massive stars in our catalog have masses of M⊙, corresponding to ages of Myr. A second feature is defined by the bulk of objects with mF110W and mF110W-mF160W where the tip of the RGB could be located.
Unfortunately, the RGB feature is not recognizable in the observed CMD. The tip of the RGB should be located at mF110W for an adopted distance modulus and On the other hand, the DM uncertainty introduces an uncertainty of 0.6 mag in the location of the RGB tip (between 21.8 and 23.0 in mF110W). In addition, the RGB tip feature on the LF could be blurred in the CMD because the strong SF occurred at intermediate ages, as found by Vallenari Bomans (1996) and in this paper (see below).
3. From the empirical to the synthetic CMDs
The derivation of the SFH from the CMD is critically dependent on the completeness and analysis of the photometric errors. This is particularly true for the oldest populations in a crowded field such as the central region of NGC 1569, where blending of unresolved stars may severely affect our data and create spurious features in the derived CMD. It is therefore crucial to quantify these effects as well as possible by following the recipes of the data reduction, and include them in the construction of the synthetic CMDs.
3.1. Artificial star experiments
We accounted only for the completeness of the F160W frame in our simulations because, as mentioned above, all the stars detected in F160W were previously found in F110W. However, we have performed the artificial star experiment (ASE) in both images, since the photometric errors in both bands are required.
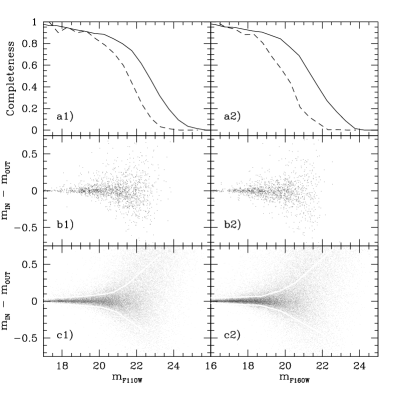
We initially adopted the ASE performed by AL01. They performed tests in which the fake stars have a PSF equal to that adopted in the data reduction. Then a fraction (10%) of the number of detected stars was added at random positions on the image in each run and about 10 runs were performed. The total number of artificial stars was then similar to that of the detected objects. They derived an effective limiting magnitude of the data of mF160W and a 50% completeness level at mF160W . In the top panels of Figure 2 we plot their completeness and photometric error distributions. The results obtained for mF160W (mF110W) are shown in the right (left) panel. In the top panels we plot the completeness factors from AL01 as dashed lines, while in the middle panels we draw their estimated photometric error distributions.
When we applied the ASE results from AL01 to the simulations, we found that they do not allow us to reproduce the faintest part of the CMD. For instance, if we simulate an old SF episode (starting yr ago and still active) with the same number of stars of the observed CMD, we obtain a synthetic diagram that underproduces the faint (mF110W 23.5) tail of the LF by . We interpret this result as being due to an underestimate of the true completeness in the AL01 ASE, and we therefore performed new ASE computations. We believe that this is because AL01’s approach does not add a sufficient number of artificial stars at faint magnitudes, where crowding, blending and incompleteness are very severe. We therefore adopted a procedure developed by P. Montegriffo at the Bologna Observatory (Tosi et al., 2001), which uses artificial stars per band. We have put fake stars in the images according to a LF similar to the observed one. At brighter magnitudes this LF follows the observed one, but at low luminosities, a higher number of stars is required because of the high probability of losing objects because of crowding. All the fake stars have a PSF equal to that adopted in the actual data reduction. To avoid artificial crowding, we divided the frames in grids of cells of known width, and we randomly positioned only one fake star per cell at each run. We forced each star to have a distance from the cell edges large enough to guarantee that all its flux and background measuring regions fell within the cell. In this way, we could control the minimum distance between adjacent stars. At each run, the position of the grid is randomly changed and the artificial stars are then searched in the image by using the same procedure adopted for the real data and selected with the same criteria.
An artificial star was considered lost when the difference between the input and output magnitude was larger than 0.75. Such a difference implies that the artificial star overlaps with another star of the same luminosity or brighter. In the top panels of Figure 2, the completeness derived using Montegriffo’s method is shown as a solid line. The photometric error distributions are plotted in the bottom panels as dots. The effective limiting magnitude of the data is mF160W and the sample is 50% complete at mF160W . We found a posteriori that the completeness function obtained with Montegriffo’s method allows us to reproduce the faint LF significantly better than with the previous ASE.
The input–output magnitude difference of the artificial stars provides an estimate of the photometric errors, which is safer than the error indicators of the reduction package ( in our case). The outcomes are plotted in panels 2b and c for the ASE approaches by AL01 and Montegriffo, respectively. The synthetic CMDs obtained by adopting the photometric errors from the artificial star tests, usually reproduce the color and magnitude spread of the observational CMDs very well [see e.g. Gallart et al. (2002), Smecker-Hane et al. (2002), Tosi et al. (2002), Annibali et al. (2003)]. In this case, however, by adopting the input–output magnitude difference of Fig. 2b as photometric error, we obtain an excessively large color spread in the sequences of the synthetic CMD. This effect is clearly evident along the red plume, where the observed CMD is tight in color. We therefore used the synthetic CMDs to heuristically infer the appropriate error distribution in each filter. First, we cut the wings of the photometric error distributions at the level in each magnitude bin, and adopted these distributions to derive a test CMD. Since in this test CMD the photometric error still has a color distribution larger than observed, we iterated the cutting procedure until we obtained photometric error distributions capable of reproducing the spread in the main features of the CMD. The cuts performed on the photometric error distributions eventually adopted are those shown within the solid lines in the bottom panels of Fig. 2.
3.2. Preliminary tests
We have also checked whether different portions of the image have different completeness and photometric errors. To this end, we have divided the NIC2 images into three regions: the central one covering the most crowded part of the image including the SSCs, and the other two towards the edges in opposite directions. No relevant deviation has been found either in the completeness factors or in the input–output magnitude difference of the three regions.
Many authors have found evidence of spatially variable intrinsic extinction in NGC 1569; this extinction increases toward the central region of the galaxy, where SSCs and HII regions are located (Gonzalez-Delgado et al., 1997; Devost, Roy & Drissen, 1997; Kobulnicky & Skillman, 1997; Origlia et al., 2001). We have divided the image in subregions and compared the corresponding color functions in order to investigate whether strong differential reddening is present in our field. No significant differences in the color distributions have been detected from the image center to the edges. We are confident that differential reddening is not an issue in our pc2 sized region.
Since the CMDs of all the subregions show similar photometric errors, completenesses and color distributions, we have derived a global SFH over the whole pc2 image.
3.3. The synthetic CMD method
The synthetic CMDs are constructed via Monte Carlo extractions of (mass, age) pairs, according to an assumed IMF, SF law, and initial and final epoch of the SF activity. Each synthetic star is placed in the theoretical plane by suitable interpolations on the adopted evolutionary tracks (in this case, the Padova sets by Fagotto et al., 1994). Luminosity and effective temperature are transformed into the desired photometric system by interpolation within appropriate tables for photometric conversions [the transformations to the VEGAMAG system by Origlia & Leitherer (2000), in this case], and the resulting absolute magnitude is converted to a provisional apparent magnitude by applying reddening and distance modulus. An incompleteness test on the F160W magnitudes is then performed, based on the results from Montegriffo’s ASE. A photometric error is assigned to all the retained stars by using the “modified distributions” discussed in Section 3.1. The value of the SFR is obtained when the number of objects in the synthetic CMD (or in regions corresponding to specific evolutionary phases) is consistent with the observational data. When the examined CMD region contains only a few objects, we perform several simulations in order to avoid problems due to small number statistics. In these cases, we adopted the average value of the resulting SFRs.
4. Simulations
In order to derive the SFH of a galaxy, we explore a parameter space dependent on the distance modulus, reddening, IMF, SF law, metallicity, and age of the episodes. We obtain a solution when we have a combination of parameters that generate a synthetic CMD similar to the observed one. The exploration is also limited by the intrinsic uncertainties of the theoretical models, like those introduced by the stellar evolution tracks and the photometric conversions.
First, we attempt to reproduce the observed CMD with a single episode and metallicity model over the whole range of ages covered by the empirical CMD. If a single episode does not reproduce the observed CMD, we assume multiple SF events. If a single metallicity does not allow us to simulate an acceptable CMD, we try to change the metallicity for each episode. Then we perform other simulations in order to check the effect on the resulting SFH by assuming different IMFs, distance moduli and reddenings.
This approach gives us an indication of the uncertainty on the results of our simulations. It allows us to identify the range of the parameter values leading to a satisfactory agreement with the data, and to reject those clearly inconsistent with the observational evidence. Following this line of thought, we will show the simulated episodes that fit the observed data but also some of the bad episodes, because they provide hints for a better understanding of the SFH. We ran more than 1000 simulations to infer the SFH of the complicated case of NGC 1569.
We first present the results obtained by adopting , , and a Salpeter IMF (2.35) over the whole mass range from 0.1 to 120 M⊙. In paragraph 4.3 we discuss the effect of assuming different values for the IMF slope, distance and reddening parameters. The models all assume a constant SFR within the specific age ranges; we always report the SFR of each episode both in M⊙ yr-1 kpc-2 and in M⊙ yr-1 (the latter in brackets).
4.1. Single episode SF
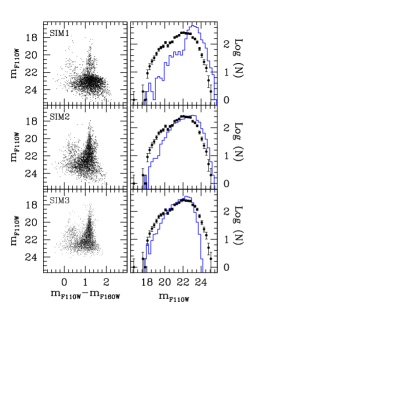
We have run several cases with a single episode of SF in NGC 1569, all constrained to reproduce the total number of stars in the observed CMD. Here we describe only three representative models: the first one (hereafter SIM1, plotted in Fig. 3) assumes a long SF activity, commencing 5 Gyr ago and still ongoing. The second model (hereafter SIM2, plotted in Fig. 3) assumes a SF commencing only 500 Myr ago and terminating 10 Myr ago. The third simulation (hereafter SIM3, plotted in Fig. 3) generates stars from 150 to 10 Myr ago.
SIM1 has a SFR of 0.28 M⊙ yr-1 kpc-2 (0.01 M⊙ yr-1). The simulated objects are concentrated in the lower, fainter part of the CMD (mF110W 22.5), where the low-mass stars in the RGB phase are located. The observed CMD does not show a similar concentration of objects in the faintest part. Conversely, at brighter magnitudes (mF110W 22.5), the synthetic red plume shows a star deficiency with respect to the observed LF. These inconsistencies show that the bulk of the assumed SF activity is located at excessively early epochs and provides too many old stars. At the same time the synthetic CMD is populated by blue massive stars (with M M⊙). A dozen of these synthetic stars are in the main-sequence phase. However, we cannot clearly distinguish the main-sequence from the other evolved phases in the observed CMD because of the large photometric errors at faint magnitudes. We have also performed several simulations to overcome the small number statistics of the stars located at bright luminosity (mF110W ). These simulations suggest that too many red supergiant stars are produced without observational counterparts. We can conclude that, in addition to the excess of old stars in the synthetic CMD, we also have an excess of young stars. This is the reason why in SIM2 we have turned on the SF more recently and turned it off earlier (10 Myr ago).
SIM2 has a SFR 1.1 M⊙ yr-1 kpc-2 ( 0.04 M⊙ yr-1) and fails to account for the brighter stars of the red plume. Again, at faint magnitudes, SIM2 shows an excess of stars. In both simulations (SIM1 and SIM2), we have a feature in the region mF110W and mF110W-mF160W , which corresponds to stars with masses M⊙ in the AGB phase and does not appear in the observed CMD. We then tried to simulate the CMD with a single episode starting yr ago and terminating 10 Myr ago in order to avoid these stars. SIM3 has a SFR of M⊙ yr-1 kpc-2 (0.07 M⊙ yr-1). This simulation avoids the feature obtained in SIM1 and SIM2 but shows a shortage of stars at low luminosities (mF110W ) and at the top of the red plume (mF110W ), and an excess of objects in the middle ( mF110W ) of the luminosity function.
At the end of these preliminary simulations, no solution has been found that simultaneously fits both the bright and the faint parts of the CMD. Hence, a single episode cannot reproduce the observed CMD: to improve the fit to the data, we need to perform multiple-episode cases.
4.2. Multiple episodes SF
We use the age-box procedure to investigate multiple episodes. The basic idea is that we can perform our analysis by dividing the CMD in regions (boxes) populated by stars with selected properties, such as age or evolutionary phase (Greggio, 2002). A similar procedure is adopted by Gallart et al. (1996). The star counts in each box are directly linked to the mass that went into stars in the SF episodes that occurred at the corresponding epochs, i.e. the average SFR over the specific time intervals (Greggio, 2002).
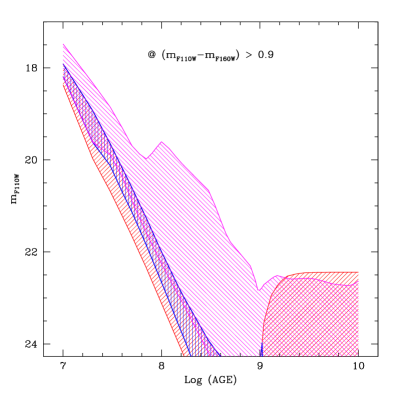
In order to better understand the age-box procedure, we introduce Figure 4 where we plot the apparent magnitude versus age of red (mF110W-mF160W ) post main sequence stars. Vertical shading indicates to He-burning stars, and slanted shading indicates RGB (angle ) and E-AGB (angle ) stars. Because of the evolutionary lifetimes, the red stars at magnitudes brighter than 22.4 (where the tip of the RGB is located) are mostly core-He burning objects. The straight relation between their magnitude and age (Fig. 4, thick shaded strip) translates into a good temporal resolution of the SFH at ages younger than about 0.1 Gyr. This allows us to obtain precise results in the boxes corresponding to the top of the red plume. At magnitudes fainter than 22.4, each LF bin collects (in principle) stars with ages up to the Hubble time. The stellar counts in this region allow us to derive only integrated information.
In practice, we first define the magnitude ranges of the box by identifying the features in the LF333The comparison between model and data is performed selecting the red LF. However, in this paper we report only on the total luminosity function, since our CMD is mostly composed by a red population and the red LF does not significantly differ from the total one. that suggest a possible discontinuity in the star formation. The color ranges are chosen in such a way to account for the spread because of the photometric errors. These ranges constrain the box that defines our partial model, which is constrained to reproduce the observed stellar counts in the box with a SF activity within a specific age range. The limits for the age range are read from Fig. 4 in correspondence to the magnitude limits of the box. Besides the objects in the box, the simulation also populates the diagram in regions different from the box described above; we take these “additional” objects into account when we perform the simulations in the other parts of the CMD. We have run hundreds of cases to infer the best combination of parameters. However, for the sake of clarity, here we simply describe the line of reasoning and show the most relevant results from all these tests. This method has been applied and extensively discussed by Schulte-Ladbeck et al. (2000); Crone et al. (2002); Schulte-Ladbeck et al. (2002); Annibali et al. (2003).
4.2.1 One box simulations
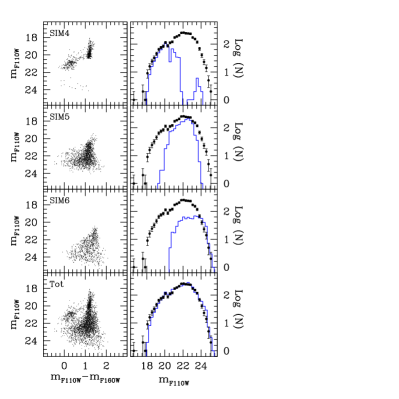
Following the above reasoning, we define the box (hereafter BOX1) in the magnitude range mF110W (at mF110W a dip in the LF is noticeable) and colors mF110W-mF160W (to take into account the photometric errors). Figure 4 shows that in BOX1 we are sampling core-He burning stars in the age range yr; these objects are the youngest, most massive stars of the red plume. This box also includes a population of lower-mass stars in the AGB phase; because of their short lifetimes in this magnitude range, these stars provide a minor contribution to the overall population.
After many simulations, we find the best parameter combination (SIM4) that reproduces the number counts in BOX1 (Fig. 5). SIM4 is an episode commencing yr ago and finishing yr ago with a mean SFR of M⊙ yr-1 kpc-2 ( M⊙ yr-1). We performed other simulations by slightly changing the boundary ages of the episodes for an estimate of the uncertainty affecting the determination of the age intervals.
Other possible solutions have a starting epoch in the range yr ago, and an ending epoch in the range yr ago. In all the explored cases, the simulations for this young episode share a problem that is also visible in SIM4: an overproduction of stars with mF110W-mF160W (hereafter blue bulk). This structure corresponds to the blue edge of the blue loop phase of M⊙. We cannot remove this feature without underproducing the objects in the red plume. The number of objects generated in this recent SF episode is 20% of the total.
We have then tried to simulate the remaining objects with a single episode, but we have not succeeded in reproducing the LF. If we construct single episodes starting at epochs earlier than yr ago and terminating yr ago, we obtain too many faint objects (mF110W ) and too few stars in the range mF110W in the synthetic diagram. On the other hand, an episode that begins to form stars yr ago, does not produce a sufficient number of objects at faint magnitudes.
The lack of success in reproducing the LF with only two episodes led us to consider other scenarios.
4.2.2 Two box simulations
The second box (hereafter BOX2) is defined in the magnitude range mF110W and color mF110W-mF160W and targets the intermediate ages. The bright limit is fixed by BOX1, while the faint limit is chosen to be slightly brighter than the RGB tip in order to exclude possible blended RGB stars from the counts. From Fig. 4, one can see that stars falling in BOX2 have ages in the range yr to yr, if they are core-He burners. The color limits of BOX2 were indeed chosen with the aim of isolating core-He burning stars, while taking into account the color spread due to photometric errors.
The best simulation for BOX2 (hereafter SIM5) accounts for of the objects and is plotted in the second panels from the top in Fig. 5. SIM5 has a SFR 1.2 M⊙ yr-1 kpc-2 (0.04 M⊙ yr-1). This episode started forming stars yr ago and terminated yr ago. The starting epoch is older than the yr mentioned above. When computing the simulations, we vary the starting and ending epoch around the values derived from Fig. 4 in order to fit the observed LF with the minimum number of individual SF episodes. It turns out that starting at yr allows us to fit the stellar counts in the range 22.5 23.5 without adopting a new box. Notice that at such magnitudes the completeness factors fall below .
If we assume that a quiescent phase (or one with low SFR) occurred yr ago, we can also reproduce the shape of the LF in the magnitude range mF110W . This kind of short inter-burst phases has also been found by G98.
4.2.3 The remaining objects
The simulations computed to reproduce the stellar counts in BOX1 and BOX2 account for about 70% of the total number of observed objects. The remaining 30% must be ascribed to SF that occurred at epochs older than yr. From Fig. 4, we see that the CMD in the magnitude range can be populated with a mixture of relatively young He-burning stars [with ages of yr], early-AGB stars with intermediate ages (up to 1 yr), and RGB stars with ages up to the Hubble time. Therefore, we tested various starting epochs for the oldest episode of SF sampled by our data.
First, we attempted to account for the remaining stars by considering He-burning objects with ages between yr and yr. The simulation fits the LF fainter than mF110W reasonably well, but yields too many stars in the region mF110W at colors mF110W-mF160W . The overproduction amounts to a factor of . These are bright E-AGB stars with masses between 4 and 6 M⊙. As discussed in Section 4.1, these synthetic objects were also produced in SIM2, which assumed active SF at intermediate ages. If we use the number counts in the box mF110W ; mF110W-mF160W to constrain the SF activity at ages between and yr ago, we obtain a SFR level of 0.14 M⊙ yr-1 kpc-2 (0.006 M⊙ yr-1), which is 1 order of magnitude lower than the rate of NGC 1569 in the young and intermediate episodes. We then tested SF episodes setting in at various epochs, but all ending yr ago, to avoid the overproduction of these bright AGB stars. We found that if the old SF episode started a few Gyr ago, the upper RGB stands out very clearly on the synthetic CMD, with a prominent horizontal feature corresponding to the tip. This is not seen in the data. For a starting epoch of yr ago, the signature of the RGB tip is no longer apparent, and we obtain consistency with both the CMD and the LF.
We obtain acceptable models for any starting epoch in the range 2 – 0.6 Gyr, with corresponding variations of the SFR. For example, a simulation started yr ago yields a SFR of 0.4 M⊙ yr-1 kpc-2 (0.009 M⊙ yr-1); a simulation started yr ago yields SFR 1.5 M⊙ yr-1 kpc-2 (0.06 M⊙ yr-1). Our best fit is actually the latter, since the former case tends to underproduce the faint AGB stars, corresponding to 3 M⊙ objects (mF110W ) . The best simulation for the remaining objects is shown in Fig. 5 as SIM6, while the best composite CMD is plotted in Fig. 5 with the label Tot.
4.3. Searching for other parameter combinations
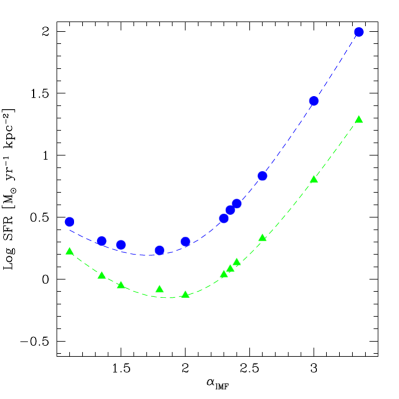
We have performed many other simulations in order to search for alternative solutions; in particular, we considered cases with different IMFs, with slope in the interval . Fig. 6 plots the SFR as a function of the IMF exponent, for the youngest (circles) and intermediate (triangles) episodes. Fig. 6 also shows that the SFR has a minimum at . This behavior is due to the non-linear relation between the slope of the IMF and the number of stars per unit mass of the parent stellar population. By adopting a steep IMF (e.g. ), the low-mass stars are relevant in number and weight with respect to the total population, while the contribution of high-mass stars to the total mass is negligible. For a flat IMF (e.g. ), low-mass stars are still numerous, but their weight decreases. On the other hand, the number of massive objects become slightly higher but their contribution to the total mass increases more than the total number.
We can broadly reproduce the shape of the LF in BOX1 with an IMF flatter than Salpeter’s (down to ). For simplicity, in this paper we have adopted a single-slope IMF, extending Salpeter’s IMF to the mass range M⊙. Gould, Bahcall & Flynn (1997) suggest a slope flatter than Salpeter’s () for M M⊙. Chabrier (2003) has also found that the IMF in the Galaxy depends weakly on the environment and is well described by a power-law for M M⊙ and a log-normal form below this mass, except possibly for early SF conditions. For the Galactic disk, Kroupa & Weidner (2003) found an IMF with a slope in the range M⊙ and a slope that is consistent with Salpeter’s above M⊙. If we extrapolate the SFR at M⊙ by adopting Kroupa’s rather than Salpeter’s IMF, the values become smaller than with the default Salpeter IMF.
We have performed quantitative comparison () between our best model and alternative solutions without the gap in the age range 3740 Myr, and found that the model with the gap is times more probable than the fit without the gap.
Another possible SFH reproducing the brightest portion of the red plume consists of many short episodes in the age interval yr ago. This possibility is also indicated by the “granularity” of the LF. In this case we obtain the best fit with three episodes separated by short periods (few million years) of quiescence or very low SFR. SIM4a started yr ago and terminated yr ago with a SFR of M⊙ yr-1 kpc-2 ( M⊙ yr-1); SIM4b started yr ago and terminated yr ago with a SFR of M⊙ yr-1 kpc-2 ( M⊙ yr-1); SIM4c started yr ago and terminated yr ago with a SFR of M⊙ yr-1 kpc-2 ( M⊙ yr-1). This SFH reproduces remarkably well the brightest portion of the total LF. These three episodes have SFRs equal or higher than the single episode (see SIM4) but their total astrated mass is similar to that. We prefer not to pursue this fine tuning (although we cannot exclude a more complex scenario in the recent star formation) because the shape of the red plume and its LF may be affected by residual star-like systems mistaken as individual stars in spite of all our checks (see AL01) .
There are no clear evolutionary features in the observed CMD (Fig. 1) that allow a precise estimate of the distance modulus of the galaxy. Therefore, we have performed several simulations in order to examine the effects of changing the distance on the derived SFH in NGC 1569. To this end, we have adopted the lowest and the highest values of the DM found in the literature (). In general, we obtain a different fit to the data by changing the DM. For sake of clarity, we only discuss the case of the larger distance, since this could be important in order to understand whether the RGB tip can be hidden. In this case, we derive a younger episode with higher SFR with respect to our best model. This is because a given apparent magnitude samples intrinsically brighter, and hence more massive, stars when DM is larger. As a consequence, a larger number of massive and young stars needs to be reproduced by the simulations. Also, when we modify the distance of the galaxy, we also change the position of the evolutionary features of the synthetic CMD. This effect is important because it could substantially modify the SFH. By adopting , the best fit is obtained with a young episode that has formed objects in the age interval yr ago, and the intermediate SF occurred yr ago. The corresponding SFRs are about 2 times higher than those found for in SIM4 and SIM5. A SF with a rate of 0.8 M⊙ yr-1 kpc-2 (0.04 M⊙ yr-1) that occurred in the age interval yr ago is consistent with the data. We can exclude a strong SF occurring at ages older than 1 2 Gyr because the RGB tip would be clearly present in the CMD despite the higher distance. We want to stress again that, for what concerns the older SF, the results must be qualified by considering the uncertainties at faint magnitudes because of the incompleteness and photometric errors.
The reddening uncertainty suggested by the spread of the literature values shifts the synthetic CMD by 0.05 in color (mF110W-mF160W) and 0.1 in magnitude (mF110W); its effect on the age of the episodes is smaller than those due to the uncertainties on the distance modulus and tracks.
Finally, with the synthetic CMD method, we can provide hints on the metallicity of the SF episode. Our capability to select the metallicity of an episode depends on the photometric errors relative to its main evolutionary phase. In principle, we are able to reject all the metallicities that create unobserved features in the synthetic CMD. The colors of the red plume are best reproduced with Z=0.004; the Z=0.0004 tracks yield red supergiants that are too blue compared to the observations. The Z=0.008 tracks instead produce very red objects. At fainter magnitudes, where the photometric errors are larger, the presence of a low Z population cannot be ruled out, while the Z=0.008 tracks produce stars that are too red with respect to the data.
4.4. Observational and theoretical uncertainties
The low galactic latitude of NGC 1569 () led us to check the number of Milky Way stars falling into our field of view. AL01 ran the Galaxy model described by Casertano et al. (1990) and found that the foreground contamination in our (small) analyzed region is negligible. Major problems in our analysis are instead crowding, the shallow limiting magnitude and the high reddening. Crowding is severe in the central region because the high recent SF activity has generated many bright, young objects that hide fainter, older ones. In addition, the shallow limiting magnitude does not allow us to reliably detect features that could help us to better determine the characteristics of the older episode. From this point of view, despite the high reddening, deeper, higher resolution HST images in optical bands could have possibly provided a better data set to study the earlier epochs. This has been clearly demonstrated by Annibali et al. (2003) in NGC 1705 (a BCD twice as distant as NGC 1569). In that case, WFPC2 photometry has allowed to reach mag below the RGB tip in regions where NIC2 barely allows the identification of the tip.
An additional uncertainty on the analysis of the central region of NGC 1569 comes from the presence of many small clusters (Hunter et al., 2000; Anders et al., 2004) and star-like systems. Most of them appear as bona fide stellar objects in our photometry, with shape, sharpness, and parameters typical of single stars. These unresolved systems could be located in the CMD at the top of the red plume. By keeping or removing all possible cluster candidates from our empirical CMD, we estimate that the star-like systems could change the SFR by 15 20% and shift the end epoch of the youngest episode to an age a few Myr older.
As discussed above and shown in the top panels of Fig. 5, what we called blue bulk in Sect. 4.2 could affect the derivation of the SFR of the youngest episode. This spurious feature could be due either to uncertainties in the bolometric corrections in the infrared filters or to uncertainties in the stellar tracks at the blue edge of the blue loops for the masses 8 12 M⊙. In order to evaluate the influence of the blue bulk, we re-simulated the top of the red plume by locating a box in the region of the blue bulk (20.5 mF110W 21.5 and 0.9 mF110W-mF160W 1.3). By using the same age interval of the youngest episode, the simulation generates a partial model, plotted in Fig. 7, which provides a SFR of 1.6 M⊙ yr-1 kpc-2 (0.06 M⊙ yr-1). This simulation is able to generate only 50% of the total objects in the red plume of the observed CMD and is clearly inconsistent with the data. We also performed many simulations by using Padova tracks of different metallicity, but we found similar problems. In other words, either we reproduce the number of stars in the blue bulk region, but severely underproduce the red plume objects, or we reproduce the red plume and overestimate the blue bulk. We consider the latter option more viable, since the timescales of stellar evolution models at the blue edge of the blue loops are more uncertain than those of the red plume phases. Notice that Greggio et al. (1998) have derived the SFH in the B and V bands adopting both the Geneva and Padova tracks in order to evaluate the uncertainty related to different stellar evolutionary models. They found an excess of synthetic stars at the blue edge of the blue loop with the Geneva tracks but not with the Padova tracks. This suggests that an additional uncertainty comes into play in the blue bulk; for instance, the completeness factor could be overestimated because its color dependence has not been considered in the simulations.
5. Discussion and conclusions
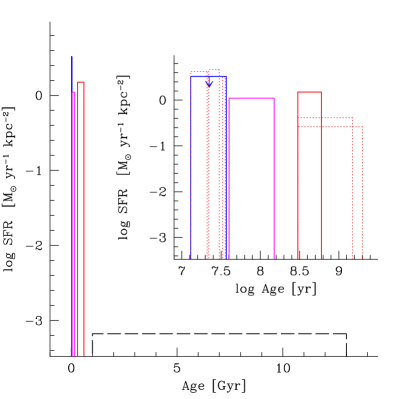
The best agreement between the simulations and the data is obtained by adopting the SFH plotted in Figure 8 (solid line). Keeping in mind that these results are affected by many uncertainties (both in data and models), we can derive the following overall scheme for the SFH of NGC 1569 (Recall that the results described in this paper refer to the central region of the galaxy).
-
-
NGC 1569 has experienced a complex SFH, composed of at least three strong episodes in the last 1 (possibly 2) Gyr.
-
-
The quiescent phase that occurred yr ago is inferred from the small number of M⊙ stars in the AGB phase.
-
-
We need an episode older than yr to reproduce the fainter part of the CMD. This old SF may start as early as 1 2 Gyr ago. The large uncertainties (severe incompleteness, large photometric errors) that characterize the fainter part of the CMD do not allow us to infer reliable details on the SF of the oldest episode. However, we find hints for a significantly lower SF activity (or even a quiescent phase) at ages older than 1 2 Gyr (for a distance of 2.2 Mpc).
-
-
A Salpeter IMF reproduces the brighter part of the observed CMD and the LF reasonably well. A flatter IMF is also able to reproduce the brighter portion of the red plume.
-
-
By assuming a Salpeter IMF over the whole mass range, the most recent SF occurs at a rate of M⊙ yr-1 kpc-2 ( M⊙ yr-1), the intermediate one at a rate of M⊙ yr-1 kpc-2 ( M⊙ yr-1), and the older one at a rate between 0.25 and 1.5 M⊙ yr-1 kpc-2 ( M⊙ yr-1), depending on the assumed duration.
-
-
The uncertainties of the distance modulus affect the estimate of the ages and SFRs of the episodes. The best fit obtained with a larger distance of is yr ago for the young and yr ago for the intermediate episode. The corresponding SFRs are about 2 times higher than those found for . A SF with a rate of M⊙ yr-1 kpc-2 (0.04 M⊙ yr-1) occurred in the age interval yr ago. Also for the larger distance, we can exclude a strong SF that occurred at ages older than 1 2 Gyr because the RGB-Tip would be clearly present in the CMD.
-
-
We cannot exclude more than one SF episodes occurring in the age interval yr . A possible scenario could consist of three episodes with a SFR of 4.2, 4.5 and 3.2 M⊙ yr-1 kpc-2 (0.18, 0.19 and 0.13 M⊙ yr-1) separated by short phases of quiescence or low activity. The uncertainties are due to the possible presence of clusters at the top of the red plume and small number statistics.
By comparing our results and those from the literature for the SFH of NGC 1569, we find overall agreement, although with interesting differences. The end of the youngest episode ( yr ago) is significantly older than that obtained by Vallenari Bomans (1996) and G98, who place it around yr ago, as found from optical HST data. These differences can be explained in terms of a different sensitivity of the different bands (optical vs. NIR) to hot and cold evolutionary phases. Here we are studying young massive stars with NIR data. We are then sensitive to the post-main-sequence phases, where these stars have very short lifetimes. Optical data, more appropriate for main-sequence objects, allow for higher reliability on the youngest stars. On the other hand, the NIR analysis allows us to distinguish the two recent episodes, separated by a short quiescent period, better than with the optical data. In addition, we find evidence for a gap, or a low SF from yr ago to yr ago, similar to that suggested by Vallenari Bomans (1996).
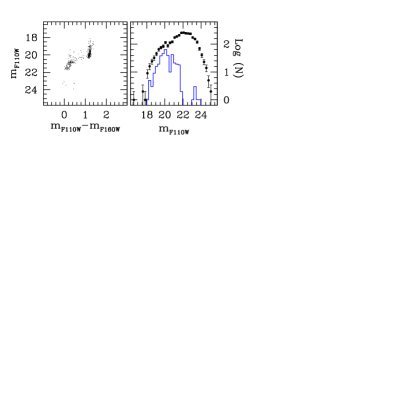
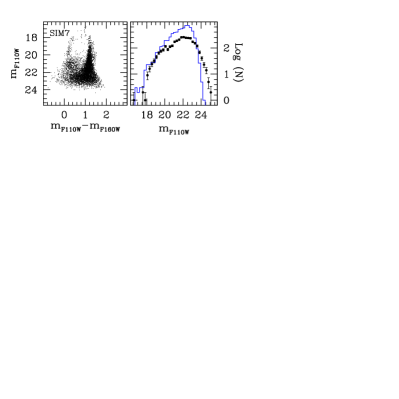
The SFR derived by G98 using the PC camera (which covers an area of pc2 for a distance of 2.2 Mpc), is M⊙ yr-1 kpc-2 in the age interval yr ago. From Fig. 8, we can see that our rate for the youngest episode (SIM4) is slightly lower than that derived by G98. For the intermediate episode, we have derived a SFR times lower than G98. We performed further simulations by adopting the ingredients suggested by the literature cited above in order to better understand these differences. We cannot reproduce the top of the red plume if we simulate the totality of objects in the CMD with a continuous and constant activity starting yr ago and ending yr ago. Furthermore, this simulation underestimates the fainter part of the LF. Another simulation (SIM7, plotted in Fig. 9) assumes the SFR of G98 in the same age interval. The resulting synthetic diagram has twice as many stars than our observed CMD. The total luminosity function is broadly fitted in the brighter part of the red plume but shows an overabundance of objects in the range mF110W , whereas the fainter part is barely populated. From the comparison of the observed LF with that from SIM7, we can learn that:
-
-
If we terminate the SF yr ago, we produce many high-mass stars without observed counterparts;
-
-
In the BOX1 area, SIM7 produces a number of objects times higher than SIM4. Nevertheless, the SFRs of SIM7 and SIM4 are quite similar within the uncertainties since the length of the two simulations is slightly different.
-
-
The simulated objects of SIM7 in the BOX2 region are about times higher than SIM5 (this value is similar to the ratio of the corresponding SFRs). This discrepancy could arise from the uncertainties in the photometric error distribution and completeness factors used in this work and in G98. In addition, the differences in the SFH could result from the differences in the areas sampled by the two cameras.
By using archival HST data, Anders et al. (2004) find a high-level of star cluster formation for ages younger than yr and a lower level of star cluster formation at older epochs, with a secondary peak about 100 Myr ago. The cluster age distribution shows a gap in the age interval yr. These results match our SFH that refers to field stellar population. However, Anders et al. (2004) find a younger age for the end of the last episode, consistent with the results by Vallenari Bomans (1996) and G98. This again suggests that the optical data are more appropriate for studying the most recent epochs.
In order to estimate whether the expanding superbubbles can be plausibly driven by the observed population of massive stars, Heckman et al. (1995) found that the observations can be reproduced reasonably well by assuming an episode with a constant SF over the ages yr ago. The ages of the episode are rather similar to our youngest burst.
By using population synthesis models, Belczynski et al. (2004) have constructed synthetic X-ray binary populations for direct comparison with the X-ray LF and found two principal stellar populations. One is old, metal-poor, with continuous SF from 1.5 Gyr ago and the other is recent and metal-rich. Their results are consistent with ours for the oldest episode, but invoke a recent burst younger than that inferred here. Again, we attribute our earlier termination to the selection effect which makes it difficult to detect blue young stars in the NIR. We remind the reader that the most recent termination epoch for the SF inferred in the optical by G98 only refers to the regions of NGC 1569 where single stars were resolved. There are zones in this galaxy occupied by giant HII region complexes where even with the HST/WFPC2 we were unable to resolve individual stars. The existence of these HII regions clearly suggests that the SF activity must have continued until even more recent times.
All three episodes have SFRs higher by 2–3 orders of magnitude than that of the solar neighborhood [e.g. Timmes, Woosley & Weaver (1995)] and than those inferred with similar methods in other late-type dwarfs [both irregulars and BCDs, see the reviews by Schulte-Ladbeck et al. (2001) and by Tosi (2003)]. The only dwarf analyzed so far with the synthetic CMD method which has a SFR comparable to that of NGC 1569 is NGC 1705 (Annibali et al., 2003). These two dwarfs, in spite of being classified differently (NGC 1705 is a BCD), have quite similar properties, all somehow related to the strong SF activity. They both contain SSCs, show evidence of galactic winds, and have SFRs consistent with those required by Babul & Ferguson (1996) to let dwarfs account for the excess of blue galaxies at intermediate redshift. Neither shows evidence of long quiescent phases in the last couple of Gyrs.
At the rates derived in this paper, the central region of NGC 1569 has formed M⊙ of stars in the last 1 Gyr, i.e. about of the total mass estimated by Israel (1988) and about of the mass that is not associated with neutral hydrogen ( M⊙). The field of view of NIC2 corresponds to an area of 0.04 kpc2, which covers only of the optical size of NGC 1569 [1.76 kpc2 (Israel, 1988)].
To improve our knowledge of the SF history we have compared the integrated optical and infrared fluxes of the whole field and of the resolved stars in the NICMOS area, from the images described by G98 an snd AL01. The integrated magnitudes in the HST F439W, F555W, F110W and F160W filters are 13.7, 12.9, 10.9 and 10, respectively, for the field;444These values do not include the flux from the SSCs and from the HII regions, which were masked on the frames. they are 15.2, 14.5, 12.1, and 11 for the resolved stars. The dereddened m mF160W color of our investigated region is then 1.6, noticeably bluer than the corresponding color for a solar Kurucz model (Kurucz, 1992, (m mF160W) 2.2). The apparent integrated B magnitude of our NICMOS field is m, whilst the total B magnitude of NGC 1569 is m (De Vaucouleurs et al., 1991). Hence, our NICMOS frame samples 20% of the total B light from the galaxy, if the average reddening of the NICMOS region is representative of that of the whole galaxy. Notice that our sampled area is only 2.5% of the total, therefore the SF per unit area in NGC 1569 is very centrally concentrated.
We can explore some possible scenarios in order to place constraints on the past history of NGC 1569. Given the total and HI masses of NGC 1569 estimated by Israel (1988) and the astrated mass in the last 1 Gyr extracted from our CMD procedure and assuming a Salpeter’s IMF over the whole mass range, we are left with only M⊙ for the whole galaxy for the sum of the older stars and the dark matter. Assuming that these old stars were produced at a constant rate over the interval yr ago, the corresponding SFR is M⊙ yr-1. Since this SFR refers to the whole galaxy, the normalized value is M⊙ yr-1 kpc-2. This value is comparable to what has been derived via simulations for dwarf galaxies in the Local Group (see G98 and references therein). For the NIC area, the corresponding astrated mass over the age interval is M⊙. If we simulate an episode that generates the mass over the age interval reported above, we obtain a synthetic CMD that contains of the total objects of the observed CMD. These synthetic stars are on the RGB. Hence, in this scenario we cannot rule out that a constant but low SF might have occurred over the Hubble time.
However, it would be very unusual for a galaxy of this type to have a dark/visible mass ratio much lower than 10. Moreover, chemical evolution models (Romano, Tosi & Matteucci, 2005) show that without the usual dark matter ratio, NGC 1569 would experience too early strong galactic winds and it would be impossible to reconcile the model predictions with the observational data.
In the second scenario (Fig. 8 dashed line) we therefore assume that the stellar component is only 10% of the dynamical mass; then our astrated masses are probably inconsistent with a Salpeter’s IMF extrapolated down to 0.1 M⊙. However if we adopt Kroupa & Weidner (2003) IMF, the central region has generated only of the stellar mass of the galaxy over the last 1 Gyr. The resulting mean SFR over the interval yr ago is M⊙ yr-1 kpc-2. Alternatively, considering an onset of the SF 7 Gyr ago (i.e., the galaxy started to form stars at redshift 1 by adopting the “concordance cosmology” [, , ]), the mean SFR is about 2 times higher than the value above. All these quantities lie in the range of SFRs typical for nearby dwarf galaxies. These scenarios do not allow us to rule out a past SF with a low rate (or similar to the typical SFR of the other dwarf galaxies), but we can safely conclude that the last 1 2 Gyr have been peculiar.
What could be the cause of this peculiar SF in the last Gyr? Interestingly, there is an HI cloud with mass M⊙ located at a projected distance of 5 kpc from NGC 1569. It is connected to the galaxy by a bridge similar in mass to the HI cloud (Stil & Israel, 1998). This cloud may have triggered the star formation (Stil & Israel, 1998). Moreover, according to Muehle (2003), who studied the galaxy with high-resolution HI data, the structure of the galaxy halo is the remnant of an intergalactic HI cloud in the process of merging with the galaxy. If true, this may provide both the cause and the fuel for the strong and concentrated SF activity of NGC 1569.
To better understand the history of this intriguing object, we should try to resolve its stars older than the few Gyr reached by our current data, in both the inner and outer regions. Although the NIR bands are important to explore old stellar population, NICMOS is not an optimal instrument. The detection of the tip of the RGB (if it exists) will be achievable only with the HST Advanced Camera for Surveys, which has both the necessary spatial coverage and resolution.
References
- Aloisi et al. (2001) Aloisi, A., Clampin, M., Diolaiti, E., Greggio, L., Leitherer, C., Nota, A., Origlia, L., Parmeggiani, G. & Tosi, M. 2001, AJ, 121, 1425, (AL01)
- Aloisi et al. (1999) Aloisi, A., Tosi, M. & Greggio, L. 1999, AJ, 118, 302
- Anders et al. (2004) Anders, P., de Grijs, R., Fritze-v. Alvensleben, U. Bissantz, N. 2004, MNRAS, 347, 17
- Annibali et al. (2003) Annibali, A., Greggio, L., Tosi, M., Aloisi, A. & Leitherer C. 2003 AJ, 126, 2752
- Arp & Sandage (1985) Arp, H. & Sandage, A. 1985, AJ, 90, 1163
- Asplund et al. (2004) Asplund, M., Grevesse, N., Sauval, A. J., Allende Prieto, C., & Kiselman, D. 2004, A&A, 417, 751
- Babul & Ferguson (1996) Babul, A. & Ferguson, H. C. 1996, ApJ, 458, 100
- Babul & Rees (1992) Babul, A., & Rees, M. J., 1992, MNRAS, 255, 346
- Belczynski et al. (2004) Belczynski, k., Kalogera, V., Zezas, A. & Fabbiano, G. 2004, ApJ, 601, L147
- Burstein & Heiles (1984) Burstein, D., & Heiles, C. 1984, ApJS, 54, 33
- Calzetti et al. (1994) Calzetti, D., Kinney, A. L., Storchi-Bergmann, T. 1994, ApJ, 429, 582
- Casertano et al. (1990) Casertano, S., Ratnatunga, K. U. & Bahcall J. N. 1990, ApJ, 357, 435
- Chabrier (2003) Chabrier, G. 2003, PASP, 115, 763
- Crone et al. (2002) Crone, M. M., Schulte-Ladbeck, R. E., Greggio, L., & Hopp, U. 2002, ApJ, 567, 258
- De Marchi et al. (1997) De Marchi, G., Clampin, G., Greggio, L., Leitherer, C., Nota, A. & Tosi, M. 1997, ApJ, 479, L27
- D’Ercole & Brighenti (1999) D’Ercole, A. & Brighenti, F. 1999, MNRAS, 309, 941
- De Vaucouleurs et al. (1991) De Vaucouleurs, G., De Vaucouleurs, A., Corwin Jr., H.G., Buta, R. J. Paturel, G., & Fouque, P. Third Reference Catalogue of Bright Galaxies, 1991, version 3.9
- Devost, Roy & Drissen (1997) Devost, D., Roy, J., & Drissen, L. 1997, ApJ, 482, 765
- Dolphin et al. (2003) Dolphin, A. E., Saha, A., Skillman, E. D., Dohm-Palmer, R. C., Tolstoy, E., Cole, A. A., Gallagher, J. S., Hoessel, J. G. & Mateo, M. 2003 AJ, 126, 187
- Ellis (1997) Ellis, R. S. 1997, ARA&A, 35, 389
- Fagotto et al. (1994) Fagotto, F., Bressan, A., Bertelli, G. & Chiosi, C. 1994, A&A, 105, 29
- Fruchter & Hook (2002) Fruchter, A. S. & Hook, R. N. 2002, PASP, 114, 144
- Gallart et al. (1996) Gallart, C., Aparicio, A., Bertelli, G. & Chiosi, C. 1996, AJ, 112, 6
- Gallart et al. (2002) Gallart, C., Aparicio, A. & Bertelli, G. 2002, in Observed HR diagrams and stellar evolution, T.Lejeune and J.Fernandes eds, ASP Conf.Ser., 274, 483
- Galliano et al. (2003) Galliano, F., Madden, S. G., Jones, A. P., Wilson, C. D., Bernard, J. P. & Le Peinter F. 2003, A&A, 407, 159
- Gonzalez-Delgado et al. (1997) Gonzalez-Delgado, R.M., Leitherer, C., Heckman, T.M., Cervino, M. 1997, ApJ, 483, 705
- Gould, Bahcall & Flynn (1997) Gould, A., Bahcall, J. N., & Flynn, C. 1997, ApJ, 482, 913
- Grebel (1997) Grebel, E. K. 1997, Reviews in Modern Astronomy, 10, 29
- Greggio et al. (1998) Greggio, L., Tosi, M., Clampin, M., De Marchi, G., Leitherer, C., Nota, A. & Sirianni, M. 1998, ApJ, 504, 725 (G98)
- Greggio (2002) Greggio, L. 2002, in Observed HR diagrams and stellar evolution, T.Lejeune and J.Fernandes eds, ASP Conf. Ser. 274, 444
- Heckman et al. (1995) Heckman, T. M., Dahlem, M., Lehnert, M. D., Fabbiano, G., Gilmore, D., & Waller, W. H. 1995, ApJ, 448, 98
- Hunter et al. (2000) Hunter D. A., O’Connell, R. W., Gallagher, J. S. & Smecker-Hane, T. A. 2000, AJ, 120, 2383
- Kurucz (1992) Kurucz, R. L. 1992, in IAU Symposium 149, The Stellar Populations of Galaxies, ed. B. Barbuy & A. Renzini (Dordrecht:Kluwer), 225
- Israel (1988) Israel, F. P. 1988, A&A, 194, 24
- Israel & van Driel (1990) Israel, F. P. & van Driel, W. 1990, A&A, 236, 323
- Izotov et al. (1997) Izotov, Y. I., Thuan, T. X. & Lipovetsky, V. A. 1997, ApJS, 108, 1
- Izotov & Thuan (1999) Izotov, Y. I. & Thuan, T. X. 1999, ApJ, 511, 639
- Izotov & Thuan (2004) Izotov, Y. I. & Thuan, T. X. 2004, ApJ, 602, 200
- Karachentsev, Tikhonov & Sazonova (1994) Karachentsev, I. D., Tikhonov, N. A., & Sazonova, L. N. 1994, Astronomy Letters, 20, 84
- Kobulnicky & Skillman (1997) Kobulnicky, H. A. & Skillman, E. D. 1997, ApJ, 489, 636
- Kroupa & Weidner (2003) Kroupa, P. & Weidner, C. 2003, ApJ, 598, 1076
- Lilly et al. (1995) Lilly, S. J., Tresse, L., Hammer, F., Crampton, D. & Le Fevre, O. 1995, ApJ, 455, 108
- Lisenfeld et al. (2002) Lisenfeld, U. 2002, A&A, 382, 860
- Lisenfeld, Wilding, Pooley & Alexander (2004) Lisenfeld, U., Wilding, T. W., Pooley, G. G., & Alexander, P. 2004, MNRAS, 349, 1335
- Makarova & Karachentsev (2003) Makarova, L. N. & Karachentsev, I. D. 2003, Astrophysics, 46, 144
- Mateo (1998) Mateo, M. 1998 ARA&A, 36, 435
- Martin et al. (2002) Martin, C. L., Kobulnicky, H. A. & Heckman, T. M. 2002, ApJ, 574, 663
- Muehle (2003) Muehle, S., 2003, PhD Thesis, Rheinische Friedrich-Wilhelms University (Bonn, Germany), unpublished
- O’Connell, Gallagher & Hunter (1994) O’Connell, R. W., Gallagher, J. S., & Hunter, D. A. 1994, ApJ, 433, 65
- Olive & Skillman (2004) Olive, K. A., Skillman, E. D. 2004, astro-ph/0405588
- Origlia & Leitherer (2000) Origlia, L. & Leitherer, C. 2000, AJ, 119, 2018
- Origlia et al. (2001) Origlia, L., Leitherer, C., Aloisi, A., Greggio, L., & Tosi, M. 2001, AJ, 122, 815
- Richer & McCall (1995) Richer, M. G. & McCall, M. L. 1995, ApJ, 445, 642
- Romano, Tosi & Matteucci (2005) Romano, D., Tosi, M. & Matteucci, F. 2005, MNRAS, submitted
- Salpeter (1955) alpeter, E. E. 1955, ApJ, 121, 161
- Schulte-Ladbeck et al. (2000) Schulte-Ladbeck, R. E., Hopp, U., Greggio, L., & Crone, M. M. 2000, AJ, 120, 1713
- Schulte-Ladbeck et al. (2001) Schulte-Ladbeck, R. E., Hopp, U., Greggio, L., Crone M. M., & Drozdovsky, I. O., 2001 Ap&SS, 277, 309
- Schulte-Ladbeck et al. (2002) Schulte-Ladbeck, R. E., Hopp, U., Drozdovsky, I. O., Greggio, L., & Crone, M. M. 2002, AJ, 124, 896
- Skillman et al. (2003) Skillman, E. D., Tolstoy, E., Cole, Andrew A., Dolphin, Andrew E., Saha, A., Gallagher, J. S., Dohm-Palmer, R. C. & Mateo, M. 2003 ApJ, 596, 253
- Smecker-Hane et al. (2002) Smecker-Hane, Tammy A., Cole, Andrew A., Gallagher, J. S. III, Stetson, Peter B. 2002, ApJ, 572, 1083
- Stil & Israel (1998) Stil, J. M., & Israel, F. P. 1998, A&A, 337, 64
- Stil & Israel (2002) Stil, J. M., & Israel, F. P. 2002, A&A, 392, 473
- Timmes, Woosley & Weaver (1995) Timmes, F. X., Woosley, S. E., Weaver, T. A. 1995, ApJS, 98, 617
- Tosi et al. (1991) Tosi, M., Greggio, L., Marconi, G. & Focardi, P. 1991, AJ, 102, 951
- Tosi et al. (2001) Tosi, M., Sabbi, E., Bellazzini, M., Aloisi, A., Greggio, L., Leitherer, C. & Montegriffo, P. 2001, AJ, 122, 1271
- Tosi et al. (2002) Tosi, M., Greggio, L., Annibali, F. 2002, in Observed HR diagrams and stellar evolution, T.Lejeune and J.Fernandes eds, ASP Conf. Ser. 274, 529
- Tosi (2003) Tosi, M. 2003, in Stars in galaxies, M.Bellazzini, A. Buzzoni, S.Cassisi eds, Mem.S.A.It. 75, 103
- Vallenari Bomans (1996) Vallenari, A. & Bomans, D. J. 1996, A&A, 313, 713
- Waller (1991) Waller, W. H. 1991, ApJ, 370, 144
- Weidner & Kroupa (2004) Weidner, C. & Kroupa, P. 2004, MNRAS, 348, 187
- Young et al. (1984) Young, J. S., Gallagher, J. S., & Hunter D. A. 1984, ApJ, 276, 476