An X-ray Transient and Optical Counterpart in the M31 Bulge
Abstract
We have obtained snapshot images of a transient X-ray source in M31 from Chandra ACIS-I and the Hubble Space Telescope (HST) Advanced Camera for Surveys (ACS). The Chandra position of the X-ray nova was R.A.=00:42:56.038 0.08′′, Dec.=+41:12:18.50 0.07′′. The transient was active for at least 6 months. Previous observations set an upper limit before the X-ray outburst, demonstrating variability by a factor of 100 and confirming the transient nature of the source. For the first 6 months after the initial detection, the X-ray luminosity was 61037 erg s-1; it then decayed to 1036 erg s-1 over the following 2 months. An HST observation 29 days after the initial X-ray detection revealed a source at R.A.=00:42:56.042, Dec.=+41:12:18.45 that was . This optical source faded to in 9 months. The HST identification of an optical source at the same position as the X-ray source, fading in concert with the X-ray source, indicates that this optical source is the counterpart of the X-ray transient. The lack of high-mass stars in the region suggests this source is a low-mass X-ray binary, and the X-ray and optical luminosities provide a rough orbital period estimate of 8 days for the system.
1 Introduction
Most Galactic soft X-ray transient (SXT) sources in low mass X-ray binaries show compelling dynamical evidence that they contain a stellar-mass black hole (McClintock & Remillard, 2004). The variability on millisecond timescales and short-term X-ray luminosities reaching 1038 erg s-1 provide further support that these are the some of the most likely black hole candidates known (Charles, 1998). Such objects are therefore of intense interest as sites for more detailed studies of general relativity. Finding such sources in the Galaxy requires all-sky monitoring and difficult distance estimates. Searches for bright transient X-ray sources in nearby galaxies, such as M31, therefore provide a very efficient method for expanding the known sample of these fascinating sources.
Since the M31 bulge is at a known distance, has low extinction, and can be surveyed in a single Chandra observation, it presents an excellent laboratory for searching for transient X-ray sources. Such transient sources appear about once each month in the M31 bulge alone (Williams et al., 2004), and M31 surveys have already discovered nearly fifty transient X-ray sources (Trudolyubov et al., 2001; Kong et al., 2002; Di Stefano et al., 2004; Williams et al., 2004, 2005).
Furthermore, the exquisite angular resolution of the Hubble Space Telescope (HST), allows the individual stars in the M31 bulge to be resolved. Combining this resolution with the positional accuracy of Chandra allows one to search for optical counterparts for transient X-ray sources in the M31 bulge. Presently, optical counterpart candidates have been identified from HST for three transient X-ray sources in M31 (Williams et al., 2004, 2005). Herein, we report the discovery of a new transient X-ray source in the M31 bulge found by our Chandra/HST monitoring campaign. Exceptional positional accuracy and image alignments for the nearly contemporaneous Chandra and HST data sets provide a reliable identification of the optical counterpart.
2 X-ray Data
We obtained Chandra ACIS-I images of the M31 bulge on 26-Nov-2003, 27-Dec-2003, 31-Jan-2004, 23-May-2004, and 17-July-2004. The observations were performed in “alternating exposure readout”, so that every 6th frame had 0.6 seconds of exposure instead of the canonical 3.2 seconds. This mode lowers the effective exposure time by 20%, but it provides a second low exposure image in which bright sources are not piled up. The details of these observations, including target coordinates, roll angle of the telescope, and exposure time, are provided in Table 1.
These X-ray observations were all reduced in an identical manner using the X-ray data analysis package CIAO v3.1. We created exposure maps for the images using the CIAO script merge_all,111http://cxc.harvard.edu/ciao/download/scripts/merge_all.tar and we found and measured positions, position errors, and 0.3-10 keV fluxes for the sources in the image using the CIAO task wavdetect.222http://cxc.harvard.edu/ciao3.0/download/doc/detect_html_manual/Manual.html The positions and errors from the first two detections of the new X-ray transient found in the 26-Nov-2003 ACIS-I (ObsID 4679) observation are given in Table 1. Each data set detected sources down to (0.3-10 keV) fluxes of 810-6 photons cm-2 s-1.
We cross-correlated the X-ray source positions of all 3 observations against all previously published X-ray catalogs and the Simbad333http://simbad.u-strasbg.fr/ database to look for any new, bright X-ray source likely to be an XRN. We found several new X-ray sources in the data. Herein we focus on one bright new source in particular at R.A.= 00:42:56.038, Dec.=41:12:18.50, which we name CXOM31 J004256.0+421218, following the naming convention described in Kong et al. (2002). We also give the source a short name, r2-70, which is derived from the position using the description given in Williams et al. (2004), Table 1. The source is 2.1′ east and 3.8′ south of the nucleus.
We determined the position of r2-70, discovered in the data set from 27-Nov-2003 (ObsID 4679), by aligning the observation with the coordinate system of the Local Group Survey (LGS; Massey et al., 2001). The LGS images have an assigned J2000 (FK5) world coordinate system accurate to 0.25′′, and they provided the standard coordinate system to which we aligned all of our data for this project. We aligned the positions of 6 X-ray sources with known globular cluster counterparts to the positions of the centers of their host globular clusters in the images of the LGS using the IRAF444IRAF is distributed by the National Optical Astronomy Observatory, which is operated by the Association of Universities for Research in Astronomy, Inc., under cooperative agreement with the National Science Foundation. tasks imcentroid and ccmap.
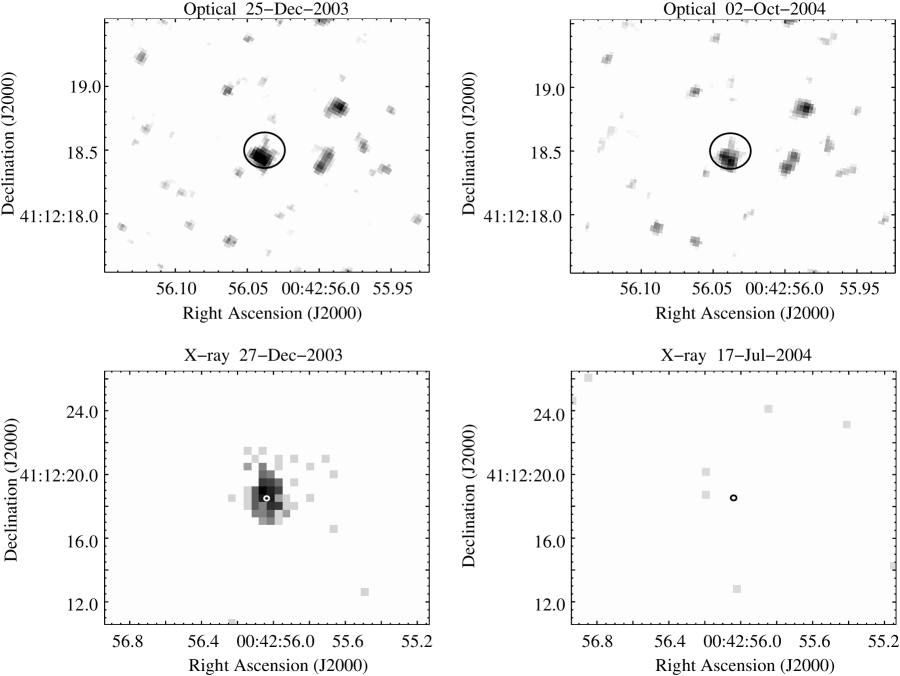
We repeated this alignment process for the second detection of the source on 27-Dec-2003 (ObsID 4680; see Figure 1) and for the third detection of the source on 31-Jan-2004 (ObsID 4681). Using the independent position measurements for these detections, which were the three detections with the highest number of counts, allowed checks for consistency as well as the ability to reduce the final errors in the position of the X-ray source. The alignment errors between the Chandra and LGS are shown for each observation in column in Table 2; random position errors for the source, as measured by wavdetect are given in column . Alignments allowed for adjustments in pixel scale as well as rotation and shifts in and .
We extracted the X-ray spectrum of r2-70 from all 4 detections using the CIAO task psextract555http://cxc.harvard.edu/ciao/ahelp/psextract.html. We then fit these spectra independently, binning so that each energy bin contained 10 counts. These binning factors allowed the use of standard statistics when fitting the spectra.
3 Optical Data
HST ACS data were obtained at UT 21:37 on 25-Dec-2003 and one at UT 04:19 on 02-Oct-2004. Each of these were pointed at R.A.=00:42:56.03, Dec.=41:12:19.0. The observations had orientations of 60.10 deg and 169.02 deg respectively. Both observations were taken using the standard ACS box 4-point dither pattern to allow the final data to be drizzled to recover the highest possible spatial resolution. All exposures were taken through the F435W filter. The total exposure times were 2200 seconds for each data set.
We aligned and drizzled each set of 4 images into high-resolution (0.025′′ pixel-1) images using the PyRAF666PyRAF is a product of the Space Telescope Science Institute, which is operated by AURA for NASA. task multidrizzle,777multidrizzle is a product of the Space Telescope Science Institute, which is operated by AURA for NASA. http://stsdas.stsci.edu/pydrizzle/multidrizzle which has been optimized to process ACS imaging data. The task removes the cosmic ray events and geometric distortions, and it drizzles the dithered frames together into one final photometric image. Sections of the images, centered on the position of the transient X-ray source, are shown in Figure 1.
The drizzled ACS images were aligned with the LGS coordinate system with ccmap using stars common to both images. The alignment errors were 0.04′′, indicating that the ACS images were accurately aligned to the LGS system. With the ACIS-I and ACS images aligned to the same coordinate system, we were able to compare the coordinates of the ACS and ACIS-I sources reliably. The X-ray position error ellipse for r2-70 is shown on the aligned images in Figure 1. The images reveal a fading optical source at the same position as the transient X-ray source, indicating that we detected the optical counterpart of the X-ray event. However, the counterpart has a bright neighbor which is apparent in the second image. This neighbor led to some complications in measuring the photometry of the counterpart.
We processed the relevant sections of the final images with DAOPHOT-II and ALLSTAR (Stetson et al., 1990) to find and measure the count rates of the optical counterpart. We converted the count rates measured on our images to VEGA magnitudes using the conversion techniques provided in the ACS Data Handbook888http://www.stsci.edu/hst/acs/documents/handbooks/DataHandbookv2/ACS_longdhbcover.html.
4 Results
4.1 X-ray
The brightest flux at which the source was observed was 1.410-4 photon cm-2 s-1. Since this source is in the region surveyed by Kong et al. (2002) to a detection limit of 810-7 photon cm-2 s-1, the source demonstrates changes in flux of more than a factor of 100, indicating that the source was an X-ray Nova.
The results of the spectral fits to the 4 detections of r2-70 are given in Tables 3 and 4. All of these fits agree that r2-70 had a soft spectrum; however, the measured absorption is much higher for the power-law fits. In fact, the best fits using the disk blackbody model have no absorption, which is not possible considering the known Galactic foreground absorption toward M31 (61020 cm-2). This result, along with the slightly lower quality of the disk blackbody fits, favors the power-law as the correct spectral model, and an absorption-corrected X-ray luminosity of 61037 erg s-1. As this luminosity is below the Eddington luminosity of a 1.4 M⊙ neutron star, the luminosity does not discriminate between an accreting neutron star and an accreting black hole.
Tanaka & Shibazaki (1996) discuss the differences between the X-ray spectra of accreting neutron stars and those of accreting black holes. Both types of accreting objects have two-component spectra. Neutron stars have a blackbody component consistent with the neutron star surface and a multi-temperature disk blackbody component. The disk component typically has a maximum temperature of kT1.5 keV at 1038 erg s-1 which decreases as the luminosity goes down. Black holes have a power-law component and a multi-temperature disk blackbody component with a peak temperature of kT1.2 keV. The key difference is the presence of a blackbody component consistent with a neutron star surface. If this component is not present, then the source is more likely a black hole. We fitted the X-ray spectrum with the most counts (ObsID 4681) with both of these two-component models and both had very good () fits. We therefore cannot rule out either possibility based on the coarse spectra from the discovery observations.
The X-ray flux and X-ray luminosity lightcurves are shown in Figure 2. The 3 upper-limit shown for the 17-Jul-2004 observation is representative of the Chandra observations through October of 2004; none of which detected r2-70. Because the X-ray flux began to decay sometime during the 4 months when we have no observations, we were unable to constrain the shape of the decay curve of the X-ray transient. It is clear from the many detections that this transient source was active for at least 6 months. The source also appears to have decayed rapidly once the decay started, fading from 10-4 photon cm-2 s-1 to a 3 upper limit of 7.510-6 photon cm-2 s-1 in 55 days. If an exponential decay is assumed, this decay by at least a factor of 13.3 indicates an -folding decay time of 21 days, typical for Galactic X-ray novae (Chen et al., 1997).
4.2 Optical
Inside of the 2 Chandra error ellipse on the first ACS image, DAOPHOT found 3 optical point sources. The brightest two of these are in the southern portion of the error ellipse. These sources are within 0.1′′ of each other. The significant fading of the northeastern source between observations, as seen in Figure 1, distinguished it as an optical counterpart candidate for the transient X-ray event. Another source lies to the 0.15′′ to the north of the blended sources. It had magnitudes of and in the first and second ACS images respectively. Since this source did not fade between observations, we did not consider it further as a counterpart candidate, leaving the northeastern member of the blended pair as our only counterpart candidate.
Distinguishing the photometry of the pair of bright optical sources, separated by only 0.10′′, was difficult in the 25-Dec-2003 data set because the brighter northeastern source overpowered the fainter southwestern source. However, in the 02-Oct-2004 data set, the northeastern source had faded sufficiently that ALLSTAR was able to cleanly measure the photometry for both sources individually, finding the northeastern source to be and the southwestern source to be . Therefore, assuming typical extinction to M31 (=0.4) and a distance modulus of 24.47 (Williams, 2003), the brightest stars consistent with the position of r2-70 have M, fainter than the O and B stars found in HMXBs. Since most Galactic SXTs in LMXBs contain black holes, the soft X-ray spectrum and lack of high-mass stars at the position of r2-70 suggest that it is a black hole binary.
We measured the total count rate of the blended sources in the first ACS image, using an aperture of radius 0.14′′ centered on the blend and subtracting the background level sampled in an annulus from 0.30′′ to 0.55′′. By subtracting the contribution of the light expected from the southwestern neighbor, we obtained the count rate of the northeastern source alone. This technique yielded for the northeastern source during the first observation. Assuming a distance modulus to M31 of 24.47 (Williams, 2003) and extinction consistent with , the absolute magnitude of the optical counterpart was MB=-1.30.5.
For consistency, we applied the same aperture photometry technique to the second observation of the pair of optical sources. The technique yielded for the northeastern source during the second observation. This measurement is equivalent at the 1 level with the ALLSTAR measurement of the northeastern source in the second image, suggesting that this technique was successful at separating the photometry of the blended sources.
The aperture photometry reveals an optical source inside of the X-ray position error ellipse that faded by 30% from the time the X-ray source was active to the time that the X-ray source was quiescent. This optical variability in concert with the X-ray source demonstrated by the brightest of the four optical sources detected in the error ellipse clearly indicates that this fading optical source was the counterpart to the transient X-ray event.
The bright optical luminosity (=25) apparent during X-ray quiescence may have several explanations. For example, r2-70 could be an intermediate mass X-ray binary, similar to V4641 Sgr, whose binary companion is a late B or early A star (Chaty et al., 2003) and whose period is 2.8 days (Orosz et al., 2001). In this case, the optical light from the binary companion will contaminate the optical light from the accretion disk even during the X-ray outburst, and the optical brightening during outburst is typically only 1-2 mag (see references in Orosz et al., 2001). Another example of a black hole binary that is optically bright during quiescence is 4U 1543-47. While this source has had peak X-ray luminosities of erg s-1 (Park et al., 2004) and quiescent X-ray luminosities of erg s-1 (Garcia et al., 2001), its optical brightness only changes by 1.8 mag (Orosz et al., 1998; van Paradijs & McClintock, 1995). This system also has an early A star secondary and a period of 1 day (27 hr; Orosz et al., 1998). With its long predicted period of 8 days (see §4.3), bright quiescent optical luminosity, and modest brightening during outburst, r2-70 bears a strong resemblance to these Galactic X-ray binaries.
On the other hand, it is also possible that both of the =25 stars visible during X-ray quiescence are chance superpositions. In this case, the optical counterpart of the LMXB was only seen during the outburst but was not resolved because of its proximity to this pair of stars. Either of these possibilities would cause the optical luminosity of the accretion disk during outburst to be somewhat overestimated.
4.3 Orbital Period Prediction
We applied the relation of van Paradijs & McClintock (1994) to predict the orbital period of the LMXB that produced the X-ray transient we have detected as r2-70. This empirical relation seen in Galactic LMXBs shows that the X-ray/Optical luminosity ratio of an LMXB is correlated with the orbital period of the system. The relation appears to hold even for more recently discovered systems (Williams et al., 2005). With our optical and X-ray data of r2-70, we are able to measure the X-ray and optical luminosities. Assuming that r2-70 is an LMXB, as is suggested by its location in the M31 bulge, which contains very few, if any, young, high-mass stars (e.g. Stephens et al., 2003), and assuming that LMXBs in M31 follow the same relation between their photometric properties and their orbital periods as those in the Galaxy, our luminosity measurements for r2-70 put a constraint on the orbital period of the system.
To determine the -band luminosity of r2-70 during the outburst, we first took our apparent magnitude of for r2-70 during the first ACS observation. We then determined the extinction toward r2-70 using the fits to the X-ray spectra. Taking the weighted mean of the 4 independent measurements of the column density given in Table 3, we obtained cm-2. Using the relation of Predehl & Schmitt (1995) and the standard interstellar extinction law, this absorption translates to . Applying an intrinsic color of determined from the Galactic LMXB catalog of Liu et al. (2001), and a distance of 780 kpc, our measurement of M.
The X-ray luminosity was determined using the power-law spectral fits to the ACIS data (see Table 3). The absorption-corrected 0.3-7 keV X-ray luminosity of r2-70 on 27-Dec-2003, as measured from the Chandra data, was of erg s-1. Assuming this was the X-ray luminosity during the 25-Dec-2003 observation, this X-ray luminosity and the optical luminosity of M, measured from the 25-Dec-2003 data, can be applied to the relation of van Paradijs & McClintock (1994). This calculation yields a predicted orbital period of 8 days for this system.
We note that if the lower extinction (2.5 cm-2) and X-ray luminosity ((2.51.3) erg s-1) from the disk blackbody spectral fits are applied, MV = 0.00.2 on 25-Dec-2003 and the orbital period prediction changes to 3 days. We also note that if the optical luminosity of the accretion disk was actually lower than the measured value because the counterpart is an A star or because the counterpart was poorly resolved from its neighbors, the range of the predicted orbital period would decrease.
Comparisons with the other two optical detections of X-ray transients in M31 show that the properties of the optical counterpart for r2-70 were between those of the other transient counterparts. The counterpart for r2-70 was fainter than that seen for the X-ray transient r2-67 (MV=-2.40.8; Williams et al., 2004) and brighter than that seen for the counterpart candidate for the X-ray transient s1-86 (MV=-0.250.27; (Williams et al., 2005)). The predicted orbital period also falls between the values calculated for r2-67 (23 days; Williams et al., 2004) and s1-86 (1.0 days; Williams et al., 2005).
5 Conclusions
We have discovered a new transient X-ray source in the M31 bulge that appeared in November of 2003, which we have named r2-70. This source attained an X-ray flux more than a factor of 100 greater than the upper-limits of previous surveys in which it did not appear. The transient event kept a high X-ray flux through the first half of 2004. When the source decayed, it did so with an -folding decay time of 1 month. The event had a soft spectrum best fit by a power-law with index 3, and it had an absorption-corrected 0.3-7 keV luminosity 61037 erg s-1.
Follow-up /ACS F435W (-band equivalent) imaging revealed a fading optical source within the tightly constrained error ellipse of the location of the transient X-ray event, showing that this optical source is the optical counterpart of the X-ray transient. The source decayed from to between epochs. Assuming that the transient event occurred in an LMXB, we can apply our X-ray and optical luminosity measurements to the empirical relation of van Paradijs & McClintock (1994) to predict that the system has an orbital period of 8 days.
Finally, the lack of high-mass stars at the position of r2-70 suggests that it is an LMXB. Although the X-ray luminosity and spectrum do not exclude either an accreting neutron star or black hole, many Galactic LMXBs that exhibit such transient events and have such soft X-ray spectra contain stellar mass black holes, making r2-70 a good black hole candidate in M31.
Support for this work was provided by NASA through grant number GO-9087 from the Space Telescope Science Institute and through grant number GO-3103X from the Chandra X-Ray Center. MRG acknowledges support from NASA LTSA grant NAG5-10889.
References
- Bevington & Robinson (2003) Bevington, P. R., & Robinson, D. K. 2003, Data reduction and error analysis for the physical sciences (Boston, MA: McGraw-Hill)
- Charles (1998) Charles, P. 1998, in Theory of Black Hole Accretion Disks, 1
- Chaty et al. (2003) Chaty, S., Charles, P. A., Martí, J., Mirabel, I. F., Rodríguez, L. F., & Shahbaz, T. 2003, MNRAS, 343, 169
- Chen et al. (1997) Chen, W., Shrader, C. R., & Livio, M. 1997, ApJ, 491, 312
- Di Stefano et al. (2004) Di Stefano, R., et al. 2004, ApJ, 610, 247
- Freeman et al. (2001) Freeman, P., Doe, S., & Siemiginowska, A. 2001, in Proc. SPIE Vol. 4477, p. 76-87, Astronomical Data Analysis, Jean-Luc Starck; Fionn D. Murtagh; Eds., 76
- Garcia et al. (2001) Garcia, M. R., McClintock, J. E., Narayan, R., Callanan, P., Barret, D., & Murray, S. S. 2001, ApJ, 553, L47
- Kong et al. (2002) Kong, A. K. H., Garcia, M. R., Primini, F. A., Murray, S. S., Di Stefano, R., & McClintock, J. E. 2002, ApJ, 577, 738
- Liu et al. (2001) Liu, Q. Z., van Paradijs, J., & van den Heuvel, E. P. J. 2001, A&A, 368, 1021
- Massey et al. (2001) Massey, P., Hodge, P. W., Holmes, S., Jacoby, G., King, N. L., Olsen, K., Saha, A., & Smith, C. 2001, in American Astronomical Society Meeting, Vol. 199, 13005
- McClintock & Remillard (2004) McClintock, J. E., & Remillard, R. A. 2004, in Compact Stellar X-ray Sources (astro-ph/0306213)
- Orosz et al. (1998) Orosz, J. A., Jain, R. K., Bailyn, C. D., McClintock, J. E., & Remillard, R. A. 1998, ApJ, 499, 375
- Orosz et al. (2001) Orosz, J. A., et al. 2001, ApJ, 555, 489
- Park et al. (2004) Park, S. Q., et al. 2004, ApJ, 610, 378
- Predehl & Schmitt (1995) Predehl, P., & Schmitt, J. H. M. M. 1995, A&A, 293, 889
- Stephens et al. (2003) Stephens, A. W., et al. 2003, AJ, 125, 2473
- Stetson et al. (1990) Stetson, P. B., Davis, L. E., & Crabtree, D. R. 1990, in ASP Conf. Ser. 8: CCDs in astronomy, 289
- Tanaka & Shibazaki (1996) Tanaka, Y., & Shibazaki, N. 1996, ARA&A, 34, 607
- Trudolyubov et al. (2001) Trudolyubov, S. P., Borozdin, K. N., & Priedhorsky, W. C. 2001, ApJ, 563, L119
- van Paradijs & McClintock (1994) van Paradijs, J., & McClintock, J. E. 1994, A&A, 290, 133
- van Paradijs & McClintock (1995) van Paradijs, J., & McClintock, J. E. 1995, Optical and Ultraviolet Observations of X-ray Binaries (X-ray Binaries, eds. W.H.G. Lewin, J. van Paradijs, and E.P.J. van den Heuvel (Cambridge: Cambridge Univ. Press), p. 58), 58
- Williams (2003) Williams, B. F. 2003, MNRAS, 340, 143
- Williams et al. (2004) Williams, B. F., Garcia, M. R., Kong, A. K. H., Primini, F. A., King, A. R., Di Stefano, R., & Murray, S. S. 2004, ApJ, 609, 735
- Williams et al. (2005) Williams, B. F., Garcia, M. R., Kong, A. K. H., Primini, F. A., & Murray, S. S. 2005, ApJ, 620, 723
| ObsID | Date | R.A. (J2000) | Dec. (J2000) | Roll (deg.) | Exp. (ks) |
|---|---|---|---|---|---|
| 4678 | 09-Nov-2003 | 00 42 44.4 | 41 16 08.3 | 239.53 | 3.9 |
| 4679 | 26-Nov-2003 | 00 42 44.4 | 41 16 08.3 | 261.38 | 3.8 |
| 4680 | 27-Dec-2003 | 00 42 44.4 | 41 16 08.3 | 285.12 | 4.2 |
| 4681 | 31-Jan-2004 | 00 42 44.4 | 41 16 08.3 | 305.55 | 4.1 |
| 4682 | 23-May-2004 | 00 42 44.4 | 41 16 08.3 | 79.99 | 3.9 |
| 4719 | 17-Jul-2004 | 00 42 44.3 | 41 16 08.4 | 116.83 | 4.1 |
| ID | R.A. (J2000) | aaRandom position errors were measured using the CIAO task wavdetect. | bbErrors in the alignment between the X-ray image and the LGS coordinate system were measured using the IRAF task ccmap. | Dec. (J2000) | ||||
|---|---|---|---|---|---|---|---|---|
| 4679 | 00 42 56.025 | 0.09′′ | 0.08′′ | 0.12′′ | 41 12 18.74 | 0.08′′ | 0.11′′ | 0.14′′ |
| 4680 | 00 42 56.032 | 0.06′′ | 0.19′′ | 0.20′′ | 41 12 18.61 | 0.06′′ | 0.14′′ | 0.15′′ |
| 4681 | 00 42 56.056 | 0.06′′ | 0.12′′ | 0.13′′ | 41 12 18.30 | 0.06′′ | 0.09′′ | 0.11′′ |
| MeanddThe mean position and errors were calculated using standard statistics for combining multiple measurements (Bevington & Robinson, 2003). | 00 42 56.038 | 0.08′′ | 41 12 18.50 | 0.07′′ |
| Date | CtsaaThe background-subtracted number of counts in the detection. | FluxbbThe exposure corrected 0.3-10 keV flux in units of 10-4 photon cm-2 s-1. | SlopeccSlope of the best-fitting absorbed power law model. | QeeThe probability that this fit is representative of the true spectrum, determined from . | HR-1ffHardness ratio calculated by taking the ratio of M-S/M+S, where S is the number of counts from 0.3-1 keV and M is the number of counts from 1-2 keV. | HR-2ggHardness ratio calculated by taking the ratio of H-S/H+S, where S is the number of counts from 0.3-1 keV and H is the number of counts from 2-7 keV. | hhThe absorption-corrected luminosity of the source in units of 1036 (0.3-7 keV). | ||
|---|---|---|---|---|---|---|---|---|---|
| 26-Nov-2003 | 134 | 1.20.1 | 1.70.3 | 0.60.9 | 7.08/10 | 0.72 | 0.380.11 | 0.240.12 | 297 |
| 27-Dec-2003 | 145 | 1.30.1 | 3.10.5 | 2.61.2 | 17.84/11 | 0.09 | 0.330.09 | -0.190.12 | 6022 |
| 31-Jan-2004 | 161 | 1.40.1 | 3.10.3 | 2.10.9 | 10.46/12 | 0.58 | 0.240.08 | -0.470.13 | 6216 |
| 23-May-2004 | 109 | 1.00.1 | 3.30.6 | 2.61.4 | 7.93/7 | 0.34 | 0.310.11 | -0.420.16 | 5423 |
| Date | TinaaThe temperature of the inner disk in keV. | R bbThe radius of the inner disk in km, assuming the distance to M31 is 780 kpc and the inclination () of the binary is 0 degrees. | ccThe absorption column in units of 1021 cm-2. | QddThe probability that this fit is representative of the true spectrum, determined from . | eeThe absorption-corrected luminosity of the source in units of 1036 (0.3-7 keV). | |
|---|---|---|---|---|---|---|
| 26-Nov-2003 | 1.50.2 | 5 | 0.1 | 8.65/10 | 0.57 | 2513 |
| 27-Dec-2003 | 0.50.1 | 30 | 0.30.8 | 23.26/11 | 0.02 | 2020 |
| 31-Jan-2004 | 0.580.07 | 28 | 0.1 | 12.82/12 | 0.38 | 2010 |
| 23-May-2004 | 0.500.07 | 31 | 0.25ffThe absorption was fixed to fit the spectrum from 23-May-2004, as was unconstrained if left as a free parameter. | 10.30/8 | 0.24 | 149 |