IRAC Mid-Infrared Imaging of the Hubble Deep Field South: Star Formation Histories and Stellar Masses of Red Galaxies at 11affiliation: Based on observations with the Spitzer Space Telescope, which is operated by the Jet Propulsion Laboratory, California Institute of Technology under NASA contract 1407. Support for this work was provided by NASA through contract 125790 issued by JPL/Caltech. Based on service mode observations collected at the European Southern Observatory, Paranal, Chile (LP Program 164.O-0612). Based on observations with the NASA/ESA Hubble Space Telescope, obtained at the Space Telescope Science Institute which is operated by AURA, Inc., under NASA contract NAS5-26555
Abstract
We present deep m imaging of the Hubble Deep Field South with IRAC on the Spitzer Space Telescope. We study Distant Red Galaxies (DRGs) at selected by and compare them to a sample of Lyman Break Galaxies (LBGs) at . The observed UV-to-m spectral energy distributions are fit with stellar population models to constrain star formation histories and derive stellar masses. We find that 70% of the DRGs are best described by dust-reddened star forming models and 30% are very well fit with old and “dead” models. Using only the and m colors we can effectively separate the two groups. The dead systems are among the most massive at (mean stellar mass ) and likely formed most of their stellar mass at . To a limit of their number density is lower than that of local early-type galaxies. Furthermore, we use the IRAC photometry to derive rest-frame near-infrared and fluxes. The DRGs and LBGs together show a large variation (a factor of 6) in the rest-frame band mass-to-light ratios (), implying that even a Spitzer mselected sample would be very different from a mass-selected sample. The average of the DRGs is about three times higher than that of the LBGs, and DRGs dominate the high-mass end. The ratios and ages of the two samples appear to correlate with derived stellar mass, with the most massive galaxies being the oldest and having the highest mass-to-light ratios, similar as found in the low-redshift universe.
Subject headings:
galaxies: evolution — galaxies: high redshift — infrared: galaxies1. Introduction
Galaxies at exhibit very diverse properties: they range from the blue Lyman Break Galaxies (LBGs) which are bright in the rest-frame ultraviolet (Steidel et al 1996a,b) to the Distant Red Galaxies (DRGs) which are generally faint in the rest-frame UV and have fairly red rest-frame optical colors. The DRGs are selected in the observers’ near-infrared (NIR) by the simple criterion (Franx et al. 2003, van Dokkum et al. 2003). The variety in the galaxy population at is comparable to that seen in the local universe, where colors range from very blue for young starbursting galaxies to very red for old elliptical galaxies. An urgent question is what causes the red colors of DRGs at . Are they “old and dead”, or are they actively star forming and more dusty than U-dropout galaxies?
First analyses of the optical-to-NIR Spectral Energy Distributions (SEDs) and spectra have suggested that both effects play a role: they have higher ages, contain more dust, and have higher mass-to-light () ratios in the rest-frame optical than LBGs (Franx et al. 2003, van Dokkum et al. 2004, Forster Schreiber et al. 2004; F04). Furthermore, many have high star formation rates yr-1 (van Dokkum et al. 2004, F04). Unfortunately, the number of DRGs with rest-frame optical spectroscopy is very small. Inferences inevitably depend on SED fitting, which has large uncertainties (see e.g., Papovich, Dickinson, & Ferguson, 2001). The SED constraints on the stellar and dust content are expected to improve significantly by extending the photometry to the rest-frame near-infrared.
Here we present the first results on rest-frame NIR photometry of DRGs and LBGs in the Hubble Deep Field South (HDFS) as observed with the Infrared Array Camera (IRAC; Fazio et al. 2004) on the Spitzer Space Telescope. Where necessary, we assume an cosmology with km s-1Mpc-1, and a Salpeter Initial Mass Function (IMF) between 0.1 and . Magnitudes are expressed in the AB photometric system unless explicitly stated otherwise.
2. The Observations, Photometry, and Sample Selection
We have observed the 5 arcmin2 HDFS/WFPC2 field with the IRAC camera integrating 1 hour each in the mid-infrared (MIR) 3.6, 4.5, 5.8, and 8mbands. The observations, data reduction, and photometry will be described by Labbé et al. (in preparation). Briefly, we reduced and calibrated the data using standard procedures (e.g., Barmby et al., 2004). The limiting depths at 3.6, 4.5, 5.8, and 8m are 25.0, 24.6, 22.6, and 22.5 mag, respectively (5, 3 diameter aperture). We PSF-matched the IRAC images and a very deep image (Labbé et al. 2003) to the mband. Nearby sources were fitted and subtracted to avoid confusion (see Labbé et al. 2004). We measured fluxes in diameter apertures. The colors were then combined with the HDFS-catalog of Labbé et al. (2003) resulting in 11-band photometry from 0.3 to 8m. In addition to the photometric errors, we add in quadrature an error of 10% to reflect absolute calibration uncertainties of IRAC.
We selected DRGs in the field of the HDFS using the criteria of Franx et al. (2003) yielding 14 galaxies with photometric redshifts (Rudnick et al. 2003) in the range . One blended source was excluded. In addition, we selected isolated LBGs in the same field to the same -band limit and in the same redshift range, using the U-dropout criteria of Madau et al. (1996) on the WFPC2 imaging (Casertano et al., 2000). The two samples are complementary, with only 1 source in common. For both samples, the mean redshift is with a standard deviation of 0.5111 The photometric redshift accuracy of DRGs from other studies is (F04, Wuyts et al. in preparation). The estimate is based on direct comparison of 16 galaxies with both photometric and spectroscopic redshifts. Uncertainties in rest-frame magnitudes and model parameters are based on Monte Carlo simulations that take into account uncertainties in the observed fluxes and redshift estimates..
![[Uncaptioned image]](/html/astro-ph/0504219/assets/x1.png)
Observed versus m color-color diagram of two samples of galaxies. Distant Red Galaxies (DRGs; filled circles and stars), occupy a different color region than Lyman Break Galaxies (LBGs; diamonds). DRGs that are best described by an old single-age burst model (SSP; stars) have colors distinct from those better described by constant star-forming models (CSF) and dust, indicating that IRAC fluxes may help in separating these populations. The curves show the color-evolution tracks of Bruzual & Charlot (2003) models at a fixed : an SSP model with ages ranging from 0.3 to 3 Gyr (dashed line) and two CSF models with ages ranging from 0.1 to 3 Gyr, and reddenings of and respectively (solid lines). The vector indicates a reddening of mag for a Calzetti et al. (2000) law.
3. Red Galaxies at : old or dusty or both?
In Fig. 2 we analyze the versus the m colors. The m color has a sufficiently large baseline and much higher signal-to-noise ratio than the m or m colors. The DRGs and LBGs lie in very different regions, with little overlap. The mean m color of the DRGs is significantly redder than that of LBGs, confirming that DRGs have higher ratios in the rest-frame optical. The red and m colors of the DRGs imply that they must be prominent in IRAC selected samples. Indeed, the majority of red m sources selected by Yan et al. (2004) in the GOODS survey satisfy the DRG selection criteria. We show color tracks for stellar population models (Bruzual & Charlot 2003; BC03), redshifted to a fixed : a single-age burst model (SSP) and two models with constant star formation (CSF), and reddenings typical for LBGs (, Shapley et al 2001), and typical for DRGs (, F04). The m colors of LBGs are consistent with low reddening models, whereas most of the DRGs lie in the area of models with substantial extinction.
3.1. Dead galaxies at
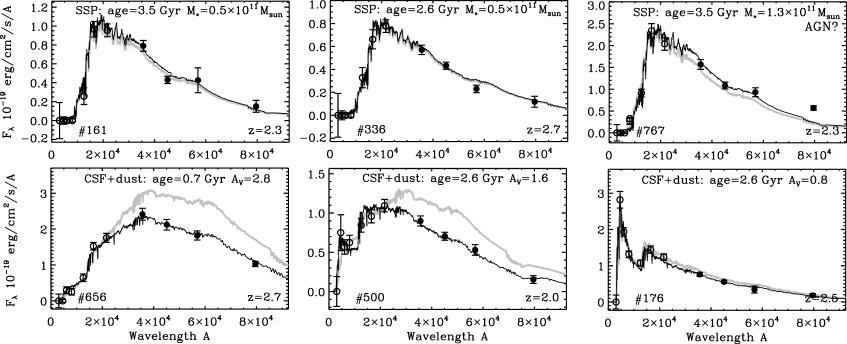
Three of 13 DRGs (indicated by star symbols in Fig. 1) lie well outside the area of constant star-forming models. Their colors are too red for their m color and they lie close to the line of an old single-age burst model with ages of Gyr. The candidate old, passive galaxies are shown in Fig. 1. Their SEDs are very well fit by an old single burst population. The gray model curves are predictions based on fits to the exceptionally deep optical/NIR data only, demonstrating that the Spitzer fluxes lie very close to the expected values. Dead galaxies have blue m colors and with Spitzer we can now effectively separate them from dusty star-forming DRGs, which are red in m.
Models with ongoing star-formation and dust-reddening fit the SEDs badly. Star-formation histories (SFHs) with exponentially declining star-formation rates (SFRs) and timescales Myr can be ruled out at the 99.9% confidence level. For the marginally acceptable models, the ratio of on-going to past-average SFR is indicating that these 3 galaxies are truly “red and dead”. The best-fit ages and implied formation redshifts depend on the assumed metallicity , as expected. Super-solar models give a mean age of Gyr and mean formation redshift , solar models yield Gyr and , while sub-solar metallicity models fail to provide good fits to the IRAC fluxes as they are too blue. Hence we infer from the models that the “dead” galaxies had formed most of their stellar mass by () or much earlier ().
The number density of “dead” galaxies is 1.9 Mpc-3, assuming a top hat redshift distribution between and 3. For stellar masses and the same IMF, that number density is lower than that of early-type galaxies in the nearby universe (Bell et al. 2003). Obviously, the sampled volume is too small to allow firm conclusions, but the result is indicative of strong evolution of passive galaxies from to .
3.2. Dusty star forming galaxies
In Fig. 1 we show the SEDs for 3 of the 8 DRGs whose optical/NIR fluxes were better fit with CSF models and reddening by a Calzetti et al. (2000) dust law. The observed MIR flux points are often different from predictions based on shorter wavelengths, especially where the flux density was still rising at the observed band. Hence, for the very dusty DRGs () the MIR fluxes help to better constrain the age and dust in the models. The average ages and extinction of the fits changed mildly after inclusion of the IRAC data: from 1.1 to 1.3 Gyr, and 1.9 to 1.5 mag, respectively.
Finally, two remaining galaxies could not be fit well by any model, most likely due to emission line contamination. One of them is spectroscopically confirmed as a very strong Lyman- emitter (Wuyts et al. in preparation). However, the generally good fits to the UV-to-8m SEDs of the DRGs indicate that the red colors were caused by old age and dust-reddened star light, and not other anomalies. We note that one of the dead galaxies (see Fig. 1) has an apparent flux excess at m, suggesting the presence of an obscured AGN which starts to dominate the flux in the rest-frame band (see e.g., Stern et al. 2005).
4. Mass-to-light ratio variations at
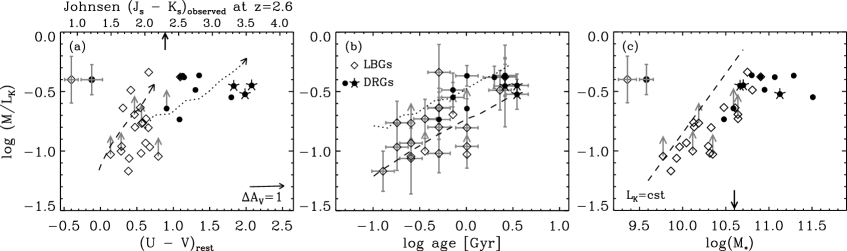
We next study the ratios inferred from the SED fits described above, adopting the best fitting SFH (SSP or CSF). Figure 3a shows the modeled (rest-frame ) versus rest-frame . The curves show the dust-free BC03 model ratios. Galaxies generally lie to the red of the model curves as a result of dust attenuation. The fits imply a large range in for DRGs and LBGs together (a factor of 6). Furthermore, the ratio correlates with rest-frame color, where galaxies red in the rest-frame optical have higher ratios than blue galaxies. The average of the DRGs is , about three times higher than that of the LBGs. Figure 3b shows the derived against the derived age. The correlates well with the age, as expected from the models. The role of extinction is greatly reduced in the rest-frame band, implying that the differences in the ratios for DRGs and LBGs are driven by age differences.
Figure 3c shows the ratio against stellar mass . DRGs dominate the high-mass end. The highest-mass galaxies () in this sample all have high ratios, and here the ratio does not depend strongly on . At lower masses galaxies have much lower ratios. This may be a selection effect caused by our magnitude cut-off, as we would miss low-mass galaxies with high . However, high-mass galaxies with low would be detected if they existed, hence the lower envelope of the versus distribution is real. Two intriguing possibilities are that the mean decreases towards lower stellar mass, or that the intrinsic scatter in increases.
Our DRGs and LBGs were selected in the observed band (rest-frame band). We find a large variation in (a factor of 25), hence selection effects play a major role in NIR studies at high redshift. Selection using MIR observations with Spitzer would improve the situation, but the wide range in ratios and ages found here indicates that even a IRAC mselected sample would still be very different from a mass-selected sample.
5. Discussion and conclusions
We have presented rest-frame UV-to-NIR photometry of a sample of DRGs and LBGs at in the HDFS. These galaxies span a wide range in properties, similar to low-redshift galaxies. The rest-frame NIR photometry from IRAC helps significantly: first, by allowing us to separate “old and dead” from dusty star forming DRGs using only the observed , and m-band, and second, by improving model constraints on the heavily obscured DRGs.
The wide range in galaxy properties at raises several important issues. First, it demonstrates it is impossible to obtain mass-selected samples photometrically. Even in the rest-frame -band, the ratio varies by a factor of 6 for the DRGs and LBGs in the HDFS. Second, we need to understand what produces these variations. If a relation between total stellar mass and exists (see Fig. 3c) then stellar mass might be driving the variations. Deeper IRAC data is needed to establish this well, as incompleteness effects may play a role. It is tantalizing that Kauffmann et al. (2003) find a similar correlation at , with the most massive galaxies being the oldest and having the highest ratios. The authors also found that above a stellar mass galaxy properties correlate only weakly with , similar to what we find at . The simplest explanation is that we observe the same galaxies at and , although we note that hierarchical formation scenarios predict significant merging for galaxies at . Alternatively, we observe merging processes occurring at a critical mass of about . A partial explanation may be a simple relation between mass and metallicity: higher mass galaxies might have higher metallicity, and thus be redder.
It is very noteworthy that there are “red and dead” galaxies at . Previous authors found such galaxies at (e.g., Cimatti et al., 2004; McCarthy et al., 2004). Whereas the number density of “dead” galaxies at is probably much lower than at , the mere existence of these systems at such high redshift raises the question what caused such a rapid and early decline in star formation. Our model fits imply that their star formation stopped by or higher, close to or during the epoch of reionization. Possibly a strong feedback mechanism caused this, such as an AGN or galactic-scale outflow. We note that these galaxies are among the most massive galaxies at , and hence were probably at the extreme tail of the mass function at .
Obviously, many questions remain unanswered by this study. Only a very small field has been studied, and similar studies on wider fields are necessary. Finally, the ratios derived here remain model dependent and vary with the assumed SFH, metallicity, and IMF (e.g., Bell et al. 2003). Direct mass determinations are presently very challenging, but are becoming more important to understand the galaxy population.
References
- Barmby et al. (2004) Barmby, P., et al. 2004, ApJS, 154, 97
- Bell et al. (2003) Bell, E. F., et al. 2003, ApJS, 149, 289
- Bruzual & Charlot (2003) Bruzual, G. & Charlot, S. 2003, MNRAS, 344, 1000 (BC03)
- Casertano et al. (2000) Casertano, S. et al. AJ, 120, pp. 2747–2824, 2000
- Calzetti et al. (2000) Calzetti, D., et al. 2000, ApJ, 533, 682
- Cimatti et al. (2004) Cimatti, A., et al. 2004, Nature, 430, 184
- Fazio et al. (2004) Fazio, G. G., et al. 2004, ApJS, 154, 10
- Franx et al. (2003) Franx, M. et al. 2003, ApJ, 587, L79
- Förster Schreiber et al. (2004) Förster Schreiber, N. M., et al. 2004, ApJ, 616, 40 (F04)
- Kauffmann et al. (2003) Kauffmann, G., et al. 2003, MNRAS, 341, 54
- Labbé et al. (2003) Labbé, I., et al. 2003, AJ, 125, 1107
- Labbé et al. (2004) Labbé, I., 2004, Doctoral Thesis, Leiden University
- Madau et al. (1996) Madau, P., et al. 1996, MNRAS, 283, 1388
- McCarthy et al. (2004) McCarthy, P. J., et al. 2004, ApJ, 614, L9
- Papovich, Dickinson, & Ferguson (2001) Papovich, C., Dickinson, M., & Ferguson, H. C. 2001, ApJ, 559, 620
- Rudnick et al. (2003) Rudnick, G., et al. 2003, ApJ, 599, 847
- Steidel et al. (1996a) Steidel, C. C., et al. 1996, AJ, 112, 352
- Steidel et al. (1996b) Steidel, C. C., et al. 1996b, ApJ, 462, L17
- Stern et al. (2005) Stern, D., et al. 2005, ApJ, submitted (astro-ph/0410523)
- van Dokkum et al. (2003) van Dokkum, P. G. et al. 2003, ApJ, 587, L83
- van Dokkum et al. (2004) van Dokkum, P. G., et al. 2004, ApJ, 611, 703
- Yan et al. (2004) Yan, H., et al. 2004, ApJ, 616, 63