Evidence for a long duration component in the prompt emission of short Gamma–Ray Bursts detected with BeppoSAX
Abstract
A statistical study on the light curves of all the short Gamma–Ray Bursts detected with the Gamma Ray Burst Monitor (GRBM) aboard BeppoSAX is reported. Evidence for a very weak and long duration component associated with these events in the two 1 s counters of the GRBM (40-700 keV and 100 keV) is found. It starts a few tens of seconds before the burst and continues for about 30 s after the burst. The overall hardness of this component is comparable with that of the event itself. The detection of a signal before the onset time and the similar hardness are consistent with an interpretation of the long duration component in terms of prompt emission associated with short GRBs.
1 Introduction
The duration distribution of Gamma Ray Bursts (GRBs), discovered by BATSE (Kouveliotou et al. 1993) and confirmed by BeppoSAX (Guidorzi 2002, Guidorzi et al. 2004), shows a bimodal pattern with two peaks. This distribution divides GRBs into long ( s) and short ( s) GRBs. A well established feature of short GRBs is their spectral hardness, which appears significantly higher than that of long GRBs (Kouveliotou et al. 1993, Belli 1995). A convincing physical interpretation for this bimodal distribution is still lacking. An hypothesis is that short GRBs could have origin from the merging of compact stars, while long GRBs from the collapse of massive stars (see, e.g., review by Zhang and Mészáros 2004). Some unified models that might account for the bimodal distribution have recently been proposed (e.g. Yamazaki et al. 2004, Toma et al. 2005). As it occurred in the case of long GRBs, the mystery of short GRBs could possibly be unveiled by the discovery of their counterparts at lower frequencies (X–ray, optical, radio). However, so far all these searches have been unsuccessful. In X-rays, no short GRB has been detected with the BeppoSAX Wide Field Cameras (Smith et al. 1999) and the 2 short GRBs detected with HETE-2 (GRB020113, Barraud et al. 2003; GRB020531, Ricker et al. 2002), have provided unsuccessful searches for optical afterglow, in particular for GRB020531, which was followed up from 90 min after the event (Boer et. al 2002) until 10 days later (for a review of the observations see Klotz et al. 2003). From these observations it appears that, if present, the afterglow from GRB020531 should be either much weaker than the weakest afterglow observed from the long GRBs, or it should be of very short duration or it would show a very fast fading. The search for afterglow emission from short GRBs is one of the hottest topics of the current astrophysical research, of key importance to establish the origin of these still mysterious events. From these considerations it is apparent that even a statistical study of this class of events aimed at possibly discovering the presence of a long duration component, which could be reminiscent of a hard X–/–ray afterglow, would be of great value. In fact Lazzati et al. (2001) and Connaughton (2002) were the first to perform such analysis using BATSE data. Connaughton (2002) added together 100 background-subtracted 20 keV light curves of short GRBs, aligning them at the peaks of the events, and finding a weak signal (3.5 significance) in the time interval from 20 to 40 s after the main event and a marginal signal later (until 300 s). Lazzati et al. (2001) for each of the 4 BATSE energy channels, added together the light curves of 76 short GRBs with high signal-to-noise ratio, and found evidence for a long duration signal (at significance) above the mean background level in the 25-120 keV energy band (sum of the channels 1 and 2). In both cases the signal starts soon after the bursts; in the case of Connaughton (2002) it seems to be fading, while in the case of Lazzati et al. (2001), it peaks about 30 s after the burst time and it is visible for about 100 s. Lazzati et al. (2001) did not find any signal above 120 keV. Lazzati et al. (2001) also found that the energy spectrum of the 25–120 keV excess appears to be softer than that of the short GRBs, and suggested that it could be due to afterglow emission from these events. Here we report on a statistical analysis similar to that performed by Lazzati et al. (2001), using the light curves of the short GRBs detected by the BeppoSAX Gamma Ray Burst Monitor (GRBM). All these bursts will appear in the GRBM catalogue of GRBs now in preparation, with preliminary information already reported (Guidorzi 2002, Guidorzi et al. 2004). Preliminary results of this analysis, obtained with a smaller number of events, have already been reported (Montanari et al. 2004).
2 Data analysis and results
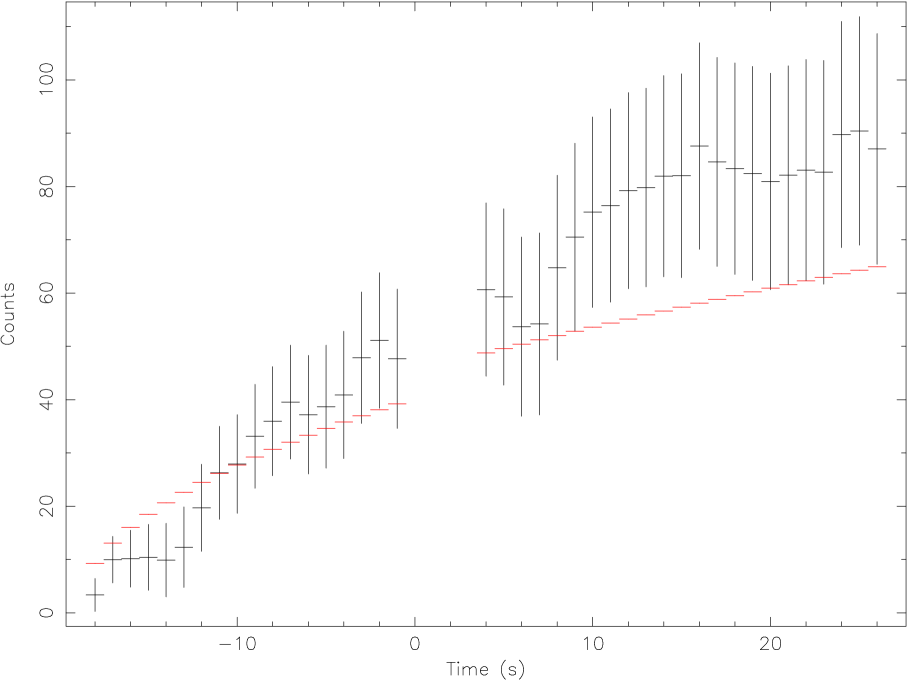
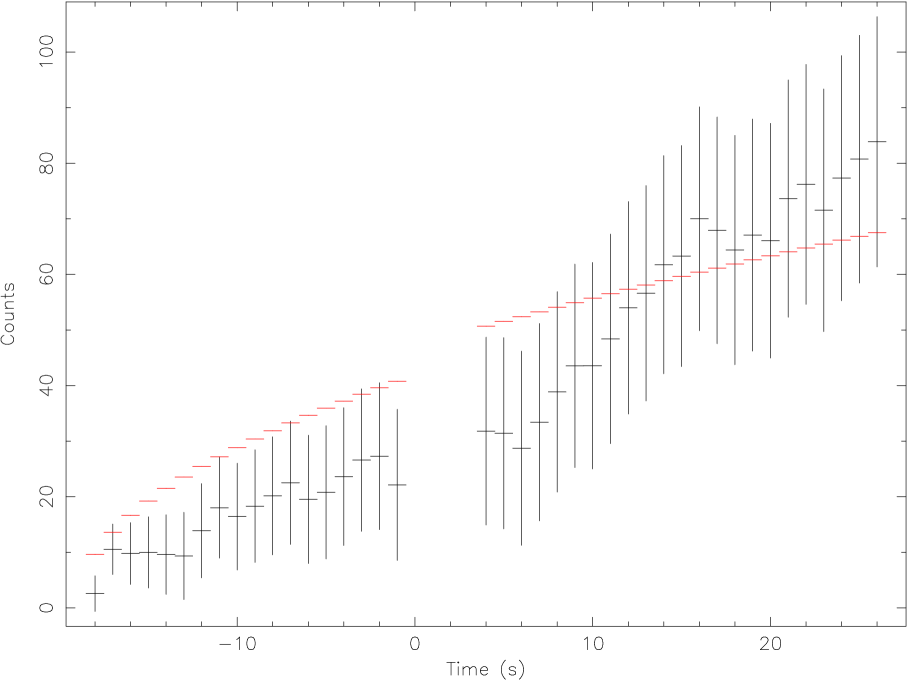
The main features of the BeppoSAX GRBM have been given in many papers (Frontera et al. 1997, Feroci et al. 1997, Costa et al. 1998). The instrument is made of four CsI(Na) scintillator detection units with an energy passband from 40 to 700 keV for each unit. Data continuously available from each of the 4 GRBM units include two 1 s ratemeters in two energy channels (40–700 keV and 100 keV), and 128 s count spectra (40–700 keV, 225 channels). The number of short GRBs detected by the BeppoSAX GRBM is 168. For each of them we have used the 1 s light curves obtained from the GRBM detection unit which showed the maximum count rate. Thanks to the almost equatorial BeppoSAX orbit, the GRBM background level is much more stable than that of BATSE, with a maximum orbital modulation of about 15%, and an average intensity level of about 800 counts/s. First of all we aligned the GRBs light curves with respect to the trigger time in such a way that the detectable prompt emission for each GRB was located in the interval from s to s. After that we selected those events for which no interruption in the data transmission was present in either energy channel (40–700 keV and 100 keV) from s to s (roughly the same time interval chosen by Lazzati et al. 2001) with respect to the GRB trigger time. We rebinned these data in 21 time bins of 16 s duration: 7 bins from s to s and 14 from s to s. We fit each of the resulting light curves with a degree polynomial and rejected those GRBs for which the corresponding light curve was not fit by the above function at a significance level less than 0.01 in at least one of the two energy channels. With this procedure, the GRB sample was reduced to 117 events. In order to exclude variability at the timescale that can be possibly smoothed away at the timescale, we took the previously selected events and fit each of the original light curves in the interval with a degree polynomial, rejecting those GRBs for which the corresponding light curve was not fit by the above function at a significance level less than 0.01 in at least one of the two energy channels. With this procedure, the GRB sample was reduced to 93 events. The resulting average light curves in the two energy bands show a significant excess lasting some tens of seconds around the trigger time. For the 40–700 keV band, a maximum excess is found in the interval , while for the 100 keV band a significant excess in the interval is detected. Most importantly, in the 40–700 keV energy band, an almost significant excess is found before the onset of the main short GRB emission in the interval . In the 100 keV energy band, an excess of significance level is found only after the main short GRB emission (). Summarizing, a signal is found both before and after the short GRB emission, with evidence of a spectral evolution from soft to hard. The resulting time behaviour of the average light curves rebinned at is shown in Fig. 1, along with the fit with a degree polynomial and the distribution of the residuals from the best fit function. As can be seen, the mean background level is well described by this function apart from the excess in the time intervals contiguous to that of the short GRB emission. Excluding the interval s from the fit, the excess becomes even more robust, as can also be seen in Fig. 2. It is found that the interval for which the maximum Signal to Noise Ratio (SNR) is reached in both energy bands is s ( and for the 40–700 keV and 100 keV band, respectively). The maximum SNR before the onset of the prompt emission () is detected in the interval s for photons in the 40–700 keV band. After the prompt emission, the time interval with the highest SNR in both energy bands is s with in the 40–700 keV band and and for photon energies 100 keV. For a summary of the results see Table 1. Overall, the excess has the appearance of an almost symmetrical bump (see Fig. 2), and can be described by a Gaussian function centred at the time origin, with a F–test significance of for the 40-700 keV energy band and for the higher passband. This result was obtained by fitting the average light curves rebinned at s with a Gaussian centered at the origin plus a degree polynomial. The shape and significance of the excess is better shown in Fig. 3, in which we plot the cumulative counts of the background subtracted 40–700 and light curves versus time, starting from assumed as origin. As can be seen, in the 40–700 keV band the cumulative counts steadily and significantly increase with time, while at energies 100 keV, the increase starts to be significant only after the short GRB.
3 An additional reliability test of the found excess
The reliability of the obtained results was also tested by repeating the above analysis with light curves which did not include short GRBs (we termed them “background light curves”). We obtained from the GRBM data archive a set of 1409 pairs (one for each energy channel) of background light curves spanning a time interval from s to s and from s to s with respect to a randomly chosen time origin. From these light curves, we randomly sorted 10 sets of 93 pairs of light curves, each set being statistically equivalent to that of the light curves derived for the final GRB sample discussed above. Also in this case we have obtained for every set two average light curves (one for each energy band). All average background light curves are well fit by a degree polynomial. Besides, the fluctuations of the curves with respect to the fit (given in standard deviation units) are all consistent with a Gaussian, with zero mean and unit standard deviation. On timescales of few tens of seconds, no significant excess is found in any part of the light curves. For a s binning time, the maximum excess found is at a level and not simulataneously in both energy channels.
4 Spectral analysis
In order to understand the nature of the found excess, we compared its spectral properties with the mean properties of the 93 short GRBs in our final sample. We investigated spectral hardness, energy flux and fluence of both the long duration component and main event. To this aim we used the response functions of the four GRBM units, which were derived with Monte Carlo techniques and were tested up to 1 MeV (e.g., Calura et al. 2000). The mean response function was obtained weighting that of each GRBM unit by the fraction of the GRB events whose light curve was extracted from that unit. The mean count per event of the 93 short GRBs in our sample was evaluated in two ways, either averaging the background subtracted counts derived per each event, or using the average light curve of the 93 GRBs. In the first case we obtained counts/grb and counts/grb, for the 40–700 keV and the 100 keV energy interval, respectively, while, in the second case, counts/grb and counts/grb. We see that in the second case there is a slight trend to understimate the total counts, in particular in the low energy band. This causes a slight increase of the hardness ratio . However, since the excess around the trigger time can be only evaluated in the second way, for consistency reasons, we used the last method also for estimating the mean GRB total counts (see Table 1). The benefit is that, using the average light curve of the 93 GRBs, the excess is not overestimated and its hardness ratio is not underestimated. for both main event and long duration component is reported in Table 1. The mean count of the excess normalized to a single event in the two energy channels was evaluated using the best fit light curves shown in Fig. 2, and is reported in Table 1 for the time intervals , and . The first interval has a duration of before the GRB onset, the second a duration of after the GRB, while the duration of the last is 41 s. We fit the total counts of both short events and excess with a power–law model (). This is an approximate model also for short GRBs in the 40-700 keV band (e.g., Ghirlanda et al. 2004), even though in some cases (e.g., GRB020531, Lamb et al. 2004) this model suffices to give a good description. In our case, with two energy channels this is the best description of the spectrum we can do. However, the uncertainty in the mean response function derived, does not allow a better accuracy. The best fit value of for the average GRB emission is reported in Table 1, where we also report the hardness ratio, and mean flux and fluence per burst. As can be seen, the derived value of is consistent with that found in other short GRBs (see, e.g., Paciesas et al. 2001, Lamb et al. 2004). In the same Table 1 we also report the 40–700 keV fluence and the mean flux of the long duration excess found, normalized to a single GRB. As can be seen, within the uncertainties no significant change of the flux and fluence from the interval before the burst to that after the burst can be inferred. However, from the derived values of either the or the photon index , it appears that the excess before the burst is softer than that after the burst at a significance level of (). The best estimate of the parameters reported in Table 1 is obtained in the interval . In this interval, it appears that the mean photon index of the long duration component () results to be consistent with that of the main event () at a significance level (). In this time interval also the mean energy flux and fluence are well determined. The 40–700 keV energy flux of the long duration component is only of the GRB mean flux, while its fluence is almost comparable () to that of the main event.
5 Discussion
The BeppoSAX GRBM data in the 40–700 keV and 100 keV energy channels confirm the evidence, initially reported by Lazzati et al. (2001) (in the 25–110 keV band) and Connaughton (2002) (at energies keV) using the BATSE data, for a long duration component associated with short GRBs, starting soon after the short event. The 40–700 keV flux in our interval (after the short event) is in good agreement with that reported by Lazzati et al. (2001) and also the peak flux found by these authors at 50 keV ( erg cm-2 s-1 keV-1) is consistent with that derived from our spectral data. However our results differ from those obtained with the BATSE data. First, unlike Lazzati et al. (2001), we find a significant 40–700 keV count excess above the background level also before the trigger time (see Fig.2). As can be seen from the figure, the overall excess has the appearance of a symmetrical bump, well described by a Gaussian function centred at the time origin (see the end of Sec. 2). Second, after the short GRB we find a clear signal above 100 keV, which is not observed in the BATSE data analyzed by Lazzati et al. (2001). As a consequence of this high energy signal, we find that the mean spectral hardness of the excess (see Table 1) is consistent with that of the short events, unlike that reported by Lazzati et al. (2001) which is softer. These seemingly different results are likely due to the different sample of short GRBs analyzed, combined with the low signal to be detected which is at the limit of the sensitivity of either instruments. In fact the excess we find above 100 keV is a little bit higher than the upper limit given by Lazzati et al. (2001). Likely, due to its very low background level and its almost stable behaviour with time (maximum trend of in the time interval , considered), the BeppoSAX GRBM is more suitable to detect these long duration signals. The reliability of the long duration component found by us was also tested performing the same analysis on background light curves which did not include any short GRB. No excess was found in any of the sets of light curves, each statistically equivalent to the final sample of light curves which included short GRBs. If the excess before the trigger time is real, the interpretation of the excess light curve after the trigger time as only afterglow emission is questionable. A more likely interpretation could be that both the excesses before and after the short event are in fact prompt emission released during the“short” GRBs, which, for its low intensity level, is not singly detected. This does not exclude that an afterglow component could contribute to the weak emission we observe. If it was the case, this component would be very weak and, in any case, much lower than the gamma–ray emission tail observed by, e.g. Giblin et al. (1999), which was attributed to afterglow emission. Data show a spectral evolution of the long component from soft, before the GRB, to hard after it. The significance level of this hardening is (). As a conclusion, short GRBs could be a special class of long GRBs with a strong flash preceded and followed by a very weak emission. This makes the short GRBs more intriguing and more fascinating. The Swift mission is expected to provide a robust test of the results presented in this paper.
References
- Barraud et al. (2003) Barraud, C., et al. 2003, A&A, 400, 1021
- Belli (1995) Belli, B.M. 1995, Ap&SS, 231, 43
- Boer et al. (2002) Boer, M., Klotz, A., Atteia, J. L., Pollas, C., and Pinna, H. 2002, GCN 1408
- Calura et al. (2000) Calura, F., et al. 2000, AIP Conf. Series, 526, 721
- Connaughton (2002) Connaughton, V. 2002, ApJ567, 1028
- Costa et al. (1997) Costa, E., Frontera, F., Heise, J., et al. 1997, Nature, 387, 783
- Costa et al. (1998) Costa, E., et al 1998, Adv. Sp. Res., 22, 1129
- Feroci et al. (1997) Feroci, M., et al. 1997 in SPIE Conf. on EUV, X-Ray, and Gamma-Ray Instrumentation for Astronomy VIII, eds. O. H. Siegmund & M. A. Gummin (San Diego: SPIE), Vol. 3114, 186
- Frontera et al. (1997) Frontera, F., et al. 1997, A&AS, 122, 357
- Ghirlanda et al. (2004) Ghirlanda, G., Ghisellini, G. & Celotti, A. 2004, A&A, 422, 2004
- Giblin et al. (1999) Giblin, T. W., et al. 1999, ApJ, 524, L47
- Guidorzi (2002) Guidorzi , C., Ph. D. Thesis, 2002, http://www.fe.infn.it/guidorzi/
- Guidorzi et al. (2004) Guidorzi, C., Montanari, E., Frontera, F., et al. 2004, in Proc. 3rd Rome Workshop on ”Gamma Ray Bursts in the Afterglow Era”, ed.s M. Feroci, F. Frontera, N. Masetti, and L. Piro, ASP Conf. Series, vol. 312, p. 39
- Klotz et al. (2003) Klotz, A., Boer, M., Atteia, J. L. 2003 A&A, 404, 815
- Kouveliotou et al. (1993) Kouveliotou, C., Meegan, C. A., Fishman, G. J., et al. 1993, ApJ, 413, L101
- Lamb et al. (2004) Lamb, D.Q. et al. 2004, in Proc. 3rd Rome Workshop on ”Gamma Ray Bursts in the Afterglow Era”, ed.s M. Feroci, F. Frontera, N. Masetti, and L. Piro, ASP Conf. Series vol.312, p. 94
- Lazzati et al. (2001) Lazzati, D., Ramirez-Ruiz, E., & Ghisellini, G. 2001, A&A, 379, L39
- Montanari et al. (2004) Montanari, E, Guidorzi, C., Frontera, F., et al. 2004, in Proc. 3rd Rome Workshop on ”Gamma Ray Bursts in the Afterglow Era”, ed.s M. Feroci, F. Frontera, N. Masetti, and L. Piro, ASP Conf. Series, vol. 312, p. 193
- Paciesas et al. (2001) Paciesas, W.S. et al. 2004, in in Proc. 2nd Rome Workshop on ”Gamma Ray Bursts in the Afterglow Era”, ed.s E. Costa, F. Frontera, and J. Hijorth (Springer, Berlin) p. 13
- Ricker et al. (2002) Ricker, G., et al. 2002, GCN 1399
- Smith et al. (1999) Smith, M.J.S., Gandolfi, G., Celidonio, G., et al. 1999, A&AS, 138, 561
- Toma et al. (2005) Toma, K., Yamazaki, R., and Nakamura, T. 2005, ApJ, 620, 835
- Yamazaki et al. (2004) Yamazaki, R., Kunihito, I., and Nakamura, T. 2004, ApJ, 607, L103
- Zhang & Mészáros (2004) Zhang, B. & Mészáros, P. 2004, Journ. Mod. Phys. A, in press (astro-ph/0311321)
| Parameter | GRBs | |||
|---|---|---|---|---|
| (a)(a)footnotemark: | ||||
| (a)(a)footnotemark: | ||||
| bbPhoton index of the power–law model assumed. | ||||
| ccMean fluence in units of erg/cm2/burst. | ||||
| ddMean flux in units of erg/cm2/s/burst. | eeAveraged on s integration time. |