Elemental Abundance Ratios in Stars of the Outer Galactic Disk. I. Open Clusters111This paper makes use of observations obtained at the National Optical Astronomy Observatory, which is operated by AURA, Inc., under contract from the National Science Foundation. We also employ data products from the Two Micron All Sky Survey, which is a joint project of the University of Massachusetts and the Infrared Processing and Analysis Center/California Institute of Technology, funded by the National Aeronautics and Space Administration and the National Science Foundation.
Abstract
We summarize radial velocity studies of selected stars in the old, distant clusters Berkeley 20, Berkeley 21, NGC 2141, Berkeley 29, and Berkeley 31. Cluster members are identified using optical and infrared color-magnitude diagrams as well as radial velocities derived from high-resolution echelle spectra. Three members of M67 were observed similarly, and those velocities compare extremely well with prior measures. Mean cluster radial velocities are determined. We also employ the highest quality spectra to analyze the chemical compositions of all six clusters for [Fe/H] as well as abundances of “” elements, iron-peak elements, and those synthesized in either the -process or the -process. In Be 21, our observed star is found to be rotating rapidly and overabundant in lithium, the second Li-rich star found in this sparse cluster.
We confirm the lack of correlation between abundance and age. For the outer disk, the abundance gradient for [Fe/H] deviates from the trend defined near the solar neighborhood. Rather than declining with increasing Galactocentric distance, [Fe/H] appears to reach a “basement” at [Fe/H]0.5 beyond 10 to 12kpc. Our radial abundance distribution for [Fe/H] is not inconsistent with the radial abundance discontinuity exhibited by Cepheids. We find enhanced [O/Fe], [/Fe], and [Eu/Fe] in the outer disk revealing a rapid star formation history. The outer disk also exhibits enhancements for -process elements. We compare the open cluster compositions with the thin disk, thick disk, halo, bulge, and dwarf spheroidals. None of these stellar populations perfectly matches the abundance ratios of the outer disk open clusters. Several key points arise from these comparisons. (1) [O/Fe] and [/Fe] resemble the thick disk. (2) [Na/Fe] and [Al/Fe] are enhanced relative to the thin disk. (3) [Ni/Fe] and [Mn/Fe] are in accord with the thin disk while [Co/Fe] may be slightly enhanced. (4) The neutron capture elements indicate different ratios of -process to -process material with no cluster showing a pure -process distribution. (5) An unusual pattern exists among the elements with [Mg+Ti/Fe] enhanced while [Si+Ca/Fe] is normal. Similar abundance ratios have been reported for Galactic bulge giants and indicate a common but not necessarily shared nucleosynthetic history between the bulge and the outer disk. Enhanced ratios of [Al/Fe] and [Co/Fe] offer another possible similarity between the bulge and the outer disk.
An intriguing, but tentative, conclusion is that the outer disk open cluster abundance ratios are consistent with the outer disk being formed via a merger event. The basement in [Fe/H] and enhanced [/Fe] suggest that the outer disk formed from a reservoir of gas with a star formation history distinct from the solar neighborhood. That the open clusters may be associated with an accreted dwarf galaxy is appealing since the clusters are young and have [/Fe] ratios indicating a rapid star formation history. However, the high [/Fe] ratios are unlike those seen in any current dwarf galaxies at the same [Fe/H]. Therefore, the open clusters may have formed as a result of star formation triggered by a merger event in the outer disk. The ages of the outer disk open clusters would then be a measure of when the merger occurred. However, Be 29 is a candidate merger member while Be 31 is not. One problem with the merger scenario is that open clusters with presumably very different origins have similar and unusual compositions.
1 INTRODUCTION
How do galactic disks arise and evolve? Disks are both common yet relatively easily destroyed in inter-galactic tidal encounters or mergers with comparable mass systems, so it would appear that most disks have undergone relatively undramatic evolution. Putting aside the origin of the angular momentum, which presumably arises from significant tidal encounters as galaxies were forming early in the Universe’s history, what are the major drivers of galactic chemical and dynamical evolution and what observational data do we need to test our ideas? Models of galactic evolution have identified a number of key processes, including the star formation rate, the initial mass function, infall of material, and the degree and extent of recycling of the products of stellar nucleosynthesis. In the solar neighborhood the data to test the models are extensive, including ages of clusters and some individual stars. One of the earlier puzzles, the lack of a relationship in the local thin disk population between age and mean metallicity (cf. Edvardsson et al. 1993; Nordström et al. 2004) may have been resolved (Reddy et al., 2003) once the thin disk and thick disk stars are considered separately. Nonetheless, other puzzles remain. For example, the remaining scatter in metallicity at a given age (or, conversely, the scatter in age at a fixed metallicity), is a major puzzle. It also appears that despite the existence of a relationship between age and metallicity, and the presence of a radial metallicity gradient in the disk, the detailed abundance patterns [X/Fe] at a given [Fe/H] are essentially identical for all thin disk stars (Reddy et al., 2003). Open clusters do not appear to display signs of an age-metallicity relation (Friel, 1995; Friel et al., 2002; Chen et al., 2003; Salaris et al., 2004), but it would be interesting to try to distinguish them in terms of thin disk and thick disk membership, and see if the solution of Reddy et al. to the age-metallicity relationship applies to the clusters.
Detailed chemical abundance patterns offer valuable additional clues in our stellar “excavations” and interpretation of our Galactic history. For example, when star formation begins in an ensemble of gas, it is enriched first in the products ejected by the evolution of the shortest-lived stars. Massive stars are thought to eject higher fractions of -process nucleosynthesis, as well as the “” elements (oxygen, magnesium, silicon, calcium, sulfur, and, perhaps, titanium). A little later ( years) the intermediate mass stars begin to contribute via ejecta from asymptotic giant branch stars, and the -process elements begin to appear in significant quantities. Only later ( years) do the iron peak elements arise in greater abundances as the Type Ia supernovae begin to enrich the interstellar medium. The mass function alters some of the relative ratios of the these various elements, and the star formation rate helps determine the timing of their appearance, and, hence, in a “closed box” model, the metallicity at which they are first seen. For example, at the lowest metallicities, when star formation has just begun, we expect to see high [/Fe] and [Eu/Fe] ratios (Eu being almost entirely produced by the -process). In systems in which the star formation is intense, and the metallicity rises rapidly, we would expect to see these high ratios continue up to high metallicities. A much slower star formation rate may result in contributions from Type Ia supernovae appearing at much lower metallicities. Infall and mixing both contaminate the interstellar medium abundance mixture, but [X/Fe] ratios, and the scatter in them at fixed [Fe/H] or age, can help to sort out all these effects.
While the chemical abundances data are extensive in the solar neighborhood, our knowledge of other parts of the Galactic disk is still relatively primitive. The study of the mean metallicity gradient, [Fe/H]/ (where is the distance from the Galactic center), provides some information, but its use is limited in disentangling all the contributing factors. (Recent work and references of prior work are summarized nicely by Friel et al. 2002; Andrievsky et al. 2002b; Chen et al. 2003.) Additional uncertainty arises because the samples of different classes of objects (H II regions, B stars, planetary nebulae, open clusters) are analyzed using very different methods, enabling subtle systematic effects to magnify or diminish the true metallicity gradients. Further, we would very much like to compare the results as a function of age, if at all possible, so that we can at least measure some sort of time derivative in the metallicity gradient and, preferably, in [X/Fe] ratios as well. The possibility of an on-going merger event in the outer disk (Ibata et al., 2003; Yanny et al., 2003; Frinchaboy et al., 2004; Martin et al., 2004) underscores the importance of pushing our spectroscopic studies of element-to-iron ratios for samples of stars with known ages out to large Galactocentric distances.
For these reasons we began a program in 1997 to identify stars with fairly large Galactocentric distances, and whose temperatures were similar enough so that we could analyze their spectra using identical tools. For young stars, we chose to study Galactic Cepheids, which are readily identifiable to large distances and, it appears, amenable to traditional spectroscopic analyses (Fry & Carney, 1997; Andrievsky et al., 2002a, b, c; Luck et al., 2003). For old stars, we must generally rely on open clusters and, due to extinction and distance, their brightest members, luminous K giants. We report our results for five such clusters in this paper. In a forthcoming paper, we will report results for three field K giants that appear to lie in the direction of the southern Galactic warp (Carney & Seitzer, 1993), and, in a third paper, on abundances for roughly two dozen distant Cepheids.
2 SELECTION OF CLUSTERS
Phelps, Janes, & Montgomery (1994) undertook a systematic search of open clusters, employing the morphology of available color-magnitude diagrams to identify the oldest clusters. They relied on the observed index, , defined to be the magnitude difference between two reference points in the color-magnitude diagram. The brighter point is the mean level of the red horizontal branch or the red clump so commonly seen in older and/or metal-rich clusters. The fainter point could have been the main sequence turn-off, but this is not always easy to estimate when clusters show a “blue hook” in that regime. The presence of binary stars may additionally complicate the measurement of the main sequence turn-off magnitude. Phelps et al. (1994) therefore chose to rely on the inflection point seen in the subgiant branch, lying between the region of the main sequence turn-off and the base of the red giant branch. Phelps et al. (1994) have provided an empirical, and necessarily approximate, relationship between and clusters’ ages, defining a “morphological age index” (MAI). We chose to study clusters with values of 1.6 or greater, which lead to MAI values (and approximate cluster ages) of 3 Gyr or greater. The ages we adopt are taken from a re-calibration of the MAI by Salaris et al. (2004), as were the initial estimates of the clusters’ metallicities, [Fe/H]222The adopted reddenings and [Fe/H] values agree generally with those from Friel et al. (2002), except for Be 21, where they found [Fe/H] = due to a difference in the adopted reddening to the cluster.. Table 8 summarizes the basic data for the clusters and the sources of the photometry. We note that improved abundance estimates and good color-magnitude diagrams (optical and infrared) should enable more accurate age determinations.
Since we wish to probe the outer disk, we also relied on the cluster positions and distance estimates from Phelps et al. (1994), so that our program clusters would have Galactocentric distances of 12 kpc or greater. Given practical limits of observing time, our final list includes five old open clusters, Be 20, Be 21, NGC 2141, Be 29, and Be 31.
We have also observed three bright stars in the local old open cluster M67. Since our goal was to determine cluster membership using radial velocities before we obtained longer exposure, higher signal-to-noise (S/N) spectroscopic observations, we decided to derive velocities for very well-studied stars in the cluster. Furthermore, high-S/N spectroscopy of M67 stars provides us with a direct comparison of the abundance pattern of an old open cluster with a Galactocentric distance comparable to the Sun (and comparable in age) with those of the outer disk clusters, using the same spectroscopic facilities, line lists, and analysis procedures.
We selected program stars within each cluster on the basis of available optical color-magnitude diagrams. Subsequent to the observing for this program, the all-sky release of the 2MASS survey became available, and since infrared photometry provides a useful check on optical photometry for clusters suffering relatively high extinction, we show in Figures 1-10 the available optical and infrared data. Our program stars are identified by the open squares that surround their plotted positions in the Figures. The available photometric data for our program stars are given in Table 2.
3 SPECTROSCOPIC OBSERVATIONS
We employed the echelle spectrographs and the 4-meter telescopes at the Kitt Peak National Observatory (KPNO) and the Cerro Tololo Inter-American Observatory (CTIO) during four different observing runs in December 1997, January 1998, and January 1999. In all cases we employed the long red cameras and the 31.6 lines mm-1 echelle gratings. GG495 filters were used to block second-order blue light. The wavelength coverage was different at CTIO (5200-7940 Å) than at KPNO (4825-8000 Å), due to the use of differing cross-dispersers, G181 at CTIO (316 lines mm-1) and G226 at KPNO (226 lines mm-1). The slit was opened to 150 microns, providing a width of 1.0″ on the sky, and yielding a spectral resolving power of 28,000 and a dispersion of 0.07 pixel at 5800Å, providing two pixels per resolution element.
The observing routine included 20 quartz lamp exposures to provide data for flat-fielding, and 15 zero-second exposures (to provide “bias” frames). Th-Ar hollow cathode lamp spectra were taken before and after each stellar exposure, and at least one radial velocity standard star was observed every night. Table 3 lists the four stars upon which we relied to provide radial velocity standards. All are K giants, similar at least approximately in temperature and gravity to our program stars. Details of the observations of the program stars is given in Table 4.
The initial observations of cluster members involved relatively short exposure times, not sufficient to undertake a comprehensive abundance analysis, but always sufficient to enable us to measure radial velocities with uncertainties likely to be slightly smaller than the anticipated cluster internal velocity dispersions. Following analyses of these observations, longer exposures were obtained for selected stars. The fainter stars, mag, had S/N levels of as low as 60 per pixel, or about 85 per resolution element at 7100 Å. But we generally were able to achieve S/N levels of about 100 per pixel for our program clusters’ abundance analysis targets, and 200 for the M67 stars.
The spectroscopic data were reduced using the IRAF333IRAF (Image Reduction and Analysis Facility) is distributed by the National Optical Astronomy Observatory, which is operated by the Association of Universities for Research in Astronomy, Inc., under contract with the National Science Foundation. packages IMRED, CCDRED, and ECHELLE to correct for the bias level, trim the overscan region, divide by the normalized flat field, remove scattered light, extract individual orders, fit the continuum, apply a wavelength solution using the Th-Ar spectra (and determine a systematic correction using the observed radial velocity standard).
4 RADIAL VELOCITIES AND CLUSTER MEMBERSHIP
4.1 Measurement of Radial Velocities
Radial velocities were measured with the task FXCOR in the IRAF package RV. FXCOR employs Fourier transform cross-correlations between one-dimensional spectra with wavelength solutions for a program star and a template, preferably one with high S/N and a similar spectrum as the program star. Our wavelength dispersions were rebinned to a common log-linear dispersion. We set the 200 pixels on the short and long wavelength edge of each order to zero intensity but the edges were apodized using a cosine bell curve. The influence of noise was suppressed using a ramp filter for the Fourier transforms. The cross-correlation process produces a series of peaks in the output power spectrum, and the dominant peak was chosen to be that relevant to the radial velocity shift. That peak was fit using a Gaussian function. We obtained velocities for many orders for each exposure, and these were averaged to produce our final results, which are given in Table 4.
4.2 Comparisons with Prior Results
We first compare our results to those obtained by other workers using high-resolution spectra, specifically for the clusters M67 and Be 21.
The stars we have studied in M67 are cluster members, by any criterion. They occupy plausible locations in both the optical and infrared color-magnitude diagrams (Figures 11 and 12). Stars 105, 108, and 141 (using the original Fagerholm 1906 nomenclature) are numbered 1016, 978, and 1010 by Sanders (1977). His study of proper motions of stars in the cluster assigned membership probabilities of 93%, 95%, and 96% for the three stars, respectively. The extensive study of radial velocities in the cluster by Mathieu et al. (1986) likewise confirms cluster membership for all three stars, and also shows no signs of binary companions. Their 33, 327, and 25 radial velocities of stars 105, 108, and 141 yield mean radial velocities of +34.3, +34.7, and +33.6 km s-1. Our single measures of the radial velocities are in excellent agreement, with a mean difference, in the sense of our results minus those of Mathieu et al. (1986), of only km s-1 ( km s-1). We conclude that our radial velocity measurement procedures are reliable.
Unfortunately, we do not obtain such good agreement for Be 21 when we compare our results with those of Hill & Pasquini (1999). They observed four stars, whose radial velocities were very consistent with each other, implying that all are members of the cluster. The positions of the stars in a color-magnitude are likewise consistent with membership. But the average velocity for the four stars is km s-1 ( km s-1). Our four stars likewise appear to be cluster members, based on the and color-magnitude diagrams, and a small scatter in the measured radial velocities. But our mean velocity is km s-1 ( km s-1). [Note: while the photometry cited in Table 1 of Hill & Pasquini (1999) is consistent with cluster membership, the actual identifications of the stars appear to be erroneous. The photometric values from Tosi et al. (1998) for the stars listed are not consistent with any of the values cited. Possibly a different set of identifications were used? The star Hill & Pasquini (1999) listed as T9, for example, is almost certainly T67.] The 11 km s-1 offset between the results of Hill & Pasquini (1999) and our results is disturbing, but, given our results for M67, we are confident of our results. Further, we believe the small scatter in the velocities of all the stars from both studies gives us some assurance that all four stars are cluster members.
We have two stars in common with the radial velocity study of Be 20 by Friel et al. (2002). They obtained = km s-1 for star 22 (compared to our km s-1), and km s-1 for star 28 (compared to our km s-1). The agreement is reasonable given the measurement uncertainties.
Minniti (1995) measured radial velocities for 15 stars in the field of NGC 2141, with typical measurement uncertainties of km s-1 for each star. We have three stars in common with his work, numbers 514, 1286, and 1821. The mean radial velocity for these three stars from Minniti (1995) is km s-1 ( km s-1), while the mean velocity from Table 4, excluding star 1997, is km s-1 ( km s-1). While our radial velocities were lower than those of Hill & Pasquini (1999), they are higher than those of Minniti (1995). Again, however, the differences are not large in the mean. Friel et al. (2002) also measured the radial velocity for star 1997 in NGC 2141, obtaining km s-1. Our value, km s-1, differs very significantly from theirs. We note that this star lies very close to star 1333, and disentangling which star is which, and to which star the photometry belongs, makes this situation difficult to judge.
Two program stars in Be 31 (886 and 666) were also studied by Friel et al. (2002) and the radial velocity measurements are in good agreement. They obtained km s-1 for star 886 (compared to our km s-1) and km s-1 for star 666 (compared to our km s-1). They concluded that star 666 was a non-member due to its high metallicity.
4.3 Membership Determination and Other Issues
Proper motions are also useful cluster membership indicators, but there are few data available for relatively distant clusters. Dias, Lépine, & Alessi (2002) have employed the TYCHO2 catalog to measure proper motions for individual stars and for clusters whose distances from the Sun exceed 1 kpc. While measurements are available for some stars in NGC 2141 and Be 31, none of those measured are common to our program stars.
In Table 4 we identify the stars we believe to be cluster members with asterisks. We believe all four stars observed in Be 20 are cluster members, based on the small dispersion in radial velocity, and the plausible positions of the stars in the color-magnitude diagrams in Figures 1 and 2. (The spread in colors seen for stars 22 and 28 are consistent with the photometric uncertainties.) The same conclusions are drawn for the four Be 21 program stars (see Figures 3 and 4, and Table 4).
For NGC 2141, neglecting the two blended stars, 1333 and 1997, the remaining six stars all appear to be cluster members, again based on the color-magnitude diagrams (Figures 5 and 6) and the small range in radial velocities. Stars 1333 and 1997 may also prove to be members. Indeed, it is interesting to note that while the measured radial velocities for star 1997 differ dramatically (as noted above), the average of our measured radial velocity for star 1997 and that measured by Friel et al. (2002) is consistent with the cluster mean velocity. Could it be a spectroscopic binary? This would imply a large orbital velocity amplitude and, hence, a short period and a small orbital separation compared to the extended radius of the red giant.
All seven program stars in Be 29 also appear to be members, again based on the color-magnitude diagrams (Figures 7 and 8) and the small range in radial velocities.
Our luck with the color-magnitude diagrams does not extend to the final cluster, Be 31. Both the optical and infrared color-magnitude diagrams are complex, and the distribution in radial velocities further confuses cluster membership determinations. We suggest that stars 886 and 728 are cluster members, with = km s-1. It is interesting that the mean radial velocity for all five stars is consistent with this result, km s-1, although the scatter is large ( km s-1). We may have been unfortunate enough to have included an uncommonly large fraction of binary systems in our radial velocity measures. In the case of star 666, which appears to lie near the tip of the cluster’s red giant branch, it is interesting that the 2MASS survey found the image of the star to be elongated. Interestingly, Friel et al. (2002) also found a large dispersion in velocity for this cluster and a large number of field star contaminants.
5 CLUSTERS’ REDDENING AND DISTANCE ESTIMATION
The determination of interstellar reddening and extinction is especially challenging for stars and clusters that are concentrated to the Galactic plane, especially when we seek objects at large distances from the Sun. Since AK = 0.11 AV, we can study highly extinguished clusters in a a much more uniform manner if we rely on infrared photometry.
Recently, Carney, Lee, & Dodson (2004) derived a relation between the mean color index of red clump stars and a cluster’s metallicity:
| (1) |
Estimates of for clusters’ red clump stars, combined with an estimate of their metallicity, may therefore be combined to derive E() [= 0.52 E(); Rieke & Lebofsky 1985].
Based on Hipparcos parallax data, Alves (2000) argued that the mean luminosity of the red clump stars, , is not sensitive to metallicity, at least for [Fe/H] . Specifically, mag. This is an especially powerful tool given the apparent lack of sensitivity of to both metallicity and extinction. Using the data used to construct Figures 1-10, we apply these tools to our program clusters, as well as M67 (used to calibrate Equation 1). A few comments are in order, however.
Be 20 (Figure 1) does not show a clear red clump, but Figure 2 suggests that three stars with and may define such a locus. We provisionally identify those three stars as constituting the red clump for Be 20, but we flag the derived reddening and distance moduli as uncertain via colons in Table 6.
Be 21 suffers from large and differential reddening, making the infrared approach particularly valuable. We show in Figure 13 an expanded view of Figure 4, with the red clump stars identified as open circles. It is interesting how well the red clump is identified in the infrared compared to the optical regime (Figure 3), which we believe illustrates the relative effects of differential reddening in the optical compared to the infrared.
While not as heavily extinguished as Be 21, NGC 2141 nonetheless suffers the same effect. Again, a comparison of Figures 5 and 6 shows the tighter grouping in magnitude of the red clump stars, which are identified more clearly in Figure 14.
For Be 29, we identify five red clump stars, and, happily, in this case we have obtained radial velocities for four of them (see Figure 15). All four stars for which we have measured radial velocities are cluster members, as expected from their locations in the color-magnitude diagrams (see Table 4). Tosi et al. (2004) recently studied Be 29, the most distant open cluster, and derived a Galactocentric distance of 21.4 to 22.6 kpc, in good agreement with our distance estimate.
Unfortunately, we are unable to identify red clump stars unambiguously in Figures 9 and 10. We provide distance and reddening estimates based on the work of Guetter (1993).
As a check, it is of interest to derive the reddening and distance to M67. This is not a test, however, because M67 is one of the calibrating clusters for Equation 1. Janes & Phelps (1994) quote E() = 0.05 mag and d = 0.77 kpc. Agreement appears to be very good indeed.
Table 6 (columns 3 and 4) summarizes our preliminary values of the reddenings and distances for our program clusters. These are not final values because it is our primary purpose here to derive cluster metallicities using high-resolution, high-S/N echelle spectroscopy, and any changes to [Fe/H] will alter the reddening estimates. Distance estimates will not be strongly affected, for reasons discussed above.
6 ELEMENTAL ABUNDANCES
6.1 Photometric Estimation of Atmospheric Parameters
With estimates for reddening and distance, we are now able to make preliminary determinations of the temperatures and gravities for the stars for which we have obtained high-S/N spectra.
We adopt the color-temperature relations for giants from Alonso, Arribas, & Martínez-Roger (1999), and rely exclusively on . We transform the 2MASS photometry from Table 2 to the “TCS” system using transformation equations from Carpenter (2001) and Alonso, Arribas, & Martinez-Roger (1994), although, to first order, () = (). Alonso et al. (1999) also include relations between colors and bolometric corrections, and, again, we rely on the photometry. With the distance, temperature, and bolometric corrections, we are able to calculate log values if we adopt a mass for the red giants. Since the clusters have ages relatively like those of the Sun and are more metal-poor, we adopt 1.0 for all the clusters. Because the stellar mass enters only as the logarithm, our derived log values are not especially sensitive to this choice.
6.2 Analyses
The next step in our analysis is to check the photometric estimates for the effective temperature () and surface gravity (log ) and possibly derive new values based on the spectroscopy. Equivalent widths (EW) were measured for a selection of Fe I and Fe II lines using routines in IRAF. The primary source of values for the Fe I lines are the accurate laboratory measurements performed by the Oxford group (e.g., Blackwell et al. 1979a, b, 1980, 1986a, 1995 and references therein). To supplement our list of Fe I lines, a subset were drawn from Thorén & Feltzing (2000) and Paulson, Sneden, & Cochran (2003). For Fe II, we used the values from Biémont et al. (1991). Model atmospheres were computed with the ATLAS9 program (Kurucz, 1993). Using the current version of the local thermodynamic equilibrium (LTE) stellar line analysis program MOOG (Sneden, 1973), we computed abundances for each line based on the measured EW. We set by forcing the abundances from Fe I lines to be independent of the lower excitation potential, i.e., excitation equilibrium. Next the microturbulence () was determined from the condition that Fe I lines show no trend versus EW. Finally, we adjusted log until the abundances from Fe I and Fe II lines agreed, i.e., ionization equilibrium. Taking the photometric estimates for and log as our initial model, we iterated until a self consistent set of parameters was obtained. Our spectroscopic stellar parameters are presented in Table 7 and are close to the photometric estimates. In the subsequent abundance analysis, we adopt the spectroscopic stellar parameters.
Next we considered lines of O, Na, Mg, Al, Si, Ca, Ti, Mn, Co, Ni, Rb, Zr, Ba, La, and Eu measuring EWs when possible. We present our line lists in Table 8. The values for O were taken from Asplund et al. (2004). For Ca and Ti, the values were taken from the Oxford group (Smith & Raggett, 1981; Blackwell et al., 1982, 1983, 1986b). An inverted solar analysis was used to determine the Si values assuming log (Si) = 7.55. For Na, Mg, Al, Ni, and Zr, we relied upon the values from Ramírez & Cohen (2002). For Mn, the values were taken from Prochaska & McWilliam (2000) and include the effects of hyperfine splitting. The Co and Ba values were taken from Prochaska et al. (2000) and include hyperfine splitting. The values for Rb were taken from Tomkin & Lambert (1999) with hyperfine splitting and isotopic shifts taken from Lambert & Luck (1976) where we assumed a solar isotope ratio. For La and Eu, the values were taken from Lawler, Bonvallet, & Sneden (2001a) and Lawler et al. (2001b) respectively and we account for hyperfine and isotopic splitting assuming a solar isotopic mix for Eu. Hyperfine structure must be taken into account for certain odd-Z elements since magnetic interactions between the electrons and the nucleus split the absorption lines into multiple components. This splitting inhibits saturation and neglect of hyperfine structure can lead to abundance overestimates.
According to Burris et al. (2000), Zr, Ba, and La are synthesized primarily through the -process where 81%, 85%, and 75% of their solar abundance is attributable to the -process with the remaining 19%, 15%, and 25% being produced by the -process respectively. The opposite case holds for Eu where 97% of the solar abundance arises from the -process with only 3% attributable to the -process. For Rb, the solar abundance is due to 50% -process and 50% -process, though as we discuss later, Rb offers insight into the neutron density at the site of the -process (and therefore mass of the AGB star that synthesized the -process elements).
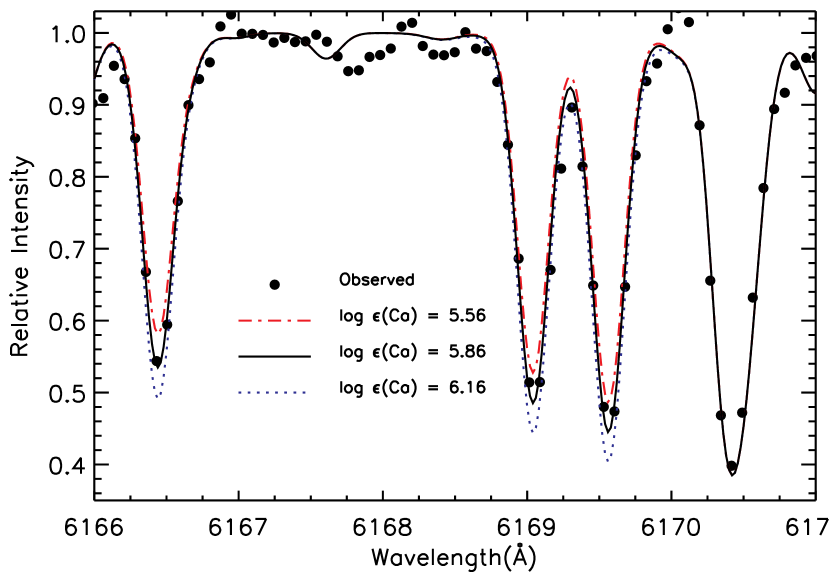
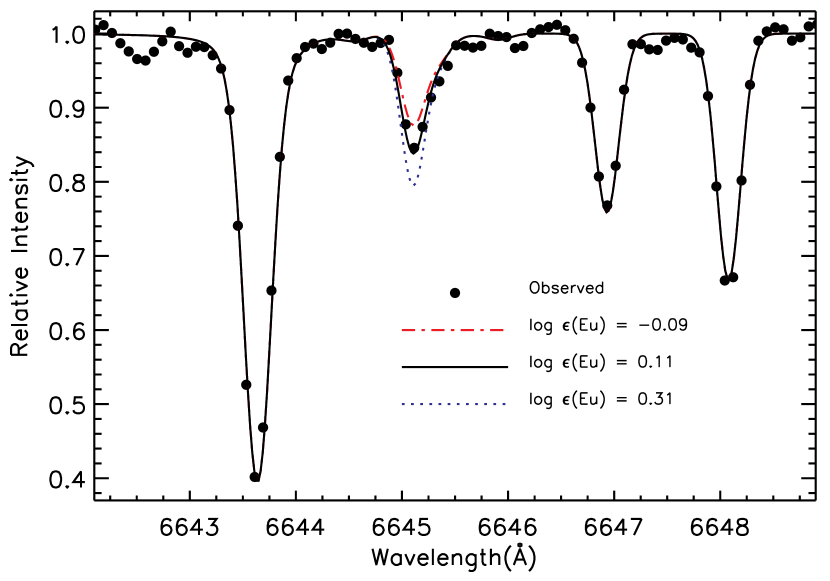
Unlike Fe, the species studied in this work (O-Eu) present only a handful of lines in our spectra. To ensure that the derived abundances were not affected by blends, we generated synthetic spectra using MOOG to determine the abundance for every line in every star. An 8Å window centered on the feature of interest was synthesized (contributing lines were taken from Kurucz & Bell 1995) and the abundances were adjusted until the observed spectrum was best fit. Guided by the syntheses, we occasionally needed to readjust the continuum by 1-2% to provide an optimal fit between observed and synthetic spectra. While spectrum synthesis is considerably more time consuming than EW analysis, the benefit is that this technique allows us to derive abundances for blended lines from which a traditional EW analysis is not feasible, e.g., Rb abundances can only be attained from spectrum synthesis due to blending from a Si line. Since the cool giants studied in this paper have crowded spectra, spectrum synthesis increased the number of lines we could analyze as well as our confidence in the derived abundances. In Figures 16 and 17, we present examples of our synthetic spectra fits to measure elemental abundances in two stars. In general, for the lines from which we derived abundances from EWs, the abundances from synthetic spectra were in good agreement. We also synthesized a handful of Fe lines and found no major differences between abundances derived from EWs and from spectrum synthesis.
To check our line lists and analysis techniques, elemental abundances were derived for the Sun using our adopted line lists and EWs measured in the Kurucz et al. (1984) Solar atlas. A model atmosphere was generated using ATLAS9 with the following parameters = 5770 (K) and log = 4.44 (cgs) where we adopted = 0.85 (km s-1) to remove trends between Fe I abundances and EW. In Table 9 we present our solar abundances. There is a good agreement between our derived abundances and the Grevesse & Sauval (1998) values. For the program stars, the elemental abundances are referenced to the “solar” values found in our study.
As an additional check of our line lists and analysis techniques, we analyzed Arcturus since it is a very well studied red giant at a similar evolutionary stage as the open cluster giants. We measured EWs from the Hinkle et al. (2000) Arcturus atlas and computed a model atmosphere with = 4300 (K) and log = 1.50 (cgs) using ATLAS9 adopting a microturbulence = 1.56 (km s-1) to remove trends between Fe I abundances and EW. In Table 10 we compare our abundances with those derived by Peterson, Dalle Ore, & Kurucz (1993) and Carraro et al. (2004). We find no major differences between the abundances derived from the different studies. We also compared our derived abundances for Arcturus, log (X), with Smith et al. (2000) and again find a good agreement.
Having shown that our analysis techniques reproduce the abundance distributions in two well studied stars, the Sun and Arcturus, we present in Table 11 our measured elemental abundance ratios for the open cluster giants. Typical internal errors for our spectroscopic model parameters are 100 K, log 0.3 dex, and 0.2 km s-1. In Table 12 we present the abundance dependences on the model parameters. The radial velocities of the stars were sufficiently large that the night sky emission did not affect the stellar O absorption lines near 6300Å. Due to the formation of the CO molecule, the measured O abundances depend on the assumed C abundance. Since we do not know the carbon abundances, we assumed a solar ratio [C/Fe] = 0.0. If we assumed [C/Fe] = +0.3, our derived O abundances [O/Fe] increase by +0.06 dex.
Tautvaišiene et al. (2000) have conducted a thorough abundance analysis of six clump stars and three red giants in the nearby open cluster M67. Their analysis of 25 elements included those observed in this study. In Table 13, we compare the mean abundances and find a good agreement between the different works further reinforcing our confidence in the adopted line lists and analysis procedures.
Carraro et al. (2004) measured abundances for two stars in Be 29. Their mean iron abundance [Fe/H] = 0.44 is in fair agreement with our value [Fe/H] = 0.54. For the alpha elements, their mean abundance [/Fe] = 0.17 is also in good agreement with our value [/Fe] = 0.22.
6.3 Be 21 T406, a rapidly rotating Li-rich star
During the abundance analysis, we noticed that Be 21 T406 exhibited an unusual spectrum. In Figure 18 we show the observed spectra for all stars centered on the Li feature near 6708Å. Be 21 T406 clearly exhibits a larger rotational broadening than the other giants. (The additional line broadening presumably due to rotation, compared to the other stars, is seen throughout the spectrum of Be 21 T406, not just near the Li line.) Be 21 T406 also displays an absorption feature whose wavelength is coincident with Li 6708Å. Due to the large rotational broadening, we were unable to identify clean Fe lines from which we would have determined spectroscopic stellar parameters via the techniques described earlier in the paper. Given that the photometric and spectroscopic parameters are in fair agreement for the rest of the sample, we therefore adopted the photometric parameters for this star and synthesized the Li region to estimate the abundance. We assumed a limb darkening coefficient of 0.75 (Gray, 1992) and found that a rotational broadening of 16 km s-1was necessary to best fit the line profile. The derived Li abundance is log (Li) = 0.2 using the same line list employed by Reddy et al. (2002) but assuming a contribution solely from 7Li, i.e., neglecting 6Li. Since Li is easily destroyed in stars, we do not expect to observe Li in red giants whose large convective envelopes cycle their atmospheres down to hot layers. With the possible exception of Be 29 673 there is no absorption feature near 6708Å in any of the stars. While it is quite unusual to be able to measure Li in such a cool star with a large rotational broadening, we would like to compare the Li abundance with other giants to see if the Li detection is significant. Ramírez & Cohen (2002) studied the globular cluster M71 and measured Li (or upper limits) for several cool giants. M71 has a metallicity comparable to the photometric estimate for Be 21. At 4200K, Ramírez & Cohen derived upper limits of log (Li) = 0.7. Compared to giants in M71 at a similar , Be 21 T406 has a Li abundance enhanced by a factor of 10.
One easy conclusion to draw is that the lithium enhancement is related to the unusually high rotational velocity. However, there is contradictory evidence from Hill & Pasquini (1999), who identified a giant Be 21 T33 with log (Li) = 3.0, but no sign of rotational broadening. Be 21 T33, had a similar (presumably low/normal) rotational velocity compared with the other giants they observed. One possibility considered by Carney et al. (2003) that can explain rapidly rotating Li rich giants is that a planetary companion is engulfed as the convective envelope expands while the star ascends the giant branch. In this scenario, Carney et al. (2003) suggested that the orbital angular momentum of the companion is converted into rotational angular momentum in the primary accompanied by an increase in the Li abundance. Self enrichment is a plausible alternate explanation for a high Li abundance in evolved stars (Charbonnel & Balachandran, 2000). Since the rotational velocities appear distinct between Be 21 T406 and Be 21 T33, the Li enhancement likely results from different mechanisms.
A subordinate Li line exists near 6104Å, however, we do not detect this line. Figure 3 in Hill & Pasquini (1999) shows that the 6104Å Li line is weak even when log (Li) = 3.0. Given the lower Li abundance and increased rotational velocity in Be 21 T406, the non-detection of the 6104Å Li line is unsurprising.
7 DISCUSSION
7.1 Abundance trends versus age
First we reinvestigate whether the open clusters exhibit any abundance trends as a function of age. As mentioned earlier, we adopt the age determinations by Salaris et al. (2004). Note that the outer disk open clusters are Be 20, NGC 2141, Be 29, and Be 31. M67 is not an outer disk open cluster but instead is representative of the solar neighborhood. The absence of a strong correlation between age and metallicity has been well established for open clusters (Friel, 1995; Friel et al., 2002, 2003; Chen et al., 2003; Salaris et al., 2004). We emphasize that systematic differences between the various studies can introduce or mask subtle abundance trends. Studies of a large number of clusters analyzed in a consistent and homogeneous manner are essential for identifying subtle abundance trends versus physical properties. It is also important to note that the term “metallicity” is vague, even though it is usually written as [Fe/H]. Low-resolution spectral indices, or photometric colors, are affected by elements other than iron, and which may not scale with iron. Further, many photometric colors are affected by uncertainties in reddening and, of course, in the selection of stars by which the indices or colors are calibrated against stars whose [Fe/H] values have been determined by high-resolution spectroscopy, which is not vulnerable to reddening or variations in [X/Fe].
Figure 5 in Friel et al. (2002) demonstrates that there is no clear trend between [Fe/H] and age. If an age-metallicity relation really does exist among the open clusters, then systematic differences between the various studies must be considerable or the open clusters belong to different stellar populations as we have noted previously. Reddy et al. (2003) found a decrease in metallicity with increasing age. An age-metallicity relation also appears to exist among thick disk stars (Bensby, Feltzing, & Lundström, 2004a). The lack of an age-metallicity relation in the studies by Edvardsson et al. (1993) and Nordström et al. (2004) may have been caused by the merger of stellar populations (thin disk, thick disk, and halo) with quite distinct chemical enrichment histories as noted earlier. It is not clear that this applies to the open clusters whose ages are generally younger than the thick disk and halo. While the lack of an age-metallicity relation in open clusters may be due to observational errors, it could also be due to an additional source of chemical enrichment. This may be especially important because the open clusters span a much wider range of Galactocentric distances than do the local thin and thick disk stars, and hence the open clusters may probe into realms where other merger events may have occurred.
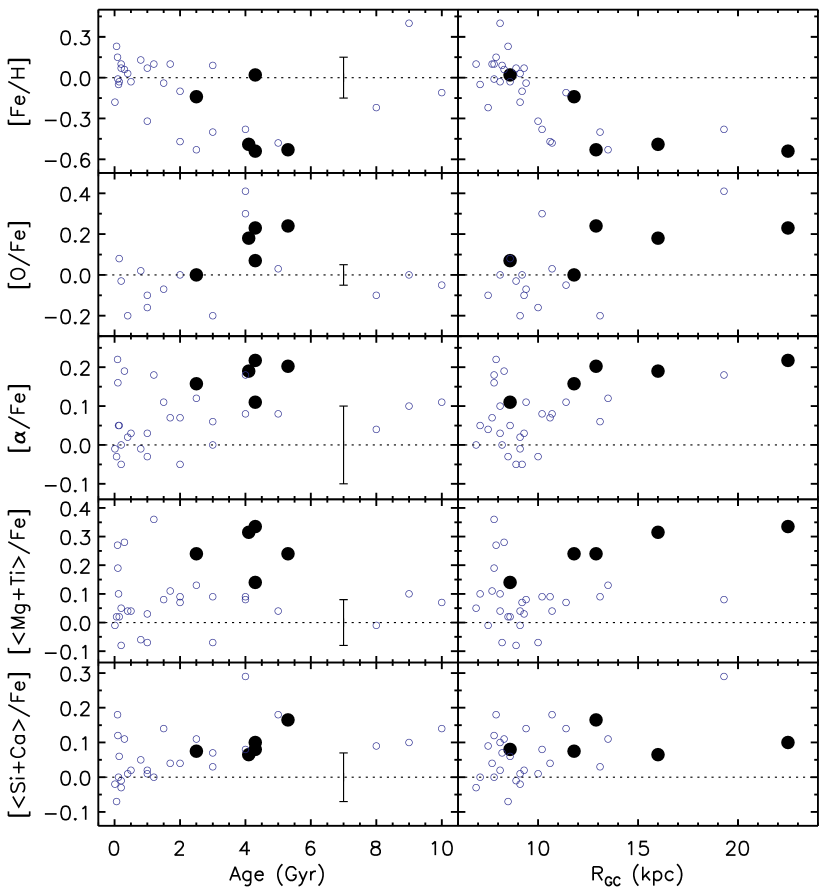
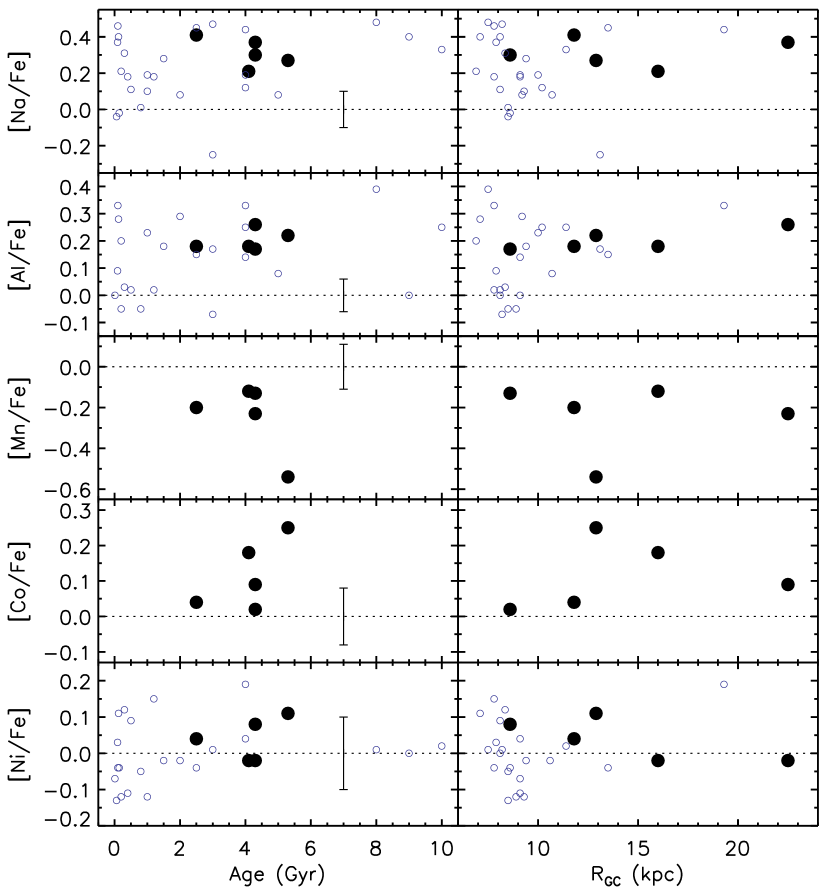
In Figures 19-21 we plot abundance ratios versus age for each cluster including numerous open clusters whose values were drawn from the literature (see Friel 2004).444 The open cluster data were taken from Bragaglia et al. (2001), Brown et al. (1996), Carraro et al. (2004), Cayrel, Cayrel de Strobel, & Campbell (1985), Edvardsson et al. (1995), Friel et al. (2003), Friel et al. (2005, AJ in press), Gonzalez & Wallerstein (2000), Gratton & Contarini (1994), Hamdani et al. (2000), Hill & Pasquini (1999), King et al. (2000), Luck (1994), Pasquini et al. (2004), Paulson et al. (2003), Peterson & Green (1998), Schuler et al. (2003), Schuler et al. (2004), Smith & Suntzeff (1987), and Wilden et al. (2002). (The results for our clusters reported earlier by Friel 2004 were preliminary, and are superseded by the results reported here.) We confirm the apparent lack of a correlation between [Fe/H] and age. Nor can we identify any clear trends between [Na/Fe], [Al/Fe], [Ni/Fe], [O/Fe], and [/Fe] versus age ( = Mg+Si+Ca+Ti). Friel et al. (2003) also found no trends between these abundance ratios and age. The three open clusters with ages between 8 and 10 Gyr do not have enhanced [O/Fe] or [/Fe], while some younger clusters do manifest enhancements. Age does not appear to be the key variable in this sample. But Figure 19 shows that Galactocentric distance is the vital parameter.
In Figures 20-21 we plot [Mn/Fe], [Co/Fe], [/Fe], and [Eu/Fe] versus age where is the average of Rb, Zr, Ba, and La. For these elements, the data do not span a large range in age so more observations are required before a conclusive statement can be offered on the presence of abundance trends with age. It would be astonishing if Mn, Co, Rb, Zr, Ba, La, or Eu exhibit a trend with age given the behavior of the other elements.
7.2 Abundance trends versus Galactocentric distance
In Figures 19-21 we plot abundance ratios versus Galactocentric distance, . As with the age-metallicity relation, prior studies of radial abundance gradients using open clusters have focused primarily upon the iron abundance due to a lack of data for other elements. Linear functions are usually imposed to fit the radial abundance gradients of [Fe/H] and it has been shown that [Fe/H] decreases linearly with increasing Galactocentric distance in the vicinity of the solar neighborhood. A striking fact is that beyond 10 to 12 kpc, the metallicity gradient appears to vanish. Rather than decreasing with increasing distance, the iron abundance appears constant with [Fe/H] . This result is consistent with Friel et al. (2002), who had only two clusters at such large distances and whose metallicities are similar to the basement value. Carraro et al. (2004) also studied Be 29, as well as Saurer A, both of which lie at large Galactocentric distances. Their results for Be 29 are similar to ours, as we noted previously, and that for Saurer A ([Fe/H] = , kpc) the constancy of [Fe/H] at large values persists. The disappearance of a radial abundance gradient is a challenge to explain.
The abundance ratios for the elements in the open clusters depend on Galactocentric distance. We see that [/Fe] is enhanced with respect to solar in the outer disk. The local clusters () have a lower [/Fe] than the clusters beyond 10 to 12 kpc. Not surprisingly, the behavior of O mimics the elements. This difference in [/Fe] reveals that the history of star formation has been rather different in the intermediate age clusters of the outer disk than in the solar neighborhood. We may wish to inquire, however, whether all of these abundances reflect the initial composition within the clusters or if the present abundances have been altered by internal nucleosynthesis and mixing.
The open cluster giants are luminous, highly evolved stars. Their convective envelopes may penetrate down to layers in which hydrogen-burning is taking place via the CNO cycle, the Ne-Na chain, and/or the Mg-Al chain. This leads to the possibility for burning O into N, Ne into Na, and Mg into Al such that the measured O, Na, Mg, and Al may not reflect their initial abundances (e.g., Salaris, Cassisi, & Weiss 2002). In Figure 22 we plot [O/Fe] versus [Na/Fe] and [Mg/Fe] versus [Al/Fe]. If mixing has taken place within these stars, we would expect O and Na to be anticorrelated as well as Mg and Al. Since we do not find such anticorrelations, we conclude that there are no obvious signs of mixing within the observed stars.
The abundances of Na and Al do not correlate with Galactocentric distance. For the open clusters, the ratios [Na/Fe] and [Al/Fe] are generally enhanced with respect to the solar value though there is a large dispersion. Carraro et al. (2004) found a similar pattern from their analysis of two distant open clusters.
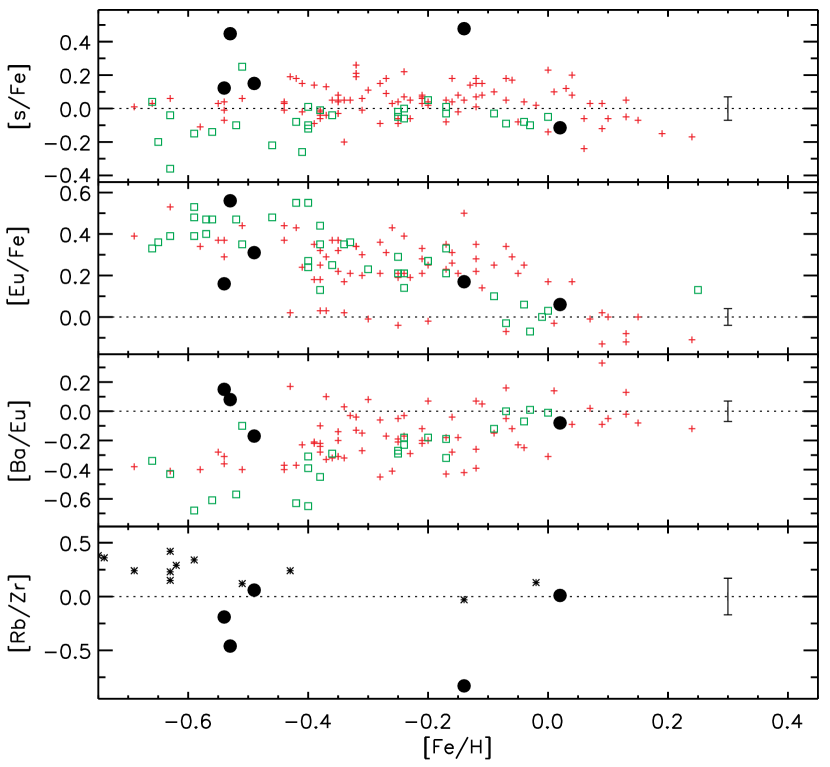
The abundances of Mn, Co, Ni, Rb, Zr, Ba, and La do not exhibit any obvious trends with Galactic location. The abundance of Co appears to track Eu while Mn is underabundant. For the neutron-capture elements Rb, Zr, Ba, La, and Eu, the dispersion in abundance ratios [X/Fe] in the outer disk is considerably greater than for other elements. While the data are sparse, we note that the neutron-capture elements are generally enhanced in the outer disk with the exception of Rb. Eu, in particular, appears to share the behavior of [/Fe] and show enhanced levels relative to Fe in the outer disk.
7.3 Comparisons with different stellar populations
A simple question that we can ask is at a given [Fe/H], how do the old open cluster abundance ratios [X/Fe] compare with different stellar populations: thin disk, thick disk, halo, bulge, and dwarf spheroidals. Before we make these comparisons, we first consider the chemical evolution of a closed system. Two “global” parameters, age and star formation rate, dictate the evolution, as we discussed in Section 1. Basically, a sufficiently old system will have experienced the contribution from Type II supernovae, but not from Type Ia supernovae. Such a system would have large ratios (i.e., higher than solar) of [/Fe], [O/Fe], and [Eu/Fe]. For a younger system, we expect to observe low (i.e., close to solar) ratios of [/Fe], [O/Fe], and [Eu/Fe] since sufficient time has passed to allow both Type II and Type Ia supernovae to evolve and eject their material. At an intermediate age, Type Ia supernovae will have begun their contribution such that the ratios [/Fe], [O/Fe], and [Eu/Fe] would lie below an older system but above a younger system. Due to the vulnerability of O to proton-captures in the hydrogen-burning shells of evolved giants and the magnitude of the errors for [Eu/Fe], [/Fe] is perhaps the most meaningful measure of the “age” of a system.
Compared to the outer disk clusters, the oldest ( 6 Gyr) open clusters with 7.5 11.5 are underabundant in [/Fe]. The key aspect may be that the oldest open clusters are in the solar neighborhood. That is, they all lie within the apparently magic 10 to 12 kpc limit, outside of which the radial metallicity gradient seems to disappear. The low [/Fe] in the oldest open clusters just means the clusters formed well after Type Ia supernovae had begun to contribute and that star formation in the solar neighborhood had already commenced. The higher [/Fe] of the outer disk clusters suggests that they formed shortly after a major burst of star formation. Their young ages indicate that this burst occurred recently, within the last 4-6 Gyr. (Our abundances combined with existing color-magnitude diagrams should enable more reliable ages to be determined for the open clusters.)
The star formation rate must also be taken into account. Once star formation commences, a slower star formation rate means that the transition from Type II supernovae to Type Ia supernovae occurs at a lower metallicity. For the reasons given above, we again identify [/Fe] as the preferred abundance ratio for tracking the star formation rate. The interpretation of the distinct [/Fe] versus [Fe/H] patterns observed in solar neighborhood thin disk and thick disk stars is that the two stellar populations have experienced different star formation rates.
While star formation does not necessarily need to commence everywhere at once, it appears to have done so in the halo (Rosenberg et al., 1999; Salaris & Weiss, 2002; De Angeli et al., 2005). Furthermore, the star formation rate must have been rapid given the near-constancy of [/Fe] (Carney, 1996).
The star formation rate provides a primary cause for a Galactic radial abundance dependence. A slower star formation rate in the lower density outer disk would lead to a currently lower mean metallicity and a higher gas-to-star mass ratio. Both of these are observed. Therefore, we would expect the outer disk to show a transition from Type II supernovae to Type Ia supernovae at a lower [Fe/H] than in the solar neighborhood if star formation began at roughly the same time. That we find enhanced [/Fe] in the outer disk implies a different star formation history compared to the solar neighborhood and the implications of this are discussed in more detail later.
Are there stellar populations with similar elemental abundance distributions like those we have found in the outer disk?
7.3.1 Thin and thick disks
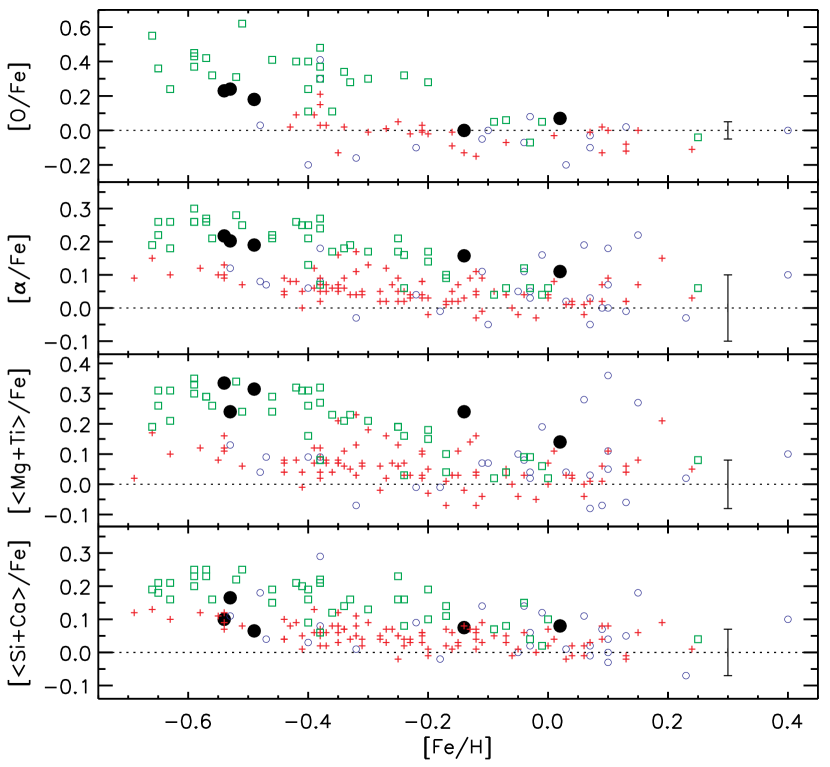
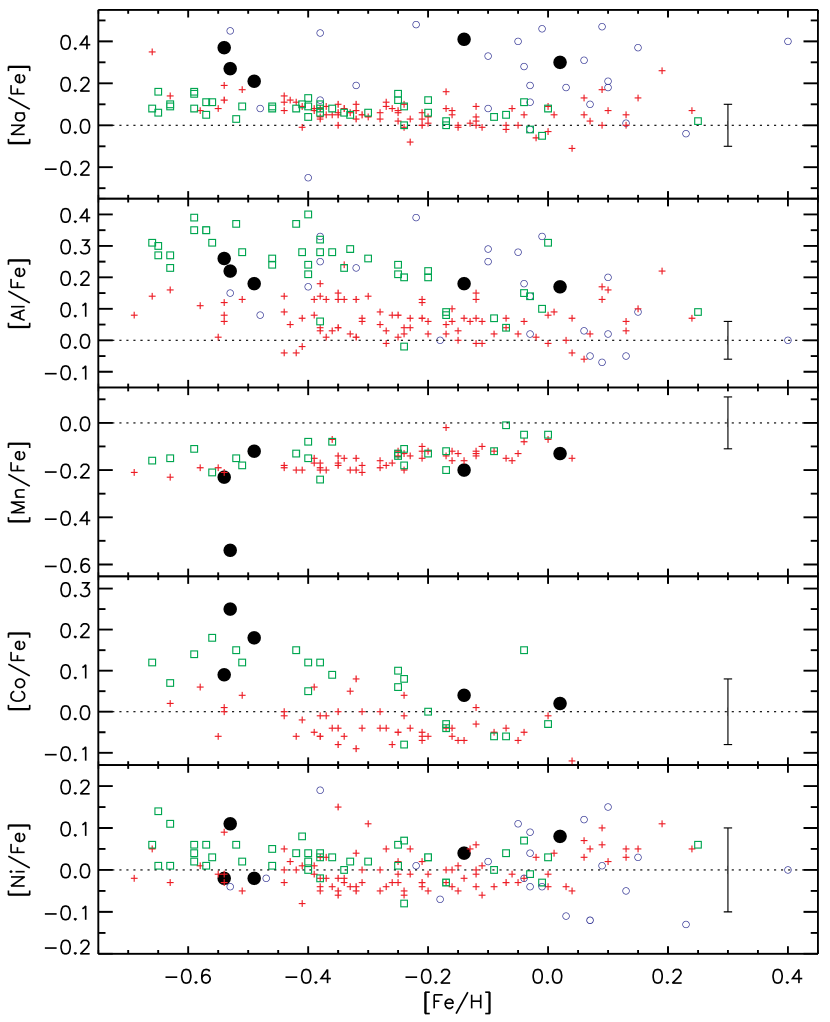
In Figures 23-25 we plot abundance ratios [X/Fe] versus [Fe/H] for the outer disk open clusters. Included in these figures are the abundance ratios for numerous open clusters taken from the literature (see Friel 2004) as well as thin disk and thick disk stars from various sources. Our comparison thin disk sample was a subset of stars from Edvardsson et al. (1993) and Reddy et al. (2003) which had probabilities 80% of thin disk membership according to the calculations by Venn et al. (2004). The thin disk sample was further restricted by considering only those stars with ages in the range 2-6 Gyr to directly compare stars with similar ages to the open clusters. The comparison thick disk sample was a subset of stars drawn from Edvardsson et al. (1993), Prochaska et al. (2000), Bensby, Feltzing, & Lundström (2003, 2004b), and Brewer & Carney (2005) which had probabilities 80% of thick disk membership again based on the computations by Venn et al. (2004). Thick disk stars tend to be older than the thin disk (e.g., Bensby et al. 2004a and Brewer & Carney 2005) and therefore no thick disk stars have comparable ages to the outer disk open clusters. First we consider the products of Type II supernovae, namely O and .
For the three most metal-poor outer disk open clusters (Be 20, Be 29, and Be 31), the [O/Fe] values are consistent with the lower envelope defined by the thick disk. M67, the solar neighborhood open cluster, and NGC 2141 have [O/Fe] ratios that follow the thin disk.
For the four outer disk open clusters we analyzed, [/Fe] exceeds the values found in thin disk stars at the clusters’ metallicities. Since O and elements (Mg, Si, Ca, and Ti) are primarily products of Type II supernovae, we would expect enhancements in [/Fe] compared to thin disk stars given that [O/Fe] is overabundant relative to the thin disk. The enhanced ratios of [/Fe] in the outer disk indicate intense star formation during which [Fe/H] was driven to the current observed levels. The star formation proceeded sufficiently fast that Type Ia supernovae did not have time to contribute to the ISM from which the present outer disk open clusters formed. This implies a more recent beginning to star formation (or the beginning of the major burst) in the outer disk than in the solar neighborhood.
Na appears enhanced with respect to the thin disk and thick disk at all values of [Fe/H]. Al appears enhanced compared to the thin disk with values similar to those of the thick disk. In their study of the open cluster IC 4651, Pasquini et al. (2004) found Na was enhanced in giants by 0.2 dex relative to the dwarfs and proposed that this was a result of dredge-up of Na freshly synthesized in the H-burning shell via the Ne-Na chain. Abundance differences within an open cluster have also been reported by Tautvaišiene et al. (2000) for M67. Clump stars were noted to display enhancements in N and Na along with depletions of C compared with the giants. In this case, Tautvaišiene et al. (2000) suggested that the additional mixing of material exposed to the CN cycle and the Ne-Na chain takes place after the core He flash at the tip of the first ascent red giant branch. Recall that in Figure 22, we found no evidence for “deep mixing” within our sample.
The abundance of Ni in the open clusters appears to follow the trends defined by the thin and thick disks, that is, [Ni/Fe] is solar. Mn and Co also tend to follow the thin and thick disks with slight underabundances of [Mn/Fe] and overabundances of [Co/Fe].
Next we consider the -process elements Rb, Zr, Ba, and La. For three of our open clusters, Be 20, Be 29, and M67, the abundance ratio [/Fe] (where = Rb+Zr+Ba+La) is in accord with thin and thick disk stars at the same metallicity. The remaining two clusters, Be 31 and NGC 2141, show large enhancements in [/Fe]. Unfortunately, for the two clusters with large excesses, the abundance measurements come from only one star. One explanation for overabundances of these -process elements is mass transfer from a companion AGB star, now a white dwarf. Identifying variations in radial velocity may help support the mass transfer scenario. If other stars in Be 31 and NGC 2141 show -process enhancements, then these open clusters would be similar to the globular cluster M4 which shows overabundances of Ba and La independent of evolutionary status (Ivans et al., 1999). The interpretation is that M4’s natal cloud was already enriched in -process elements. The globular cluster Cen also contains a population of stars that show excess -process abundances (Smith et al., 2000). This globular cluster is unique since it also shows a spread in Fe abundance. Low to intermediate mass AGB stars are believed to be responsible for the -process excess and a hiatus or decrease in the star formation rate may have allowed AGB ejecta to mix into the ISM before star formation restarted. It would be extremely interesting to study more stars in these two open clusters to see if other cluster members show enhancements in Zr, Ba, and La.
For four of the open clusters, the abundance ratios [Eu/Fe] match the thin disk. For the remaining cluster, Be 31, the Eu abundance slightly exceeds the thin disk and is comparable to the thick disk. In Be 31, Eu is enhanced relative to Fe such that [Eu/Fe] [Rb+Zr+Ba+La/Fe] 0.5. In this cluster we could only measure the abundances for a single star. Since Eu is synthesized primarily by the -process, we cannot invoke pollution from an AGB star to explain the excess. Instead, an excess in Eu can be explained if the star formed from primordial gas enriched by Type II supernovae and/or without a contribution from Type Ia supernovae. In this scenario, the Eu excess should be accompanied by O, Mg, Si, Ca, and Ti. It is difficult to understand the origin of the Eu enhancement in this outer disk open cluster given that we do not see large values of [/Fe] relative to the other outer disk open clusters clusters. That is, while [/Fe] exceeds the solar value, it is similar to other outer disk open clusters which do not show such extreme enhancements of [Eu/Fe]. Observations of more cluster members are required to confirm and understand the origin of the Eu excess in Be 31. Interestingly, the abundance ratio [Co/Fe] appears to follow [Eu/Fe] for all clusters as anticipated if Co is synthesized in massive stars.
We conclude that neither the local thin nor thick disk populations provide exact templates to match the abundances seen in the outer disk open clusters. Specifically, measurements of O, Na, Al, and clearly suggest a different nucleosynthetic history for the outer disk when compared with the thin and thick disks. In addition to the chemical composition differences, the thick disk may be eliminated as a possible source of the open clusters based on age considerations: the thick disk is much older than the clusters (Bensby et al., 2004a; Brewer & Carney, 2005). Note that the composition of the nearby cluster M67 is representative of the thin disk and differs from the outer disk open clusters.
7.3.2 Halo
The metallicity distribution function for the halo peaks around [Fe/H] = with a metal-rich tail extending as high as [Fe/H] = (Laird et al., 1988; Ryan & Norris, 1991). The outer disk open clusters are not as metal-poor as the bulk of the halo nor are they as old as the halo. Based on the Fe abundances and ages, it is unlikely that the outer disk open clusters can be associated with the halo. Kinematic considerations would also suggest no plausible connection between the halo and outer disk open clusters. Nonetheless, studies of halo stars and clusters offer us tools to explore the nucleosynthetic history of the outer disk.
Often applied to halo stars, abundance ratios between different neutron-capture elements can provide a detailed insight into their nucleosynthesis. We examine more carefully abundance ratios between the neutron-capture elements to gain further insight into the chemical enrichment history of the outer disk open clusters.
Sneden et al. (1994) identified a metal-poor star, CS22892-052, with large excesses of the neutron-capture elements. The abundance pattern of these heavy elements represents a scaled solar “pure -process” distribution. Though rare, additional metal-poor stars have since been identified in which the neutron-capture elements follow a scaled solar -process pattern. The open clusters have abundance ratios [La/Eu] and [Ba/Eu] that vary from cluster to cluster. At one extreme, NGC 2141 has [La/Eu] = 0.4 and [Ba/Eu] = 0.74 and at the other end Be 20 has [La/Eu] = 0.01 and [Ba/Eu] = 0.17. All clusters have [La/Eu] and [Ba/Eu] ratios considerably greater than the pure -process value. (Assuming the Burris et al. (2000) assignments for the -process and -process fractions, the pure -process values are [La/Eu] = 0.6 and [Ba/Eu] = 0.82 while the pure -process values are [La/Eu] = 1.4 and [Ba/Eu] = 1.45.) This demonstrates that the gas from which the outer disk open clusters formed had been polluted by Type II supernovae as well as AGB stars. This is not surprising given that the open clusters have -process enhancements and are considerably more metal-rich than CS22892-052. Although some halo stars as metal-rich as [Fe/H] = show a pure -process distribution for heavy elements, other halo stars as metal-poor as [Fe/H] = 2.0 show evidence for -process production (Simmerer et al., 2004). Note that for all clusters, the abundances of heavy elements (Ba + La) exceeds the light element (Zr) abundances.
While the solar Rb abundance is attributed in equal parts to the -process and -process, Rb offers a potential diagnostic of the neutron density at the site of the -process, and therefore the mass of the AGB star(s) responsible for their synthesis (Busso, Gallino, & Wasserburg, 1999). The abundance of Rb relative to other light -process elements such as Sr, Y, and Zr is controlled by the neutron density at the site of the -process. This sensitivity arises from the 10.7 year half-life of 85Kr. At low neutron densities, 85Kr decays to 85Rb. At higher neutron densities, 85Kr will capture neutrons and form 86Kr and then 87Kr which decays to 87Rb (effectively stable since the half-life is years). The key feature is that the neutron-capture cross-sections differ by a factor of 10 between the two Rb isotopes ( = ). While stellar Rb isotope ratios cannot be measured, at low neutron densities the ratio Rb/Zr can be up to 10 times lower than at high neutron densities. The neutron density at the site of the -process is controlled by the mass of the AGB star (see Lambert et al. 1995 for more details on the use of Rb in measuring the neutron density of the -process in stars). Inspection of Figure 14 in Smith et al. (2000) suggests that the -process elements in the three most metal-poor outer disk open clusters (Be 20, Be 29, and Be 31) are likely to have been produced in 1.5 – 3M⊙ AGB stars. We note that Be 20 has a higher ratio [Rb/Zr] than Be 29 and Be 31, though we could only measure Rb in one of the two cluster stars. This higher [Rb/Zr] ratio could be due to the -process elements being synthesized in higher mass AGB stars. If the -process elements observed in Be 20 were produced in AGB stars more massive than 3M⊙, we would also expect high ratios of 25Mg/24Mg (and 26Mg/24Mg) due to the 22Ne()25Mg reaction providing the neutron source rather than the dominant neutron source 13C()16O in low mass stars. This could be verified by measurements of Mg isotope ratios in Be 20 though additional observations with high resolution and high S/N would be required.
7.3.3 The Galactic Bulge
While detailed abundance measurements of stars in the Galactic bulge are rare, we may compare the limited bulge data with the equally limited data for the outer disk open clusters. Based on location, kinematics, and age, it is unlikely that the outer disk open clusters can be associated with the bulge. In addition to the large physical separation, there is a considerable difference in age, with the bulge being much older, at least 10 Gyr according to Zoccali et al. (2003). Nevertheless, we conduct a comparison of the chemical compositions starting with a more careful investigation of the behavior of the elements. As McWilliam & Rich (1994) point out, the observed abundances of O, Mg, Si, S, Ca, and Ti in thin disk and halo stars exhibit a common pattern. These elements show an increasing abundance relative to Fe as [Fe/H] decreases. From a nucleosynthetic perspective, Mg, Si, S, Ca, and Ti are not predicted to follow O exactly. Woosley & Weaver (1995) presented extensive nucleosynthesis calculations for massive stars characterizing the yields either by the mass ejected or by the production factor (the mass fraction of a nuclide in the ejecta normalized to the standard solar mix). Inspection of the Woosley & Weaver (1995) production factors for metal-poor supernovae show variations of up to a factor of three between O, Mg, Si, Ca, and Ti. Ti is a well known case for which observations show an -like behavior but based on theoretical yields, Ti is expected to scale with Fe.
Observations of K giants in the Galactic bulge have shown that the abundances of [Mg/Fe] and [Ti/Fe] are enhanced but that [Si/Fe] and [Ca/Fe] are not as strongly enhanced and act in a similar manner as thin disk stars (McWilliam & Rich, 1994). It is difficult to interpret such abundance patterns. Mg and Ti offer evidence that the star formation was rapid and intense with the nucleosynthesis controlled by massive stars. Si and Ca present a conflicting case in which a longer duration of star formation allowed Type Ia supernovae to play a prominent role. McWilliam & Rich showed that modifications to the adopted stellar parameters cannot result in all elements giving the same [/Fe] ratio. Clearly nature is more complex than our understanding. Slight enhancements for [Eu/Fe] in the bulge giants offer further support for rapid star formation in the bulge.
Throughout this paper we have grouped Mg, Si, Ca, and Ti together, referring to them as the “” elements. Oxygen should behave identically to these elements assuming no depletion from deep-mixing. Now we split the elements into two separate groups, Mg+Ti and Si+Ca. In Figures 19 and 23, we find that the enhancement in [/Fe] is driven by enhanced [Mg/Fe] and [Ti/Fe]. We see that [Si/Fe] and [Ca/Fe] are almost present in their solar proportions. Excluding the nearby cluster M67, we find a mean difference for the outer disk open clusters of [Mg+Ti/Fe][Si+Ca/Fe] = 0.2. Inspection of Table 12 demonstrates that no adjustment to the stellar parameters will force Mg, Si, Ca, and Ti to have the same [/Fe] value. When we re-examine Figure 19, we see that [Si+Ca/Fe] is essentially constant as a function of Galactocentric position, but [Mg+Ti/Fe] follows [O/Fe] where the abundance ratios increase with increasing Galactocentric radius. We see in Figure 23 that [Si+Ca/Fe] and [O/Fe] mimic the field stars at the same metallicity whereas [Mg+Ti/Fe] is enhanced with respect to the field stars. It is difficult to understand the origin of the difference between Mg+Ti and Si+Ca. While the observed element abundances could potentially be used to probe the mass of the polluting supernovae, we do not see any yields in Woosley & Weaver (1995) with low Si and Ca along with high Ti and Mg. At this stage, all we are able to say is that the bulge and outer disk clusters seem to have experienced a similar but not shared nucleosynthetic history with regard to the synthesis of the elements and that our present understanding of the stellar nucleosynthesis of the elements is incomplete.
The element abundance patterns are not unique to the McWilliam & Rich (1994) study of the bulge and this study of the outer disk open clusters. We also note that the globular cluster NGC 6553 has an inner-disk/bulge-like space velocity and appears to share the bulge’s unusual pattern of element abundances (Cohen et al., 1999). Pompéia, Barbuy, & Grenon (2003) studied a sample of nearby dwarfs with kinematics signifying an inner disk or bulge origin. In their sample, Si and Ca followed the bulge trend and were underabundant with respect to Mg. That the Ti abundances did not follow the bulge’s pattern may suggest that the sample is not representative of the bulge.
Additional elemental abundance ratios point to a similar, but not shared, nucleosynthetic history between the bulge and the outer disk open clusters. McWilliam & Rich (1994) found large enhancements of [Al/Fe] in bulge giants. While the enhancement is not as extreme, we also observe excess [Al/Fe] abundances in the outer disk. McWilliam & Rich (1994) also found Sc and Co to be overabundant in bulge stars. We tried to determine abundances for Sc but no useful lines could be identified in our sample. For Co, the most distant open clusters show slight enhancements in [Co/Fe] signifying yet another possible connection between the outer disk and the bulge populations.
7.3.4 Dwarf spheroidals
In the standard picture of hierarchical structure formation, galaxies form via the accretion of smaller structures. Our Galaxy is believed to have formed via such a process (Searle & Zinn, 1978) with the Sagittarius dwarf spheroidal galaxy being an example of an on-going merger event (Ibata, Gilmore, & Irwin, 1995). The nearby dwarf spheroidal galaxies are potential surviving candidates from which the Galaxy may have formed and that the outer disk may have been accreting. However, observations reveal that at a given [Fe/H], the nearby dwarf spheroidal galaxies exhibit very different [/Fe] ratios to those measured in the halo (see Venn et al. 2004 and references therein). Generally the dwarf spheroidals have lower [/Fe] at a given [Fe/H]. Such observations preclude the current dwarf spheroidal galaxies as being the building blocks from which the Galaxy formed. Based on enhanced [/Fe] ratios in the open clusters in this study, we can extend this conclusion to the outer disk. That is, accretion of dwarf galaxies with compositions similar to the current dwarf spheroidals is unlikely to have built up the outer disk. However, the Mn abundances in one cluster offer evidence for a possible connection between the outer disk and dwarf spheroidals.
Our measurements of Mn in the outer disk open clusters are very well matched to the thin and thick disks with [Mn/Fe] decreasing with decreasing [Fe/H]. McWilliam, Rich, & Smecker-Hane (2003) has measured Mn abundances in the Galactic bulge and showed that [Mn/Fe] mimics the behavior seen in the solar neighborhood while stars in the Sagittarius dwarf are more deficient in [Mn/Fe] at a given [Fe/H]. McWilliam et al. (2003) suggested that the yields of Mn from Type Ia and Type II supernovae are metallicity dependent, a view also shared by Shetrone et al. (2003). Given that four of our clusters show [Mn/Fe] that match the thin disk but have excess [/Fe], we agree that the synthesis of Mn probably takes place in both Type Ia and Type II supernovae with metallicity dependent yields rather than by Type Ia supernovae as suggested by Gratton (1989). McWilliam et al. (2003) propose a search for low [Mn/Fe] that would reveal the signature of accretion of low-mass systems into the Galaxy. One cluster, Be 31, appears to have an unusually low Mn abundance with a value similar to stars of comparable metallicity in the Sagittarius dwarf. However, this cluster has enhanced [/Fe] which is not seen in dwarf spheroidals at the same [Fe/H], for example, Bonifacio et al. (2004) find sub-solar [/Fe] in a metal-rich population () in the Sagittarius dwarf. Further complicating the nucleosynthetic history of this cluster are the enhanced ratios of [Zr/Fe], [Ba/Fe], [La/Fe], and [Eu/Fe]. Observations of additional members of Be 31 are required to determine if the low [Mn/Fe] is peculiar to the individual star that was studied or if Mn is deficient in all cluster members. Overall, Mn offers little evidence that the outer disk is comprised by dwarf spheroidals.
7.3.5 Cepheids, OB stars, and Planetary nebulae
Cepheids, OB stars, and planetary nebulae (and H II regions) have also been used to search for metallicity gradients in the outer disk. (Cepheids will be discussed in considerable detail in a future paper in this series.) We offer some brief comparisons with the open clusters though we reiterate that possibly different techniques and tools are applied to the various analyses. None of these other objects extend to the same large Galactocentric distances that the open clusters encompass. Furthermore, radial abundance gradients are believed to have evolved with time making the different age ranges spanned by the diverse classes of objects an important issue to consider.
We note first that Cepheids are high mass stars with very short lifetimes relative to the open cluster giants and therefore reflect the present abundances in the ISM. Like the open clusters, Cepheids in the range 10 (kpc) 15 also show evidence for a differing behavior for [Fe/H] compared with the solar neighborhood and Galactic center (Andrievsky et al., 2002c; Luck et al., 2003; Andrievsky et al., 2004). For the inner disk, the Cepheids show a steep radial abundance gradient for [Fe/H]. In the solar neighborhood, the abundance is roughly constant with a mean value of [Fe/H] 0.0. For 10 kpc, the abundance is constant and the mean value for Cepheids is [Fe/H] which is greater than the basement value seen in the open clusters. In particular, the Cepheids display a radial abundance discontinuity in [Fe/H] around 10 kpc. This radial abundance discontinuity was first noted by Twarog, Ashman, & Anthony-Twarog (1997) in a study of open clusters based on photometric metallicities. At the risk of overinterpreting the data, our results are consistent with a radial abundance discontinuity albeit one that may occur closer to 12 kpc. However, the elements Na, Al, Si+Ca, Mn, and Ni do not appear to change with . The solar neighborhood Cepheids tend to have solar ratios for [O/Fe] and [/Fe] as anticipated for a population younger and slightly more metal-rich than the open clusters. The Cepheids do not exhibit the peculiar abundance pattern for the elements seen in the bulge and open clusters though they do show enhanced ratios for -process elements and Eu. It would be extremely useful to measure abundance ratios in more distant Cepheids to compare with the open clusters.
Hot, young OB stars not only suggest a radial abundance gradient in the disk, they also offer evidence for a decreasing gradient with time when compared with other classes of objects (Daflon & Cunha, 2004). Further, abundances in OB stars are in general agreement with the composition discontinuity displayed by Cepheids. Unfortunately the data do not extend to sufficiently large Galactocentric distances to explore whether OB stars show an abundance plateau in the outer disk. Planetary nebulae also provide evidence for flatter radial abundance gradients, or a possibly constant abundance, in the outer disk compared with the solar neighborhood (Costa, Uchida, & Maciel, 2004). In general, Cepheids, OB stars, and planetary nebulae offer additional evidence for different abundance trends in the outer disk relative to the solar neighborhood.
7.4 Comparison with model predictions
Having compared the abundance patterns in the outer disk with existing stellar templates (thin disk, thick disk, halo, bulge, and dwarf spheroidals), we find that similarities are present for particular abundance ratios. However, none of the stellar populations provides a precise match to the abundances measured in the outer disk open clusters. Age comparisons and kinematic considerations make it even more difficult to associate the open clusters with any known stellar population. Therefore, we shift our attention to theoretical predictions.
As discussed by Carraro et al. (2004), Chiappini, Matteucci, & Romano (2001) have presented a chemical evolution model (their model C), that reproduces both the linear decrease in [Fe/H] in the solar neighborhood as well as a basement (or slight increase) for the outer disk. In their model, the Galaxy forms as a result of two separate gas infall episodes. The first gas infall episode leads to the rapid collapse of primordial gas into the halo and bulge components. For the halo, star formation does not cease if the gas density falls below a critical value. The second gas infall episode forms the thin disk via the accretion of primordial gas along with trace amounts of halo gas. Star formation only proceeds if the gas density exceeds a threshold value. For the innermost regions of the disk, the gas falls in at a faster rate than in the outermost regions. Star formation occurs more rapidly, leading to a more complete conversion of gas into stars. This accounts for the linear decrease in [Fe/H] with increasing Galactocentric distance. For the outer disk, the halo and disk gas densities are comparable such that gas left-over from the halo is incorporated into the star formation that produces the stellar content of the outer disk. For the inner regions, including the solar neighborhood, the disk gas always dominates the halo gas. At a certain point in the outer disk, [Fe/H] stops decreasing and begins to reach a minimum value (or even increase again) due to the non-negligible contribution from the pre-enriched halo gas. The predictions from the Chiappini et al. (2001) model provide a very good match to the observed iron abundances.
Setting aside the subtle differences between [Mg+Ti/Fe] and [Si+Ca/Fe] discussed earlier in the paper, the global enhancement in [/Fe] in the outer disk is consistent with predictions from the Chiappini et al. (2001) model. If the outer parts of the disk formed from halo gas, then we would also expect halo-like abundances for the elements. Further, the model would predict enhanced [Eu/Fe] in the outer disk due to the dominance of halo gas which is also consistent with the observations. However, halo stars have low ratios of [Na/Fe] and [Al/Fe] with respect to the solar value (e.g., McWilliam et al. 1995; Ryan et al. 1996; Cayrel et al. 2004). If the model correctly describes the formation of the outer disk, then it is unusual that [/Fe] is in accord with the halo but that Na and Al differ from the halo. Unfortunately, the Chiappini et al. (2001) do not offer predictions for Na and Al in the outer disk.
We are also concerned with conflicting kinematics between the halo and the disk. For example, consideration of the angular momentum may preclude the possibility that the outer disk is comprised by left-over halo gas. Is it physically realistic that the halo (a population with negligible angular momentum) can contribute to the outer disk (a very high angular momentum ensemble)? Based on angular momentum arguments, Carney, Latham, & Laird (1990) and Wyse & Gilmore (1992) have shown that the gas left over from the halo most likely resides in the bulge. The good agreement between our data and the Chiappini et al. (2001) predictions might suggest that the outer disk and halo may have a similar but not shared star formation history. But we have dismissed such an idea earlier in the paper citing the different [Fe/H] ranges, ages, and kinematics. Therefore, specific details regarding the chemo-dynamical evolution of the outer disk may require refinement and need to be incorporated into the chemical evolution model. We look forward to detailed predictions of a larger ensemble of elemental abundance ratios in the outer disk.
While additional chemical evolution models offer a fair match to observed abundance ratios in the solar neighborhood (e.g., Hou, Prantzos, & Boissier 2000; Alibés, Labay, & Canal 2001), they predict a continually declining iron abundance with increasing Galactocentric radius, in conflict with our observations. The discontinuity in [Fe/H] displayed by the Cepheids has been interpreted in several ways. Twarog et al. (1997) offer a qualitative argument that the limiting value of [Fe/H] (due in part to the logarithmic nature of [Fe/H] and the nucleosynthetic yield i.e., stellar yields, initial mass function, gas dynamics etc.) for the outer disk is simply lower than for the inner disk. Twarog et al. (1997) also consider that “10 kpc is a reflection of the original boundary of the newly formed” thick disk. Andrievsky et al. (2002c), Luck et al. (2003), and Andrievsky et al. (2004) suggest that the radial abundance discontinuity is a result of inefficient mixing processes due to a small radial component of the gas velocity near the co-rotation resonance as described by Lépine, Mishurov, & Dedikov (2001). However, it is not obvious how the abundance ratios in the outer disk – high [/Fe], peculiar element pattern, excess Na, Al, and -process abundances – fit into this scenario. An additional concern is that the lack of a radial metallicity gradient apparently persists over a very large range of distances, well beyond the co-rotation radius.
7.5 Speculations: remnants of a merger event(s)
Despite the relative youth of the outer disk open clusters, the abundance ratios [/Fe] and [Eu/Fe] point to a recent beginning of star formation, contrary to what is seen in the solar neighborhood. The outer disk star formation was probably not slow and steady since we do not see strong signs of Type Ia supernovae contributions, though we do see the effects of contamination from low mass AGB stars.
Chiappini et al. (2001) argued that the outer disk formed from a second reservoir of gas that had experienced a different star formation history. They suggested the halo as a likely source, but we note that angular momentum considerations probably mean that the halo is an inappropriate choice. However, the general idea has merit. Could a merger with an object on a prograde, low-inclination orbit provide the source of gas? Similarly, could interactions between such an object and the Galaxy have triggered an intense burst of star formation in an otherwise unpolluted gaseous outer disk? If so, the ages of the oldest outer disk open clusters are probably a chronometer of when such an event took place. Janes & Phelps (1994) suggested that indeed the old open clusters may have formed during bursts of star formation triggered by mergers or interactions with external systems. Scott, Friel, & Janes (1995) noted that two old clusters, NGC 6791 and Be 17, have unusually eccentric orbits.
An excess of stars has recently been identified in the direction of the Galactic anticenter (e.g., Newberg et al. 2002, Ibata et al. 2003, Rocha-Pinto et al. 2003, and Yanny et al. 2003). Frinchaboy et al. (2004) refer to this stellar overdensity as the Galactic anticenter stellar structure (GASS) due to its ambiguous shape, orientation, size, and origin. The GASS has also been referred to as the Monoceros ring and might be related to Canis Major galaxy (Martin et al., 2004; Martin et al., 2005). Five globular clusters (Pal 1, NGC 2808, NGC 5286, NGC 2298, and BH 176) are located near the GASS and lie in a peculiar string-like configuration, not found elsewhere among the globular cluster system and resembling a tidal stream. Pal 1 and BH 176 are unusual globular clusters because they are both young and metal-rich and therefore possibly “transitional” clusters between young globular clusters and massive old open clusters. Four distant Galactic open clusters (AM 2, Tombaugh 2, Be 29, and Sau A) are located near the GASS and appear to extend the string-like configuration defined by the four globular clusters associated with the GASS. Frinchaboy et al. (2004) searched for more clusters extrapolating from the alignment of the 9 clusters. An additional 7 clusters were found, further extending the string-like sequence.
Frinchaboy et al. (2004) suggested that the GASS system and associated clusters are possibly the result of tidal accretion of a dwarf satellite galaxy. The center of the GASS would presumably be the nucleus of the accreted dwarf galaxy. Bellazzini et al. (2004) suggested that the accreted Canis Major galaxy is centered at . Crane et al. (2003) also argued that the GASS is a satellite galaxy currently in the process of being tidally disrupted. Evidence for this scenario include: (1) the velocity dispersion for M giants associated with the GASS is smaller than for stars in the thin disk; (2) the GASS shows a trend between Galactocentric radial velocity () and Galactic longitude () indicating a non-circular orbit; (3) a wide metallicity spread [Fe/H] has been found, assuming all the above-mentioned clusters belong(ed) to the galaxy.
We caution that it is difficult to assign GASS membership based solely upon radial velocities. Members of the GASS on a low-inclination prograde orbit will behave very similarly to the outer Galactic disk since they’re both responding to the same gravitational potential. Nonetheless, Frinchaboy et al. (2004) suggest that Be 29 is a GASS member while Be 31 is not. In Table 5, we include for the outer disk open clusters. Combined with Galactic longitude, a comparison can be made with Figure 2 in Frinchaboy et al. (2004) to see how well the outer disk open clusters match the - distribution defined by the GASS. Be 21 and NGC 2141 fall close to the - relation while Be 20 does not. When we compare [Mg/Fe], [Si/Fe], [Ca/Fe], and [Ti/Fe] for Be 29 and Be 31, they are essentially identical. It is unusual that open clusters with comparable ages but presumably very different origins would both have similar and peculiar abundance ratios.
NGC 2298 is one of the globular clusters possibly associated with the GASS to which Salaris & Weiss (1998) assign an age of 11.7 1.1 Gyr. McWilliam, Geisler, & Rich (1992) found enhancements in NGC 2298 similar to those we observe in the outer disk open clusters. It is very difficult to understand how the globular cluster NGC 2298 and the open cluster Be 29 with wildly different ages and Fe abundances but presumably a common origin in a small galaxy can have similar [/Fe] ratios. The only contrived possibility is through an episodic merger picture where infall of metal-poor gas triggers a brief period of star formation. But it seems more likely that episodic mergers would happen to our Galaxy rather than accretion of a smaller satellite.
Peñarrubia et al. (2004) also warn that position and radial velocities alone are insufficient to assign membership. Martin et al. (2004) suggested that the globular clusters NGC 1851, 1904, 2298, and 2808 may be associated with Canis Major. However, Peñarrubia et al. (2004) considered proper-motions for these clusters and showed that they are kinematically distinct from Canis Major.
That the open clusters appear to have experienced a star formation and nucleosynthetic history unlike any known Galactic population is consistent with the outer disk being formed, in part, by a merger event. (The similarity to the Galactic bulge discussed in Section 7.3.3, recall, is only similar, not shared.) If the merger event was caused by the GASS, then the similar and unusual compositions would suggest that all outer disk open clusters are associated with the merger. This would imply that the radial velocity criterion for assigning GASS membership is inadequate. An origin from a merger event is appealing since it would help explain the lack of an age-metallicity relation in the outer disk open clusters. Since age-metallicity relations have now been shown to exist for the thin and thick disk, the lack of an age-metallicity relation for the open clusters suggests that they represent a collection of different stellar populations. There are two ways in which the open clusters can be attributed to a possible merger event. Either they were created by the merger event out of Galactic material or they were part of the victim galaxy. If the outer disk open clusters were originally members of the victim, then star formation must have commenced recently and proceeded sufficiently rapidly to reach [Fe/H] = 0.5 without much contamination from Type Ia supernovae. Moreover, for a given [Fe/H] the GASS would have had [/Fe] ratios unlike those observed in the current dwarf spheroidals. Such a situation seems somewhat improbable given that recent observations of candidate members of Canis Major show solar or sub-solar ratios of [/Fe] (Sbordone et al., 2005). A more plausible scenario may be that the outer disk open clusters were created from star formation triggered by the merger event. Another possibility is that the outer disk grew in spurts through continual or episodic infall of gas and/or dwarf galaxies with the GASS/Canis Major representing one end of the mass spectrum. A test of this would be the identification and abundance analysis of additional open clusters at large Galactocentric distances with an emphasis on clusters both younger and older than those of this study.
If a merger is the preferred explanation for the formation of the outer disk, such a scenario must account for the basement in [Fe/H] that persists over 10 kpc, the enhanced [/Fe] indicative of rapid star formation for these young clusters, and abundance ratios that do not match any known stellar population. Ultimately, more data are required to characterize and understand the evolution of the outer disk.
8 CONCLUSIONS AND SUMMARY
In this paper we have measured radial velocities for a number of stars in old, distant open clusters using high resolution spectra. Candidates were selected based on radial velocities and location in color-magnitude diagrams. Using spectrum synthesis of the highest quality data, we conducted a detailed abundance analysis to derive the chemical compositions of Fe, O, Na, Mg, Al, Si, Ca, Ti, Mn, Co, Ni, Rb, Zr, Ba, La, and Eu in stars representing four old open clusters and the nearby cluster M67. These species represent various , Fe-peak, and neutron-capture elements whose synthesis occurs in via different nucleosynthetic processes in different stellar sites. The spectra revealed that Be 21 T406 is a rapidly rotating Li-rich star. This is the second Li-rich star found in this sparse cluster and may be a result of the ingestion of a planetary companion during the ascent of the red giant branch.
We first searched for abundance trends versus age. No strong correlations were found between any abundance and age, a result previously noted. The lack of an age-metallicity relation may be due to the open clusters being members of different stellar populations with different origins and chemical enrichment histories. Next we searched for abundance trends versus Galactocentric radius. We found that certain abundance ratios showed a dependence upon Galactic location. In the outer disk, beyond the apparently “magic” radius of 10 to 12 kpc, the iron abundance reached a constant level of [Fe/H] . This plateau deviates from the linear decrease with increasing Galactocentric radius defined by clusters located in the solar neighborhood. We also found that [O/Fe], [/Fe], and [Eu/Fe] are enhanced relative to solar in the outer disk. The younger Cepheids offer evidence for a plateau in [Fe/H] in the outer disk as well. Our open cluster results are compatible with the radial abundance discontinuity displayed by Cepheids though the magnitude and location of the discontinuity differ between Cepheids and open clusters, no doubt due to the chemical evolution that has occurred since the clusters and the Cepheids formed, a time span of several billion years.
We compared the abundance ratios in the outer disk open clusters to well studied Galactic populations. The abundance ratios [O/Fe] and [/Fe] are enhanced and comparable to the thick disk. Despite some composition similarities, the open clusters are young and probably not members of an older population such as the thick disk. The high abundances of elements indicate rapid star formation such that Type Ia supernovae did not have sufficient time to evolve and contribute to the chemical evolution. Na and Al are overabundant compared to thin disk stars at the same [Fe/H]. Ni and Mn are in good agreement with the thin disk while Co may be slightly enhanced. Be 31 and NGC 2141 show -process enhancements and Be 31 also shows large values of [Eu/Fe].
Consideration of the iron abundances, ages, and kinematics suggest no connection between the outer disk and the halo. Relative abundance ratios of the neutron-capture elements show that the outer disk open clusters have varying ratios of [La/Eu] and [Ba/Eu]. That is, the ratio of -process to -process material differs from cluster to cluster. Further, none of the clusters exhibit a scaled solar pure -process distribution, revealing that AGB stars have contributed to the nucleosynthetic history of the clusters. For the three most metal-poor open clusters (Be 20, Be 29, and Be 31), consideration of the abundance ratio [Rb/Zr] shows that the -process material was likely synthesized in 1-3M⊙ AGB stars. For Be 20, a slightly higher ratio of [Rb/Zr] suggests that a 5M⊙ AGB star may have played a role in the chemical evolution of the proto-cluster gas.
While there are considerable differences in kinematics, ages, and formation histories between the bulge and the outer disk, both display a puzzling pattern within the individual elements. Mg and Ti show enhanced ratios with respect to Fe whereas Si and Ca are in their solar proportions. The origin of the discrepancy is not known. Enhancements in Al, Co, and Eu are also common to the bulge giants and outer disk open clusters. These abundance ratios indicate that the bulge and outer disk may have a common but not shared nucleosynthetic history. Based on low [/Fe] in the current dwarf spheroidals, there does not appear to be any connection between the outer disk and dwarf galaxies, a conclusion that has also been reached for the halo. One cluster, Be 31, has a low [Mn/Fe] ratio, similar to stars of comparable metallicity in the Sagittarius dwarf spheroidal galaxy. In short, while similarities may be found for some abundance ratios, the outer disk open cluster abundance patterns do not perfectly match any existing stellar template. They appear to signify an unusual chemical evolutionary process or processes.
We note that we could only observe one or two stars per cluster. It is necessary to confirm our results by studying additional stars in these clusters, particularly those that show unusual abundance ratios. Future studies of a range of elements in large numbers of open clusters analyzed in a uniform and homogeneous manner are required to advance our knowledge of the evolution of the Galactic disk.
A chemical evolution model by Chiappini et al. (2001) accurately predicts the plateau of [Fe/H] = 0.5 beyond 12 kpc as well as enhanced [/Fe] and [Eu/Fe] in the outer disk. According to the model, the outer disk forms from gas left-over from the halo. However, such a notion does not seem plausible based on angular momentum arguments. The basic idea of the outer disk forming from material with a different nucleosynthetic history or histories appears to a requirement.
Some evidence suggests that a significant merger event is currently taking place in the outer disk. That the outer disk open cluster abundance patterns do not match any Galactic population allows the possibility that the open clusters may be associated with one or more merger events. If the open clusters were originally members of a single victim galaxy, then the [/Fe] is unlike any current dwarf galaxy. Perhaps the outer disk open clusters were instead created from the merger event. If so, then the current ages of the open clusters would be a measure of when the event took place. The star formation resulting from the merger would then have had to have been sufficiently rapid to drive the metallicity to [Fe/H] = 0.5 without allowing Type Ia supernovae to contribute, though AGB stars must have contaminated the proto-cluster gas. A merger event would mean that the open clusters represent different stellar populations and therefore should not present a clear age-metallicity relation. An alternative explanation is that the outer Galactic disk has literally grown steadily, if episodically, due to infall of metal-poor gas and small galaxies with the Canis Major galaxy being only the latest addition. If such infall triggered star formation for a relatively brief time, we could, perhaps, explain the enhanced [/Fe] ratios, as well as the lack of a metallicity gradient. Of great interest is the identification and abundance analysis of additional open clusters residing in the outer disk to test the merger hypothesis. Can younger and older outer disk open clusters be identified and if so, what are their compositions?
| Cluster | R. A.aaJ2000.0 | Dec.aaJ2000.0 | [Fe/H] | MAIbbTaken from Salaris et al. (2004), in Gyrs. | dccDistance in kpc from Janes & Phelps (1994) | dddDistance estimate obtained using red clump stars (this paper) | Ref | |||
|---|---|---|---|---|---|---|---|---|---|---|
| Berkeley 20 | 05:32:36 | +00:11:24 | 203.51 | 2.1 | 4.1 | 8.1 | 8.6 | 1 | ||
| Berkeley 21 | 05:51:45 | +21:48:20 | 186.84 | 1.6 | 2.2 | 5.8 | 6.1 | 2 | ||
| NGC 2141 | 06:03:00 | +10:29:40 | 198.08 | 1.6 | 2.5 | 4.3 | 3.9 | 3 | ||
| Berkeley 29 | 06:53:02 | +16:56:20 | 197.95 | +7.98 | 2.1 | 4.3 | 8.6 | 14.8 | 4 | |
| Berkeley 31 | 06:57:38 | +08:17:19 | 206.25 | +5.12 | 2.3 | 5.3 | 3.7 | 5 | ||
| M67 | 08:51:18 | +11:50:00 | 215.66 | +31.91 | 2.3 | 4.3 | 0.8 | 0.8 | 6 |
| Star | R. A.aaJ2000.0 | DecaaJ2000.0 | bbValues with errors greater than 0.05 mag are indicated with a colon. | bbValues with errors greater than 0.05 mag are indicated with a colon. | |||
|---|---|---|---|---|---|---|---|
| Berkeley 20 | |||||||
| 5 | 05:32:37.8 | 00:11:09 | 14.80 | 1.49 | 11.35 | 0.91 | |
| 8 | 05:32:38.8 | 00:11:21 | 15.15 | 1.43 | 11.85 | 0.88 | |
| 22 | 05:32:36.8 | 00:11:50 | 16.90 | 1.18 | 14.31: | 0.50: | |
| 28 | 05:32:38.1 | 00:11:17 | 17.11 | 1.16 | 14.21: | 0.73: | |
| Berkeley 21 | |||||||
| 39 | 05:51:38.4 | 21:47:21 | 15.67 | 1.77 | 2.11 | 10.80 | 1.10 |
| 51 | 05:51:42.0 | 21:48:04 | 15.69 | 1.70 | 2.06 | 10.96 | 1.10 |
| 67 | 05:51:44.8 | 21:48:52 | 14.99 | 1.95 | 2.29 | 9.69 | 1.26 |
| 88 | 05:51:49.4 | 21:47:00 | 15.82 | 1.73 | 2.09 | 11.00 | 1.09 |
| NGC 2141 | |||||||
| 1007 | 06:02:50.8 | 10:30:28 | 13.27 | 1.85 | 8.98 | 1.08 | |
| 1286 | 06:02:56.3 | 10:29:05 | 14.81 | 1.49 | 11.31 | 0.81 | |
| 2066 | 06:02:58.4 | 10:26:38 | 14.18 | 1.62 | 10.33 | 0.93 | |
| 514 | 06:03:00.0 | 10:32:24 | 14.09 | 1.61 | 10.33 | 0.93 | |
| 1997ccThese two stars are blended in the 2MASS results. | 06:03:00.3 | 10:28:45 | 14.96 | 1.53 | 11.63: | 0.80: | |
| 1333ccThese two stars are blended in the 2MASS results. | 06:03:00.3 | 10:28:44 | 15.09 | 1.47 | 11.63: | 0.80: | |
| 1348 | 06:03:01.6 | 10:28:34 | 13.25 | 1.94 | 8.86 | 1.07 | |
| 1821 | 06:03:07.6 | 10:26:48 | 14.13 | 1.61 | 10.32 | 0.93 | |
| Berkeley 29 | |||||||
| 412 | 06:53:01.6 | 16:56:22 | 16.64 | 0.98 | 1.07 | 14.27 | 0.56: |
| 1032 | 06:53:03.4 | 16:55:09 | 16.56 | 0.97 | 1.05 | 14.17: | 0.61: |
| 988 | 06:53:03.9 | 16:55:16 | 14.59 | 1.56 | 1.59 | 10.90 | 0.98 |
| 673 | 06:53:04.1 | 16:55:56 | 14.38 | 1.67 | 1.81 | 10.27 | 1.07 |
| 556 | 06:53:04.3 | 16:56:03 | 16.60 | 0.98 | 1.07 | 14.14: | 0.60: |
| 241 | 06:53:07.1 | 16:57:13 | 14.48 | 1.61 | 1.69 | 10.60 | 1.02 |
| 801 | 06:53:08.1 | 16:55:41 | 16.58 | 0.96 | 1.06 | 14.23: | 0.60: |
| Berkeley 31dd and data are from Guetter (1993), and the values are from Phelps et al. (1994). | |||||||
| 1065 | 06:57:34.7 | 08:15:42 | 16.28 | 0.93 | 1.10 | 14.30: | 0.56: |
| 886 | 06:57:37.4 | 08:15:59 | 14.67 | 1.33 | 1.30 | 11.68 | 0.78 |
| 720 | 06:57:39.6 | 08:15:24 | 16.32 | 1.08 | 1.19 | 13.65 | 0.77: |
| 728 | 06:57:39.6 | 08:16:22 | 16.52 | 0.98 | 1.14 | 14.01: | 0.62: |
| 666 | 06:57:41.0 | 08:17:20 | 13.84 | 1.35 | 1.33 | 11.66:eeThe stellar image is elongated. | 0.78: |
| M 67 | |||||||
| 105 | 08:51:17.1 | 11:48:16 | 10.30 | 1.26 | 1.23 | 7.39 | 0.76 |
| 108 | 08:51:17.5 | 11:45:22 | 9.72 | 1.37 | 1.36 | 6.49 | 0.83 |
| 141 | 08:51:22.8 | 11:48:03 | 10.48 | 1.11 | 1.08 | 7.94 | 0.62 |
| Star | R. A.aaJ2000.0 | DecaaJ2000.0 | Sp. Type | VradbbRadial velocities are taken the Astronomical Almanac 1999, except for BD+6 648, whose value was taken from Carney & Latham (1986). | |
|---|---|---|---|---|---|
| HD 26162 | 04:09:10.0 | +19:36:33 | 5.5 | K1 III | |
| BD+6 648 | 04:13:11.9 | +06:35:51 | 9.1 | K0 III | |
| HD 80170 | 09:16:57.1 | :24:05 | 5.3 | K5 III-IV | |
| HD 90861 | 10:29:53.7 | +28:34:52 | 7.2 | K2 III |
| StaraaAn asterisk designates stars we believe to be cluster members. | V | Exp. Time | HJD | S/N | Vrad (km s-1)bbRadial velocity error refers to the standard deviation. | No. Ap. |
|---|---|---|---|---|---|---|
| Berkeley 20 | ||||||
| 5* | 14.80 | 1x600 s | 0762.7637 | 10 | 10 | |
| 5* | 4x60 m | 0831.6946 | 74 | 30 | ||
| 8* | 15.15 | 1x900 s | 0762.7803 | 18 | 10 | |
| 8* | 4x60 m | 0832.6566 | 56 | 23 | ||
| 22* | 16.90 | 1x2400 s | 0762.8159 | 12 | 8 | |
| 28* | 17.11 | 1x2400 s | 0762.8515 | 11 | 9 | |
| Berkeley 21 | ||||||
| 39* | 15.67 | 1x900 s | 1184.6872 | 18 | 27 | |
| 51* | 15.69 | 1x900 s | 1184.6709 | 9 | 27 | |
| 67* | 14.99 | 1x600 s | 1184.7200 | 13 | 27 | |
| 67* | 4x60 m | 1185.8721 | 101 | 37 | ||
| 88* | 15.82 | 1x900 s | 1184.7030 | 17 | 27 | |
| NGC 2141 | ||||||
| 1007* | 13.27 | 1x150 s | 1186.8603 | 25 | 36 | |
| 1286* | 14.81 | 1x600 s | 1186.8466 | 20 | 32 | |
| 2066* | 14.18 | 1x400 s | 1186.8124 | 23 | 35 | |
| 514* | 14.09 | 1x300 s | 1186.8692 | 20 | 34 | |
| 1997 | 14.96 | 1x900 s | 1186.8029 | 23 | 21 | |
| 1333* | 15.09 | 1x700 s | 1186.8258 | 20 | 30 | |
| 1348* | 13.25 | 1x200 s | 1186.8506 | 25 | 37 | |
| 1348* | 4x40 m | 1205.6854 | 130 | 26 | ||
| 1821* | 14.13 | 1x300 s | 1186.8774 | 19 | 34 | |
| Berkeley 29 | ||||||
| 412* | 16.64 | 3x2400 s | 0809.9655 | 14 | 24 | |
| 1032* | 16.56 | 1x3600 s | 0811.8746 | 7 | 4 | |
| 988* | 14.59 | 1x600 s | 0811.9174 | 9 | 5 | |
| 988* | 5x60 m | 1185.9525ccThe spectra were taken over a period of three nights. The HJD refers to the mid-exposure of all five observations. | 107 | 34 | ||
| 673* | 14.38 | 1x600 s | 0811.9777 | 12 | 5 | |
| 673* | 4x60 m | 1183.8724 | 115 | 43 | ||
| 556* | 16.60 | 1x3600 s | 0811.9645 | 10 | 3 | |
| 241* | 14.48 | 1x1800 s | 0811.9055 | 21 | 5 | |
| 801* | 16.58 | 2x3000 s | 0810.8871 | 8 | 11 | |
| Berkeley 31 | ||||||
| 1065 | 16.32 | 1x2400 s | 1204.7858 | 12 | 27 | |
| 886* | 14.77 | 1x600 s | 1205.7676 | 10 | 29 | |
| 886* | 4x60 m | 1206.7021 | 60 | 23 | ||
| 720 | 16.42 | 1x2400 s | 1204.7479 | 12 | 27 | |
| 728* | 16.61 | 1x3600 s | 1205.7524 | 13 | 25 | |
| 666 | 13.95 | 1x400 s | 1205.7817 | 13 | 22 | |
| M 67 | ||||||
| 105* | 10.30 | 1x30 m | 1187.0231 | 224 | 44 | |
| 108* | 9.72 | 1x20 m | 1187.0433 | 197 | 44 | |
| 141* | 10.48 | 1x30 m | 1186.9982 | 209 | 44 | |
| Cluster | (mean) | aaFollowing Frinchaboy et al. (2004), is the Galactocentric radial velocity assuming a solar apex = (18h,30) at 20 km s-1and 220 km s-1rotational velocity for the local standard of rest. | No. Stars | ||||
|---|---|---|---|---|---|---|---|
| Berkeley 20 | +78.9 | 0.7 | 1.4 | +61.7 | 203.51 | 4 | |
| Berkeley 21 | 1.4 | 2.9 | 186.84 | 4 | |||
| NGC 2141 | +24.1 | 0.3 | 0.7 | +8.9 | 198.08 | 8 | |
| Berkeley 29 | +24.7 | 0.2 | 0.5 | +11.5 | 197.95 | +7.98 | 7 |
| Berkeley 31 | +55.7 | 0.7 | 1.0 | +40.5 | 206.25 | +5.12 | 2 |
| Cluster | No. Stars | E() | E() | ()0 | d (kpc) | |||
|---|---|---|---|---|---|---|---|---|
| Berkeley 20 | 3 | 13.18 | 0.70 | 0.21: | 0.38: | 14.66: | 8.6: | 16.0 |
| Berkeley 21 | 10 | 12.62 | 0.93 | 0.50 | 0.91 | 13.92 | 6.1 | 14.1 |
| NGC 2141 | 10 | 11.51 | 0.79 | 0.24 | 0.44 | 12.97 | 3.9 | 11.8 |
| Berkeley 29 | 5 | 14.20 | 0.59 | 0.02 | 0.04 | 15.85 | 14.8 | 22.5 |
| Berkeley 31aaThese values are derived from the work of Guetter (1993) | 0.13 | 13.6 | 5.3 | 12.9 | ||||
| M67 | 3 | 7.96 | 0.615 | 0.015 | 0.03 | 9.56 | 0.8 | 8.6 |
| Star | [Fe/H]aaFrom Janes & Phelps (1994). | bbEstimates obtained using the reddening and distance estimates from Table 6 and the photometry from Table 2. | log bbEstimates obtained using the reddening and distance estimates from Table 6 and the photometry from Table 2. | ccQuantities derived using the spectroscopic methods described in the text. | log ccQuantities derived using the spectroscopic methods described in the text. | ccQuantities derived using the spectroscopic methods described in the text. | [Fe/H]ccQuantities derived using the spectroscopic methods described in the text. | ddRe-derived values from photometry using the spectroscopic metallicities. | log ddRe-derived values from photometry using the spectroscopic metallicities. |
|---|---|---|---|---|---|---|---|---|---|
| Berkeley 20 | |||||||||
| 5 | 4610 | 1.6 | 4500 | 1.8 | 1.58 | 4620 | 1.6 | ||
| 8 | 4750 | 1.8 | 4590 | 2.2 | 1.42 | 4760 | 1.8 | ||
| Berkeley 21 | |||||||||
| 67 | 4310 | 1.1 | [] | 4180 | 1.1 | ||||
| NGC 2141 | |||||||||
| 1348 | 4100 | 1.2 | 4100 | 1.2 | 1.33 | 4090 | 1.2 | ||
| Berkeley 29 | |||||||||
| 988 | 3900 | 0.9 | 3980 | 1.0 | 1.31 | 4090 | 0.9 | ||
| 673 | 3750 | 0.6 | 3830 | 0.6 | 1.30 | 3890 | 0.6 | ||
| Berkeley 31eeThe photometric temperatures and gravities were derived using reddening and distance determinations from Guetter (1993). | |||||||||
| 886 | 4390 | 2.2 | 4490 | 1.9 | 1.22 | 4400 | 2.2 | ||
| M 67 | |||||||||
| 105 | +0.05 | 4390 | 2.1 | 4390 | 2.1 | 1.18 | +0.06 | 4340 | 2.1 |
| 108 | +0.05 | 4180 | 1.7 | 4200 | 1.6 | 1.38 | 4140 | 1.7 | |
| 141 | +0.05 | 4700 | 2.3 | 4700 | 2.3 | 1.34 | 0.00 | 4640 | 2.3 |
| Wavelength(Å) | Species | LEP(eV) | log | Wavelength(Å) | Species | LEP(eV) | log | Wavelength(Å) | Species | LEP(eV) | log | ||
|---|---|---|---|---|---|---|---|---|---|---|---|---|---|
| 6300.30 | O I | 0.00 | 9.717 | 5837.70 | Fe I | 4.29 | 2.340 | 6750.15 | Fe I | 2.42 | 2.621 | ||
| 6363.78 | O I | 0.02 | 10.185 | 5853.16 | Fe I | 1.49 | 5.280 | 6756.56 | Fe I | 4.29 | 2.750 | ||
| 5688.19 | Na I | 2.11 | 0.420 | 5855.09 | Fe I | 4.60 | 1.547 | 6786.86 | Fe I | 4.19 | 1.850 | ||
| 6154.23 | Na I | 2.10 | 1.530 | 5856.10 | Fe I | 4.29 | 1.640 | 6810.26 | Fe I | 4.60 | 1.000 | ||
| 6160.75 | Na I | 2.10 | 1.230 | 5858.79 | Fe I | 4.22 | 2.260 | 6971.93 | Fe I | 3.02 | 3.390 | ||
| 6318.72 | Mg I | 5.11 | 1.970 | 5909.97 | Fe I | 3.21 | 2.640 | 7112.17 | Fe I | 2.99 | 3.044 | ||
| 6319.24 | Mg I | 5.11 | 2.220 | 5916.25 | Fe I | 2.45 | 2.994 | 7189.15 | Fe I | 3.07 | 2.796 | ||
| 6965.41 | Mg I | 5.75 | 1.510 | 5927.80 | Fe I | 4.65 | 1.090 | 7223.66 | Fe I | 3.01 | 2.269 | ||
| 7387.69 | Mg I | 5.75 | 0.870 | 5933.80 | Fe I | 4.64 | 2.230 | 7401.69 | Fe I | 4.18 | 1.660 | ||
| 6696.02 | Al I | 3.14 | 1.340 | 5956.69 | Fe I | 0.86 | 4.608 | 7710.36 | Fe I | 4.22 | 1.129 | ||
| 6698.67 | Al I | 3.14 | 1.640 | 5969.58 | Fe I | 4.28 | 2.730 | 7723.20 | Fe I | 2.28 | 3.617 | ||
| 7835.31 | Al I | 4.02 | 0.470 | 6012.21 | Fe I | 2.22 | 4.070 | 7941.09 | Fe I | 3.27 | 2.331 | ||
| 7836.13 | Al I | 4.02 | 0.310 | 6019.36 | Fe I | 3.57 | 3.360 | 4993.36 | Fe II | 2.80 | 3.480 | ||
| 5690.43 | Si I | 4.93 | 1.751 | 6027.05 | Fe I | 4.07 | 1.106 | 5234.62 | Fe II | 3.22 | 2.150 | ||
| 5793.07 | Si I | 4.93 | 1.843 | 6054.08 | Fe I | 4.37 | 2.310 | 5325.55 | Fe II | 3.22 | 3.220 | ||
| 6125.02 | Si I | 5.61 | 1.506 | 6105.13 | Fe I | 4.55 | 2.050 | 5414.07 | Fe II | 3.22 | 3.750 | ||
| 6145.01 | Si I | 5.62 | 1.362 | 6120.24 | Fe I | 0.91 | 5.970 | 5425.26 | Fe II | 3.20 | 3.370 | ||
| 6155.13 | Si I | 5.62 | 0.786 | 6145.42 | Fe I | 3.37 | 3.600 | 5991.38 | Fe II | 3.15 | 3.557 | ||
| 6166.44 | Ca I | 2.52 | 1.142 | 6151.62 | Fe I | 2.17 | 3.299 | 6084.11 | Fe II | 3.20 | 3.808 | ||
| 6169.04 | Ca I | 2.52 | 0.797 | 6157.73 | Fe I | 4.08 | 1.320 | 6149.26 | Fe II | 3.89 | 2.724 | ||
| 6169.56 | Ca I | 2.53 | 0.478 | 6159.38 | Fe I | 4.61 | 1.970 | 6247.56 | Fe II | 3.89 | 2.329 | ||
| 6455.60 | Ca I | 2.52 | 1.290 | 6165.36 | Fe I | 4.14 | 1.490 | 6369.46 | Fe II | 2.89 | 4.250 | ||
| 6064.63 | Ti I | 1.05 | 1.888 | 6173.34 | Fe I | 2.22 | 2.880 | 6416.92 | Fe II | 3.89 | 2.740 | ||
| 6091.17 | Ti I | 2.27 | 0.367 | 6180.20 | Fe I | 2.73 | 2.637 | 6432.68 | Fe II | 2.89 | 3.708 | ||
| 6312.24 | Ti I | 1.46 | 1.496 | 6200.31 | Fe I | 2.61 | 2.437 | 6456.38 | Fe II | 3.90 | 2.075 | ||
| 6336.10 | Ti I | 1.44 | 1.687 | 6219.28 | Fe I | 2.20 | 2.433 | 7224.49 | Fe II | 3.89 | 3.243 | ||
| 6013.53 | Mn I | 3.07 | 0.251 | 6229.23 | Fe I | 2.84 | 2.846 | 7711.72 | Fe II | 3.90 | 2.543 | ||
| 6016.67 | Mn I | 3.08 | 0.100 | 6232.64 | Fe I | 3.65 | 1.283 | 6189.00 | Co I | 1.71 | 2.450 | ||
| 6021.80 | Mn I | 3.08 | 0.034 | 6246.32 | Fe I | 3.60 | 0.894 | 6455.03 | Co I | 3.63 | 0.250 | ||
| 4802.88 | Fe I | 3.69 | 1.531 | 6265.13 | Fe I | 2.17 | 2.550 | 6632.45 | Co I | 2.28 | 2.000 | ||
| 5044.21 | Fe I | 2.85 | 2.034 | 6270.22 | Fe I | 2.86 | 2.500 | 5846.99 | Ni I | 1.68 | 3.210 | ||
| 5054.64 | Fe I | 3.64 | 1.938 | 6271.28 | Fe I | 3.33 | 2.728 | 6086.28 | Ni I | 4.26 | 0.515 | ||
| 5242.49 | Fe I | 3.63 | 0.980 | 6297.79 | Fe I | 2.22 | 2.740 | 6175.37 | Ni I | 4.09 | 0.535 | ||
| 5321.11 | Fe I | 4.43 | 1.106 | 6301.50 | Fe I | 3.65 | 0.766 | 6177.24 | Ni I | 1.83 | 3.510 | ||
| 5322.04 | Fe I | 2.28 | 2.840 | 6322.69 | Fe I | 2.59 | 2.426 | 6204.60 | Ni I | 4.09 | 1.140 | ||
| 5326.14 | Fe I | 3.57 | 2.130 | 6336.82 | Fe I | 3.68 | 0.916 | 6635.12 | Ni I | 4.42 | 0.828 | ||
| 5365.40 | Fe I | 3.57 | 1.040 | 6353.84 | Fe I | 0.91 | 6.477 | 6772.32 | Ni I | 3.66 | 0.987 | ||
| 5367.48 | Fe I | 4.41 | 0.430 | 6355.03 | Fe I | 2.84 | 2.403 | 7800.29 | Rb I | 0.00 | 0.130 | ||
| 5379.57 | Fe I | 3.69 | 1.530 | 6411.65 | Fe I | 3.65 | 0.734 | 6127.44 | Zr I | 0.15 | 1.060 | ||
| 5491.84 | Fe I | 4.18 | 2.250 | 6469.19 | Fe I | 4.84 | 0.770 | 6134.55 | Zr I | 0.00 | 1.280 | ||
| 5618.63 | Fe I | 4.21 | 1.292 | 6574.23 | Fe I | 0.99 | 5.004 | 6143.20 | Zr I | 0.07 | 1.100 | ||
| 5701.55 | Fe I | 2.56 | 2.216 | 6575.02 | Fe I | 2.59 | 2.727 | 5853.64 | Ba II | 0.60 | 1.010 | ||
| 5705.47 | Fe I | 4.30 | 1.420 | 6581.21 | Fe I | 1.50 | 4.705 | 5805.77 | La II | 0.13 | 1.560 | ||
| 5741.85 | Fe I | 4.25 | 1.689 | 6609.11 | Fe I | 2.56 | 2.692 | 6390.48 | La II | 0.32 | 1.410 | ||
| 5775.08 | Fe I | 4.22 | 1.310 | 6648.08 | Fe I | 1.01 | 5.918 | 6645.11 | Eu II | 1.38 | 0.204 | ||
| 5778.45 | Fe I | 2.59 | 3.480 | 6699.16 | Fe I | 4.59 | 2.170 | ||||||
| 5811.92 | Fe I | 4.14 | 2.430 | 6739.52 | Fe I | 1.56 | 4.820 |
| log (X) | Grevesse & Sauval (1998) | This study | N | |
|---|---|---|---|---|
| O | 8.83 | 8.86 | 1 | |
| Na | 6.33 | 6.28 | 0.05 | 3 |
| Mg | 7.58 | 7.49 | 0.01 | 2 |
| Al | 6.47 | 6.27 | 0.06 | 4 |
| SiaaFor Si we used an inverted solar analysis to derive the values. | 7.55 | 7.55 | 0.00 | 5 |
| Ca | 6.36 | 6.43 | 0.10 | 4 |
| Ti | 5.02 | 4.92 | 0.03 | 4 |
| Mn | 5.39 | 5.42 | 0.09 | 3 |
| Fe I | 7.50 | 7.54 | 0.09 | 57 |
| Fe II | 7.50 | 7.54 | 0.09 | 15 |
| Co | 4.92 | 4.91 | 0.08 | 3 |
| Ni | 6.25 | 6.30 | 0.13 | 7 |
| Rb | 2.60 | 2.58 | 1 | |
| Zr | 2.60 | 2.80 | 0.09 | 3 |
| Ba | 2.13 | 2.50 | 1 | |
| LabbFor La we adopted 1.13 (Lawler et al., 2001a) and for Eu we adopted 0.52 (Lawler et al., 2001b) | 1.17 | 1.13 | ||
| EubbFor La we adopted 1.13 (Lawler et al., 2001a) and for Eu we adopted 0.52 (Lawler et al., 2001b) | 0.51 | 0.52 |
| Species | Peterson et al. (1993) | Carraro et al. (2004) | This study | N | |
|---|---|---|---|---|---|
| [O/Fe] | 0.40 | 0.39 | 0.30 | 0.02 | 2 |
| [Na/Fe] | 0.30 | 0.24 | 0.15 | 0.08 | 3 |
| [Mg/Fe] | 0.40 | 0.46 | 0.45 | 0.14 | 4 |
| [Al/Fe] | 0.40 | 0.27 | 0.28 | 0.08 | 4 |
| [Si/Fe] | 0.40 | 0.25 | 0.35 | 0.06 | 5 |
| [Ca/Fe] | 0.30 | 0.32 | 0.22 | 0.09 | 4 |
| [Ti/Fe] | 0.30 | 0.22 | 0.26 | 0.03 | 4 |
| [Mn/Fe] | 0.25 | 0.06 | 3 | ||
| [Fe I/H] | 0.50 | 0.51 | 0.56 | 0.13 | 50 |
| [Fe II/H] | 0.50 | 0.51 | 0.59 | 0.12 | 12 |
| [Co/Fe] | 0.12 | 0.08 | 3 | ||
| [Ni/Fe] | 0.00 | 0.16 | 0.02 | 0.06 | 7 |
| [Rb/Fe] | 0.08 | 1 | |||
| [Zr/Fe] | 0.27 | 0.08 | 3 | ||
| [Ba/Fe] | 0.09 | 1 | |||
| [La/Fe] | 0.03 | 0.09 | 2 | ||
| [Eu/Fe] | 0.29 | 1 |
| Species | Abundance | N | Abundance | N | Abundance | N | |||||
|---|---|---|---|---|---|---|---|---|---|---|---|
| Be 20 5 | Be 20 8 | Be 29 673 | |||||||||
| [O/Fe] | 0.19 | 0.05 | 2 | 0.17 | 1 | 0.20 | 0.04 | 2 | |||
| [Na/Fe] | 0.32 | 0.08 | 3 | 0.10 | 0.07 | 2 | 0.37 | 0.19 | 3 | ||
| [Mg/Fe] | 0.26 | 0.19 | 4 | 0.22 | 0.09 | 4 | 0.31 | 0.05 | 4 | ||
| [Al/Fe] | 0.18 | 0.13 | 4 | 0.18 | 0.06 | 4 | 0.25 | 0.06 | 4 | ||
| [Si/Fe] | 0.08 | 0.05 | 5 | 0.03 | 0.06 | 4 | 0.20 | 0.06 | 4 | ||
| [Ca/Fe] | 0.08 | 0.04 | 4 | 0.06 | 0.05 | 4 | 0.04 | 0.04 | 4 | ||
| [Ti/Fe] | 0.45 | 0.11 | 4 | 0.33 | 0.09 | 4 | 0.37 | 0.06 | 4 | ||
| [Mn/Fe] | 0.07 | 0.04 | 2 | 0.16 | 0.05 | 2 | 0.27 | 0.19 | 2 | ||
| [Fe I/H] | 0.49 | 0.21 | 37 | 0.40 | 0.17 | 43 | 0.52 | 0.15 | 24 | ||
| [Fe II/H] | 0.57 | 0.09 | 5 | 0.49 | 0.17 | 5 | 0.52 | 0.21 | 6 | ||
| [Co/Fe] | 0.20 | 0.08 | 3 | 0.15 | 0.04 | 4 | 0.08 | 1 | |||
| [Ni/Fe] | 0.00 | 0.11 | 7 | 0.04 | 0.13 | 7 | 0.04 | 0.10 | 7 | ||
| [Rb/Fe] | 0.11 | 1 | 0.16 | 1 | |||||||
| [Zr/Fe] | 0.08 | 0.06 | 3 | 0.02 | 0.10 | 2 | 0.08 | 0.15 | 2 | ||
| [Ba/Fe] | 0.10 | 1 | 0.17 | 1 | 0.32 | 1 | |||||
| [La/Fe] | 0.28 | 0.02 | 2 | 0.32 | 0.04 | 2 | 0.16 | 0.07 | 2 | ||
| [Eu/Fe] | 0.33 | 1 | 0.29 | 1 | 0.11 | 1 | |||||
| Be 29 988 | Be 31 886 | NGC 2141 1348 | |||||||||
| [O/Fe] | 0.26 | 0.05 | 2 | 0.24 | 0.08 | 2 | 0.00 | 0.06 | 2 | ||
| [Na/Fe] | 0.36 | 0.27 | 3 | 0.27 | 0.10 | 3 | 0.41 | 0.04 | 3 | ||
| [Mg/Fe] | 0.37 | 0.13 | 4 | 0.40 | 0.10 | 4 | 0.24 | 0.14 | 4 | ||
| [Al/Fe] | 0.27 | 0.09 | 4 | 0.22 | 0.13 | 4 | 0.18 | 0.07 | 4 | ||
| [Si/Fe] | 0.16 | 0.10 | 3 | 0.20 | 0.14 | 5 | 0.05 | 0.19 | 4 | ||
| [Ca/Fe] | 0.00 | 0.04 | 4 | 0.13 | 0.05 | 4 | 0.10 | 0.04 | 4 | ||
| [Ti/Fe] | 0.29 | 0.10 | 4 | 0.08 | 0.09 | 4 | 0.24 | 0.11 | 4 | ||
| [Mn/Fe] | 0.19 | 0.06 | 3 | 0.54 | 0.12 | 3 | 0.20 | 0.12 | 3 | ||
| [Fe I/H] | 0.56 | 0.19 | 25 | 0.57 | 0.23 | 35 | 0.18 | 0.15 | 23 | ||
| [Fe II/H] | 0.55 | 0.17 | 8 | 0.49 | 0.18 | 7 | 0.10 | 0.27 | 4 | ||
| [Co/Fe] | 0.09 | 0.03 | 2 | 0.25 | 0.08 | 2 | 0.04 | 0.04 | 2 | ||
| [Ni/Fe] | 0.00 | 0.09 | 7 | 0.11 | 0.12 | 7 | 0.04 | 0.11 | 7 | ||
| [Rb/Fe] | 0.07 | 1 | 0.11 | 1 | 0.20 | 1 | |||||
| [Zr/Fe] | 0.06 | 0.13 | 3 | 0.35 | 0.07 | 3 | 0.63 | 0.06 | 2 | ||
| [Ba/Fe] | 0.29 | 1 | 0.64 | 1 | 0.91 | 1 | |||||
| [La/Fe] | 0.30 | 0.02 | 2 | 0.91 | 0.07 | 2 | 0.57 | 0.07 | 2 | ||
| [Eu/Fe] | 0.20 | 1 | 0.56 | 1 | 0.17 | 1 | |||||
| M 67 105 | M 67 108 | M 67 141 | |||||||||
| [O/Fe] | 0.05 | 0.07 | 2 | 0.08 | 0.04 | 2 | 0.10 | 0.06 | 2 | ||
| [Na/Fe] | 0.29 | 0.10 | 3 | 0.38 | 0.08 | 3 | 0.24 | 0.10 | 3 | ||
| [Mg/Fe] | 0.15 | 0.06 | 4 | 0.15 | 0.13 | 4 | 0.18 | 0.04 | 4 | ||
| [Al/Fe] | 0.17 | 0.05 | 4 | 0.18 | 0.04 | 4 | 0.16 | 0.06 | 4 | ||
| [Si/Fe] | 0.08 | 0.11 | 5 | 0.09 | 0.13 | 5 | 0.11 | 0.08 | 5 | ||
| [Ca/Fe] | 0.08 | 0.05 | 4 | 0.03 | 0.03 | 4 | 0.09 | 0.03 | 4 | ||
| [Ti/Fe] | 0.17 | 0.04 | 4 | 0.13 | 0.03 | 4 | 0.05 | 0.05 | 4 | ||
| [Mn/Fe] | 0.08 | 0.04 | 3 | 0.12 | 0.12 | 3 | 0.20 | 0.03 | 3 | ||
| [Fe I/H] | 0.03 | 0.15 | 30 | 0.05 | 0.15 | 27 | 0.01 | 0.12 | 37 | ||
| [Fe II/H] | 0.09 | 0.12 | 6 | 0.03 | 0.12 | 5 | 0.01 | 0.09 | 8 | ||
| [Co/Fe] | 0.02 | 0.11 | 3 | 0.03 | 0.14 | 3 | 0.01 | 0.09 | 3 | ||
| [Ni/Fe] | 0.11 | 0.11 | 7 | 0.07 | 0.06 | 7 | 0.06 | 0.09 | 7 | ||
| [Rb/Fe] | 0.31 | 1 | 0.28 | 1 | 0.22 | 1 | |||||
| [Zr/Fe] | 0.32 | 0.03 | 3 | 0.27 | 0.05 | 3 | 0.26 | 0.04 | 3 | ||
| [Ba/Fe] | 0.05 | 1 | 0.04 | 1 | 0.02 | 1 | |||||
| [La/Fe] | 0.11 | 0.02 | 2 | 0.09 | 0.07 | 2 | 0.13 | 0.04 | 2 | ||
| [Eu/Fe] | 0.04 | 1 | 0.09 | 1 | 0.05 | 1 | |||||
| Species | + 100K | log + 0.2 | + 0.2 |
|---|---|---|---|
| [O/Fe] | 0.02 | 0.00 | 0.05 |
| [Na/Fe] | 0.11 | 0.07 | 0.02 |
| [Mg/Fe] | 0.06 | 0.07 | 0.01 |
| [Al/Fe] | 0.10 | 0.06 | 0.02 |
| [Si/Fe] | 0.02 | 0.02 | 0.03 |
| [Ca/Fe] | 0.13 | 0.06 | 0.04 |
| [Ti/Fe] | 0.18 | 0.06 | 0.03 |
| [Mn/Fe] | 0.11 | 0.05 | 0.03 |
| [Fe I/H] | 0.07 | 0.02 | 0.09 |
| [Fe II/H] | 0.11 | 0.11 | 0.03 |
| [Co/Fe] | 0.11 | 0.02 | 0.05 |
| [Ni/Fe] | 0.05 | 0.02 | 0.01 |
| [Rb/Fe] | 0.14 | 0.07 | 0.06 |
| [Zr/Fe] | 0.24 | 0.05 | 0.03 |
| [Ba/Fe] | 0.05 | 0.07 | 0.20 |
| [La/Fe] | 0.04 | 0.02 | 0.03 |
| [Eu/Fe] | 0.01 | 0.03 | 0.03 |
| Species | Tautvaišiene et al. (2000) | This study | N | |
|---|---|---|---|---|
| [O/Fe] | 0.02 | 0.07 | 0.05 | 6 |
| [Na/Fe] | 0.19 | 0.30 | 0.10 | 9 |
| [Mg/Fe] | 0.09 | 0.16 | 0.08 | 12 |
| [Al/Fe] | 0.14 | 0.17 | 0.05 | 12 |
| [Si/Fe] | 0.10 | 0.09 | 0.11 | 15 |
| [Ca/Fe] | 0.04 | 0.07 | 0.06 | 12 |
| [Ti/Fe] | 0.04 | 0.12 | 0.07 | 12 |
| [Fe/H] | 0.03 | 0.02 | 0.14 | 113 |
| [Ni/Fe] | 0.04 | 0.08 | 0.10 | 21 |
| [Zr/Fe] | 0.17 | 0.28 | 0.04 | 9 |
| [Ba/Fe] | 0.04 | 0.02 | 0.05 | 3 |
| [La/Fe] | 0.13 | 0.11 | 0.06 | 6 |
| [Eu/Fe] | 0.07 | 0.06 | 0.02 | 3 |
References
- Alibés et al. (2001) Alibés, A., Labay, J., & Canal, R. 2001, A&A submitted (astro-ph/0107016)
- Alonso et al. (1994) Alonso, A., Arribas, S., & Martinez-Roger, C. 1994, A&AS, 107, 365
- Alonso et al. (1999) Alonso, A., Arribas, S., & Martínez-Roger, C. 1999, A&AS, 140, 261
- Alves (2000) Alves, D. R. 2000, ApJ, 539, 732
- Andrievsky et al. (2002a) Andrievsky, S. M., Bersier, D., Kovtyukh, V. V., Luck, R. E., Maciel, W. J., Lépine, J. R. D., & Beletsky, Y. V. 2002a, A&A, 384, 140
- Andrievsky et al. (2002b) Andrievsky, S. M., Kovtyukh, V. V., Luck, R. E., Lépine, J. R. D., Bersier, D., Maciel, W. J., Barbuy, B., Klochkova, V. G., Panchuk, V. E., & Karpischek, R. U. 2002b, A&A, 381, 32
- Andrievsky et al. (2002c) Andrievsky, S. M., Kovtyukh, V. V., Luck, R. E., Lépine, J. R. D., Maciel, W. J., & Beletsky, Y. V. 2002c, A&A, 392, 491
- Andrievsky et al. (2004) Andrievsky, S. M., Luck, R. E., Martin, P., & Lépine, J. R. D. 2004, A&A, 413, 159
- Asplund et al. (2004) Asplund, M., Grevesse, N., Sauval, A. J., Allende Prieto, C., & Kiselman, D. 2004, A&A, 417, 751
- Bellazzini et al. (2004) Bellazzini, M., Ibata, R., Monaco, L., Martin, N., Irwin, M. J., & Lewis, G. F. 2004, MNRAS, 354, 1263
- Bensby et al. (2003) Bensby, T., Feltzing, S., & Lundström, I. 2003, A&A, 410, 527
- Bensby et al. (2004a) —. 2004a, A&A, 421, 969
- Bensby et al. (2004b) —. 2004b, A&A, 415, 155
- Biémont et al. (1991) Biémont, E., Baudoux, M., Kurucz, R. L., Ansbacher, W., & Pinnington, E. H. 1991, A&A, 249, 539
- Blackwell et al. (1986a) Blackwell, D. E., Booth, A. J., Haddock, D. J., Petford, A. D., & Leggett, S. K. 1986a, MNRAS, 220, 549
- Blackwell et al. (1986b) Blackwell, D. E., Booth, A. J., Menon, S. L. R., & Petford, A. D. 1986b, MNRAS, 220, 289
- Blackwell et al. (1979a) Blackwell, D. E., Ibbetson, P. A., Petford, A. D., & Shallis, M. J. 1979a, MNRAS, 186, 633
- Blackwell et al. (1995) Blackwell, D. E., Lynas-Gray, A. E., & Smith, G. 1995, A&A, 296, 217
- Blackwell et al. (1983) Blackwell, D. E., Menon, S. L. R., & Petford, A. D. 1983, MNRAS, 204, 883
- Blackwell et al. (1982) Blackwell, D. E., Menon, S. L. R., Petford, A. D., & Shallis, M. J. 1982, MNRAS, 201, 611
- Blackwell et al. (1979b) Blackwell, D. E., Petford, A. D., & Shallis, M. J. 1979b, MNRAS, 186, 657
- Blackwell et al. (1980) Blackwell, D. E., Petford, A. D., Shallis, M. J., & Simmons, G. J. 1980, MNRAS, 191, 445
- Bonifacio et al. (2004) Bonifacio, P., Sbordone, L., Marconi, G., Pasquini, L., & Hill, V. 2004, A&A, 414, 503
- Bragaglia et al. (2001) Bragaglia, A., Carretta, E., Gratton, R. G., Tosi, M., Bonanno, G., Bruno, P., Calì, A., Claudi, R., Cosentino, R., Desidera, S., Farisato, G., Rebeschini, M., & Scuderi, S. 2001, AJ, 121, 327
- Brewer & Carney (2005) Brewer, M. & Carney, B. W. 2005, AJ submitted
- Brown et al. (1996) Brown, J. A., Wallerstein, G., Geisler, D., & Oke, J. B. 1996, AJ, 112, 1551
- Burris et al. (2000) Burris, D. L., Pilachowski, C. A., Armandroff, T. E., Sneden, C., Cowan, J. J., & Roe, H. 2000, ApJ, 544, 302
- Busso et al. (1999) Busso, M., Gallino, R., & Wasserburg, G. J. 1999, ARA&A, 37, 239
- Carney (1996) Carney, B. W. 1996, PASP, 108, 900
- Carney & Latham (1986) Carney, B. W. & Latham, D. W. 1986, AJ, 92, 60
- Carney et al. (1990) Carney, B. W., Latham, D. W., & Laird, J. B. 1990, AJ, 99, 572
- Carney et al. (2003) Carney, B. W., Latham, D. W., Stefanik, R. P., Laird, J. B., & Morse, J. A. 2003, AJ, 125, 293
- Carney et al. (2004) Carney, B. W., Lee, J., & Dodson, B. 2004, AJ in press (astro-ph/0411014)
- Carney & Seitzer (1993) Carney, B. W. & Seitzer, P. 1993, AJ, 105, 2127
- Carpenter (2001) Carpenter, J. M. 2001, AJ, 121, 2851
- Carraro et al. (2004) Carraro, G., Bresolin, F., Villanova, S., Matteucci, F., Patat, F., & Romaniello, M. 2004, AJ, 128, 1676
- Cayrel et al. (1985) Cayrel, R., Cayrel de Strobel, G., & Campbell, B. 1985, A&A, 146, 249
- Cayrel et al. (2004) Cayrel, R., Depagne, E., Spite, M., Hill, V., Spite, F., François, P., Plez, B., Beers, T., Primas, F., Andersen, J., Barbuy, B., Bonifacio, P., Molaro, P., & Nordström, B. 2004, A&A, 416, 1117
- Charbonnel & Balachandran (2000) Charbonnel, C. & Balachandran, S. C. 2000, A&A, 359, 563
- Chen et al. (2003) Chen, L., Hou, J. L., & Wang, J. J. 2003, AJ, 125, 1397
- Chiappini et al. (2001) Chiappini, C., Matteucci, F., & Romano, D. 2001, ApJ, 554, 1044
- Cohen et al. (1999) Cohen, J. G., Gratton, R. G., Behr, B. B., & Carretta, E. 1999, ApJ, 523, 739
- Costa et al. (2004) Costa, R. D. D., Uchida, M. M. M., & Maciel, W. J. 2004, A&A, 423, 199
- Crane et al. (2003) Crane, J. D., Majewski, S. R., Rocha-Pinto, H. J., Frinchaboy, P. M., Skrutskie, M. F., & Law, D. R. 2003, ApJ, 594, L119
- Daflon & Cunha (2004) Daflon, S. & Cunha, K. 2004, ApJ, 617, 1115
- De Angeli et al. (2005) De Angeli, F., Piotto, G., Cassisi, S., Busso, G., Recio-Blanco, A., Salaris, M., Aparicio, A., & Rosenberg, A. 2005, AJ in press (astro-ph/0503594)
- Dias et al. (2002) Dias, W. S., Lépine, J. R. D., & Alessi, B. S. 2002, A&A, 388, 168
- Edvardsson et al. (1993) Edvardsson, B., Andersen, J., Gustafsson, B., Lambert, D. L., Nissen, P. E., & Tomkin, J. 1993, A&A, 275, 101
- Edvardsson et al. (1995) Edvardsson, B., Pettersson, B., Kharrazi, M., & Westerlund, B. 1995, A&A, 293, 75
- Fagerholm (1906) Fagerholm, E. 1906, Ph.D. Thesis, Uppsala
- Friel (1995) Friel, E. D. 1995, ARA&A, 33, 381
- Friel (2004) —. 2004, Chemical Abundances and Mixing in Stars in the Milky Way and its Satellites (ed. L. Pasquini and S. Randich (Springer-Verlag), in press)
- Friel et al. (2003) Friel, E. D., Jacobson, H. R., Barrett, E., Fullton, L., Balachandran, S. C., & Pilachowski, C. A. 2003, AJ, 126, 2372
- Friel et al. (2002) Friel, E. D., Janes, K. A., Tavarez, M., Scott, J., Katsanis, R., Lotz, J., Hong, L., & Miller, N. 2002, AJ, 124, 2693
- Frinchaboy et al. (2004) Frinchaboy, P. M., Majewski, S. R., Crane, J. D., Reid, I. N., Rocha-Pinto, H. J., Phelps, R. L., Patterson, R. J., & Muñoz, R. R. 2004, ApJ, 602, L21
- Fry & Carney (1997) Fry, A. M. & Carney, B. W. 1997, AJ, 113, 1073
- Gonzalez & Wallerstein (2000) Gonzalez, G. & Wallerstein, G. 2000, PASP, 112, 1081
- Gratton (1989) Gratton, R. G. 1989, A&A, 208, 171
- Gratton & Contarini (1994) Gratton, R. G. & Contarini, G. 1994, A&A, 283, 911
- Gray (1992) Gray, D. F. 1992, The observation and analysis of stellar photospheres (Cambridge Astrophysics Series, Cambridge: Cambridge University Press, 1992, 2nd ed., ISBN 0521403200.)
- Grevesse & Sauval (1998) Grevesse, N. & Sauval, A. J. 1998, Space Science Reviews, 85, 161
- Guetter (1993) Guetter, H. H. 1993, AJ, 106, 220
- Hamdani et al. (2000) Hamdani, S., North, P., Mowlavi, N., Raboud, D., & Mermilliod, J.-C. 2000, A&A, 360, 509
- Hill & Pasquini (1999) Hill, V. & Pasquini, L. 1999, A&A, 348, L21
- Hinkle et al. (2000) Hinkle, K., Wallace, L., Valenti, J., & Harmer, D. 2000, Visible and Near Infrared Atlas of the Arcturus Spectrum 3727-9300 A (Visible and Near Infrared Atlas of the Arcturus Spectrum 3727-9300 A ed. Kenneth Hinkle, Lloyd Wallace, Jeff Valenti, and Dianne Harmer. (San Francisco: ASP) ISBN: 1-58381-037-4, 2000.)
- Hou et al. (2000) Hou, J. L., Prantzos, N., & Boissier, S. 2000, A&A, 362, 921
- Ibata et al. (1995) Ibata, R. A., Gilmore, G., & Irwin, M. J. 1995, MNRAS, 277, 781
- Ibata et al. (2003) Ibata, R. A., Irwin, M. J., Lewis, G. F., Ferguson, A. M. N., & Tanvir, N. 2003, MNRAS, 340, L21
- Ivans et al. (1999) Ivans, I. I., Sneden, C., Kraft, R. P., Suntzeff, N. B., Smith, V. V., Langer, G. E., & Fulbright, J. P. 1999, AJ, 118, 1273
- Janes & Phelps (1994) Janes, K. A. & Phelps, R. L. 1994, AJ, 108, 1773
- Kaluzny (1994) Kaluzny, J. 1994, A&AS, 108, 151
- King et al. (2000) King, J. R., Soderblom, D. R., Fischer, D., & Jones, B. F. 2000, ApJ, 533, 944
- Kurucz (1993) Kurucz, R. 1993, ATLAS9 Stellar Atmosphere Programs and 2 km/s grid. Kurucz CD-ROM No. 13. Cambridge, Mass.: Smithsonian Astrophysical Observatory, 1993., 13
- Kurucz & Bell (1995) Kurucz, R. & Bell, B. 1995, Atomic Line Data (R.L. Kurucz and B. Bell) Kurucz CD-ROM No. 23. Cambridge, Mass.: Smithsonian Astrophysical Observatory, 1995., 23
- Kurucz et al. (1984) Kurucz, R. L., Furenlid, I., & Brault, J. T. L. 1984, Solar flux atlas from 296 to 1300 nm (National Solar Observatory Atlas, Sunspot, New Mexico: National Solar Observatory, 1984)
- Lépine et al. (2001) Lépine, J. R. D., Mishurov, Y. N., & Dedikov, S. Y. 2001, ApJ, 546, 234
- Laird et al. (1988) Laird, J. B., Carney, B. W., Rupen, M. P., & Latham, D. W. 1988, AJ, 96, 1908
- Lambert & Luck (1976) Lambert, D. L. & Luck, R. E. 1976, The Observatory, 96, 100
- Lambert et al. (1995) Lambert, D. L., Smith, V. V., Busso, M., Gallino, R., & Straniero, O. 1995, ApJ, 450, 302
- Lawler et al. (2001a) Lawler, J. E., Bonvallet, G., & Sneden, C. 2001a, ApJ, 556, 452
- Lawler et al. (2001b) Lawler, J. E., Wickliffe, M. E., den Hartog, E. A., & Sneden, C. 2001b, ApJ, 563, 1075
- Luck (1994) Luck, R. E. 1994, ApJS, 91, 309
- Luck et al. (2003) Luck, R. E., Gieren, W. P., Andrievsky, S. M., Kovtyukh, V. V., Fouqué, P., Pont, F., & Kienzle, F. 2003, A&A, 401, 939
- MacMinn et al. (1994) MacMinn, D., Phelps, R. L., Janes, K. A., & Friel, E. D. 1994, AJ, 107, 1806
- Martin et al. (2004) Martin, N. F., Ibata, R. A., Bellazzini, M., Irwin, M. J., Lewis, G. F., & Dehnen, W. 2004, MNRAS, 348, 12
- Martin et al. (2005) Martin, N. F., Ibata, R. A., Conn, B. C., Lewis, G. F., Bellazzini, M., & Irwin, M. J. 2005, MNRAS submitted (astro-ph/0503705)
- Mathieu et al. (1986) Mathieu, R. D., Latham, D. W., Griffin, R. F., & Gunn, J. E. 1986, AJ, 92, 1100
- McWilliam et al. (1992) McWilliam, A., Geisler, D., & Rich, R. M. 1992, PASP, 104, 1193
- McWilliam et al. (1995) McWilliam, A., Preston, G. W., Sneden, C., & Searle, L. 1995, AJ, 109, 2757
- McWilliam & Rich (1994) McWilliam, A. & Rich, R. M. 1994, ApJS, 91, 749
- McWilliam et al. (2003) McWilliam, A., Rich, R. M., & Smecker-Hane, T. A. 2003, ApJ, 592, L21
- Minniti (1995) Minniti, D. 1995, A&AS, 113, 299
- Montgomery et al. (1993) Montgomery, K. A., Marschall, L. A., & Janes, K. A. 1993, AJ, 106, 181
- Newberg et al. (2002) Newberg, H. J., Yanny, B., Rockosi, C., Grebel, E. K., Rix, H., Brinkmann, J., Csabai, I., Hennessy, G., Hindsley, R. B., Ibata, R., Ivezić, Z., Lamb, D., Nash, E. T., Odenkirchen, M., Rave, H. A., Schneider, D. P., Smith, J. A., Stolte, A., & York, D. G. 2002, ApJ, 569, 245
- Nordström et al. (2004) Nordström, B., Mayor, M., Andersen, J., Holmberg, J., Pont, F., Jørgensen, B. R., Olsen, E. H., Udry, S., & Mowlavi, N. 2004, A&A, 418, 989
- Pasquini et al. (2004) Pasquini, L., Randich, S., Zoccali, M., Hill, V., Charbonnel, C., & Nordström, B. 2004, A&A, 424, 951
- Paulson et al. (2003) Paulson, D. B., Sneden, C., & Cochran, W. D. 2003, AJ, 125, 3185
- Peñarrubia et al. (2004) Peñarrubia, J., Martínez-Delgado, D., Rix, H. W., Gomez-Flechoso, M. A., Munn, J., Newberg, H., Bell, E. F., Yanny, B., Zucker, D., & Grebel, E. K. 2004, ApJ submitted (astro-ph/0410448)
- Peterson et al. (1993) Peterson, R. C., Dalle Ore, C. M., & Kurucz, R. L. 1993, ApJ, 404, 333
- Peterson & Green (1998) Peterson, R. C. & Green, E. M. 1998, ApJ, 502, L39
- Phelps et al. (1994) Phelps, R. L., Janes, K. A., & Montgomery, K. A. 1994, AJ, 107, 1079
- Pompéia et al. (2003) Pompéia, L., Barbuy, B., & Grenon, M. 2003, ApJ, 592, 1173
- Prochaska & McWilliam (2000) Prochaska, J. X. & McWilliam, A. 2000, ApJ, 537, L57
- Prochaska et al. (2000) Prochaska, J. X., Naumov, S. O., Carney, B. W., McWilliam, A., & Wolfe, A. M. 2000, AJ, 120, 2513
- Ramírez & Cohen (2002) Ramírez, S. V. & Cohen, J. G. 2002, AJ, 123, 3277
- Reddy et al. (2002) Reddy, B. E., Lambert, D. L., Laws, C., Gonzalez, G., & Covey, K. 2002, MNRAS, 335, 1005
- Reddy et al. (2003) Reddy, B. E., Tomkin, J., Lambert, D. L., & Allende Prieto, C. 2003, MNRAS, 340, 304
- Rieke & Lebofsky (1985) Rieke, G. H. & Lebofsky, M. J. 1985, ApJ, 288, 618
- Rocha-Pinto et al. (2003) Rocha-Pinto, H. J., Majewski, S. R., Skrutskie, M. F., & Crane, J. D. 2003, ApJ, 594, L115
- Rosenberg et al. (1999) Rosenberg, A., Saviane, I., Piotto, G., & Aparicio, A. 1999, AJ, 118, 2306
- Rosvick (1995) Rosvick, J. M. 1995, MNRAS, 277, 1379
- Ryan & Norris (1991) Ryan, S. G. & Norris, J. E. 1991, AJ, 101, 1865
- Ryan et al. (1996) Ryan, S. G., Norris, J. E., & Beers, T. C. 1996, ApJ, 471, 254
- Salaris et al. (2002) Salaris, M., Cassisi, S., & Weiss, A. 2002, PASP, 114, 375
- Salaris & Weiss (1998) Salaris, M. & Weiss, A. 1998, A&A, 335, 943
- Salaris & Weiss (2002) Salaris, M., & Weiss, A. 2002, A&A, 388, 492
- Salaris et al. (2004) Salaris, M., Weiss, A., & Percival, S. M. 2004, A&A, 414, 163
- Sanders (1977) Sanders, W. L. 1977, A&AS, 27, 89
- Sbordone et al. (2005) Sbordone, L., Bonifacio, P., Marconi, G., Zaggia, S., & Buonanno, R. 2005, A&A, 430, L13
- Schuler et al. (2003) Schuler, S. C., King, J. R., Fischer, D. A., Soderblom, D. R., & Jones, B. F. 2003, AJ, 125, 2085
- Schuler et al. (2004) Schuler, S. C., King, J. R., Hobbs, L. M., & Pinsonneault, M. H. 2004, ApJ, 602, L117
- Scott et al. (1995) Scott, J. E., Friel, E. D., & Janes, K. A. 1995, AJ, 109, 1706
- Searle & Zinn (1978) Searle, L. & Zinn, R. 1978, ApJ, 225, 357
- Shetrone et al. (2003) Shetrone, M., Venn, K. A., Tolstoy, E., Primas, F., Hill, V., & Kaufer, A. 2003, AJ, 125, 684
- Simmerer et al. (2004) Simmerer, J., Sneden, C., Cowan, J. J., Collier, J., Woolf, V. M., & Lawler, J. E. 2004, ApJ, 617, 1091
- Smith & Raggett (1981) Smith, G. & Raggett, D. S. J. 1981, Journal of Physics B Atomic Molecular Physics, 14, 4015
- Smith & Suntzeff (1987) Smith, V. V. & Suntzeff, N. B. 1987, AJ, 93, 359
- Smith et al. (2000) Smith, V. V., Suntzeff, N. B., Cunha, K., Gallino, R., Busso, M., Lambert, D. L., & Straniero, O. 2000, AJ, 119, 1239
- Sneden (1973) Sneden, C. 1973, ApJ, 184, 839
- Sneden et al. (1994) Sneden, C., Preston, G. W., McWilliam, A., & Searle, L. 1994, ApJ, 431, L27
- Tautvaišiene et al. (2000) Tautvaišiene, G., Edvardsson, B., Tuominen, I., & Ilyin, I. 2000, A&A, 360, 499
- Thorén & Feltzing (2000) Thorén, P. & Feltzing, S. 2000, A&A, 363, 692
- Tomkin & Lambert (1999) Tomkin, J. & Lambert, D. L. 1999, ApJ, 523, 234
- Tosi et al. (1998) Tosi, M., Pulone, L., Marconi, G., & Bragaglia, A. 1998, MNRAS, 299, 834
- Tosi et al. (2004) Tosi, M., Di Fabrizio, L., Bragaglia, A., Carusillo, P. A., & Marconi, G. 2004, MNRAS, 354, 225
- Twarog et al. (1997) Twarog, B. A., Ashman, K. M., & Anthony-Twarog, B. J. 1997, AJ, 114, 2556
- Venn et al. (2004) Venn, K. A., Irwin, M., Shetrone, M. D., Tout, C. A., Hill, V., & Tolstoy, E. 2004, AJ, 128, 1177
- Wilden et al. (2002) Wilden, B. S., Jones, B. F., Lin, D. N. C., & Soderblom, D. R. 2002, AJ, 124, 2799
- Woosley & Weaver (1995) Woosley, S. E. & Weaver, T. A. 1995, ApJS, 101, 181
- Wyse & Gilmore (1992) Wyse, R. F. G. & Gilmore, G. 1992, AJ, 104, 144
- Yanny et al. (2003) Yanny, B., Newberg, H. J., Grebel, E. K., Kent, S., Odenkirchen, M., Rockosi, C. M., Schlegel, D., Subbarao, M., Brinkmann, J., Fukugita, M., Ivezic, Ž., Lamb, D. Q., Schneider, D. P., & York, D. G. 2003, ApJ, 588, 824
- Zoccali et al. (2003) Zoccali, M., Renzini, A., Ortolani, S., Greggio, L., Saviane, I., Cassisi, S., Rejkuba, M., Barbuy, B., Rich, R. M., & Bica, E. 2003, A&A, 399, 931