Fluorescent Molecular Hydrogen Emission in IC 63: , HUT, and Rocket Observations
Abstract
We present far-ultraviolet observations of IC 63, an emission/reflection nebula illuminated by the B0.5IV star Cassiopeia, located 1.3 pc from the nebula. Molecular hydrogen fluorescence was detected first in IC 63 by and later at shorter wavelengths by . Here we present () observations towards three locations in the nebula, complemented by Hopkins Ultraviolet Telescope (HUT) data on the central nebular position. In addition, we present a sounding rocket calibration of a spectrum of Cas. Molecular hydrogen fluorescence is detected in all three FUSE pointings. The intensity of this emission as well as the contributions from other species are seen to vary with position. The absolute flux calibration of the sounding rocket data allows us to reliably predict the radiation field incident on IC 63. We use these data to test models of the fluorescent process. Our modeling resolves the perceived discrepancy between the existing ultraviolet observations and achieves a satisfactory agreement with the H2 rotational structure observed with .
Subject headings:
ISM: molecules — ISM: individual (IC 63) — reflection nebulae — ultraviolet: ISM—stars: individual (HD 5394)1. Introduction
Ultraviolet fluorescence is the initial step in the process that gives rise to the near-infrared (IR) emission spectrum of photo-excited molecular hydrogen (H2) observed in a wide range of astronomical environments. Hydrogen molecules make the transition to an excited electronic state (predominantly and ) by absorbing ultraviolet (UV) photons. The transition back to the ground electronic state produces the characteristic ultraviolet spectrum and leaves the molecules in excited rovibrational levels. The near-IR lines are emitted as the molecules return to the ground vibrational level through quadrupole transitions. Infrared emission lines can also be populated collisionally, and are a common diagnostic used to probe the molecular gas phase of many classes of astronomical objects (e.g., star forming regions: Luhman et al. 1994, Chrysostomou et al. 1993; reflection nebulae: Gatley et al. 1987, Takami et al. 2000; planetary nebulae: Zuckerman & Gatley 1988, Luhman & Rieke 1996). Ultraviolet emission lines of H2 cannot be produced thermally because the molecules would dissociate before the upper electronic states could be populated, so they must be pumped by ultraviolet photons or non-thermal electrons. The detection of these lines is a clear indication of non-thermal excitation occurring in at least some portion of the molecular gas.
The far-ultraviolet emission from molecular hydrogen was first predicted to be detectable in diffuse objects by Duley & Williams (1980). Witt et al. (1989) detected this emission in IC 63 with the Short Wavelength Primary (SWP) camera on , representing the first astronomical detection of the ultraviolet H2 fluorescence spectrum pumped by a continuum source. Luhman et al. (1997) reported the detection of the near-infrared emission spectrum of fluorescent H2, making IC 63 the first object seen to exhibit both the ultraviolet and infrared emission from H2 excited by ultraviolet continuum photons. Hurwitz (1998) presented the first spectrum of IC 63 at wavelengths shorter than the bandpass, using the Berkeley Extreme and Far-ultraviolet Spectrograph aboard .
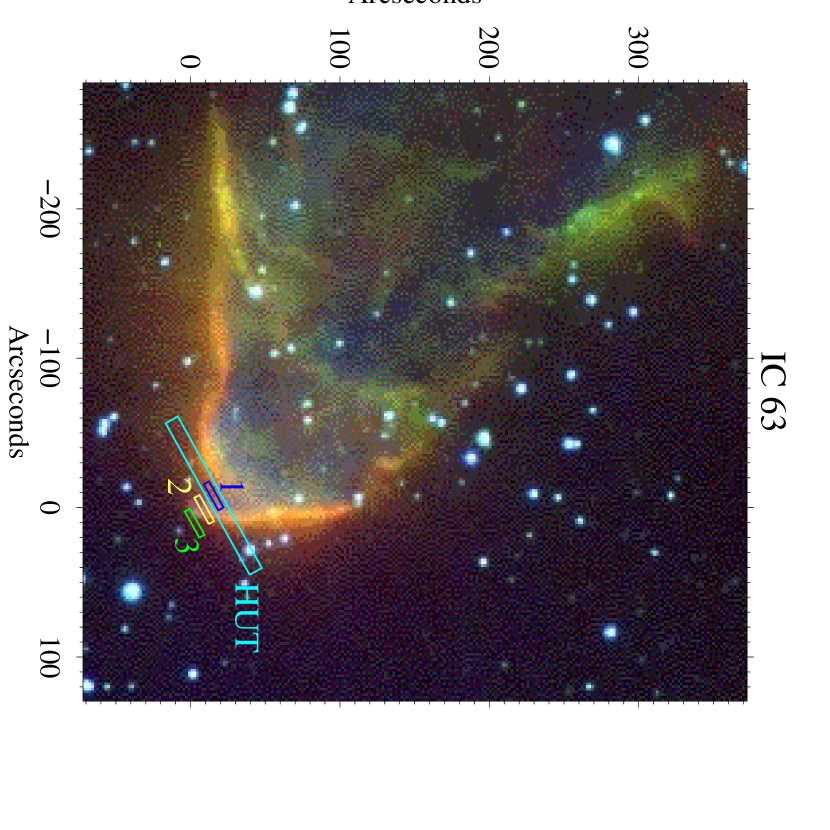
IC 63 is a bright emission/reflection nebula illuminated by the hot star Cas (HD 5394), a lightly reddened B0.5 IV star ( = 0.03; Hurwitz 1998). Assuming that the star and the nebula are co-spatial at a distance of 200 pc, the bright optical nebula is projected to be 1.3 pc from the star (Figure 1). A number of arguments are given in the literature to support fluorescent pumping by the ultraviolet continuum of Cas as the process that gives rise to the H2 emission observed by Witt et al. (1989), Luhman et al. (1997), and Hurwitz (1998). Witt et al. (1989) present calculations of the energy budgets for competing processes such as a collisional excitation from a stellar wind or non-thermal excitation from electrons produced by stellar X-rays, and find that these explanations are insufficient to reproduce the nebular brightness observed in IC 63. The infrared H2 line ratios seen by Luhman et al. (1997) are consistent with fluorescence rather than collisional excitation. Hurwitz (1998) discounts the possibilities of shocks by the narrow line widths seen in sub-mm molecular observations (Jansen et al., 1994), but finds that models of UV fluorescence overpredict the amount of far-UV emission observed. Hurwitz (1998) found that the absolute flux of the far-UV emission lines were an order of magnitude fainter than what would be expected based on the longer wavelength ultraviolet lines.
We present the results of () and Hopkins Ultraviolet Telescope (HUT) observations of IC 63. The high spectral resolution of enables us to separate fluorescent emission from the dust scattered continuum and resolve the lines into their individual rotational components. These results mark only the second object in which continuum-pumped fluorescence has been resolved below 1150 Å (IC 405, France et al. 2004). The HUT observation covers the entire 912 – 1650 Å region spanned by the fluorescent emission. Additionally, we present the far-UV spectrum of the incident radiation field from Cas obtained with a rocket-borne spectrograph. This data has been used to calibrate a high-resolution scattered light spectrum from , allowing us to model the fluorescent H2 using realistic physical parameters for the exciting radiation field.
2. Far-Ultraviolet Observations
2.1. Observations
IC 63 was observed by on 2001 September 09 and 10 (see Moos et al. 2000 for a satellite description and Sahnow et al. 2000 for on-orbit performance characteristics). The (4″20″, filled-slit resolving power 8000) MDRS aperture was used to acquire spectra at three positions in the nebula. POS1 was observed for 15.9 ks and is located in the bright “bullet-tip” of IC 63. This position was chosen to overlap with previous pointings made with , , and HUT where ultraviolet fluorescence was detected (Witt et al. 1989; Hurwitz 1998; this work). POS2 is located along the limb of the bright optical emission, and was observed for 17.6 ks (Figure 2). POS3, observed for 31.5 ks, samples the region just outside the optical nebula. Sample spectra for all three pointings are shown in Figure 3 and a summary of the observations of IC 63 is given in Table 1. The data were obtained in time-tagged (TTAG) mode and have been reprocessed using the CalFUSE pipeline version 3.0.2. In order to minimize channel drift in the LiF2 and the two SiC channels, channel alignment (PEAK-UP) was performed once per orbit using the star HD 6417. data acquired in TTAG mode register the light through all three science apertures (LWRS, MDRS, and HIRS), and while no signal was detected through the HIRS slit, we obtained off-nebula spectra in the LWRS (30″30″) aperture. It was necessary to redefine the regions used for background subtraction by the CalFUSE pipeline in order to accommodate the signal in the LWRS slit. The nominal background regions used by CalFUSE include all regions on the detectors outside of the area of the spectrum from the primary slit. We defined four smaller background regions on the detectors that avoided all three science apertures.
| Position | Program | RA (2000) | (2000) | Integration Time |
|---|---|---|---|---|
| ( h m | (° ′ ″) | (seconds) | ||
| IC63-POS1 | B11201 | 00 59 01.29 | +60 53 17.9 | 15886 |
| IC63-POS2 | B11201 | 00 58 59.04 | +60 53 06.4 | 17564 |
| IC63-POS3 | B11203 | 00 58 56.79 | +60 52 54.9 | 31509 |
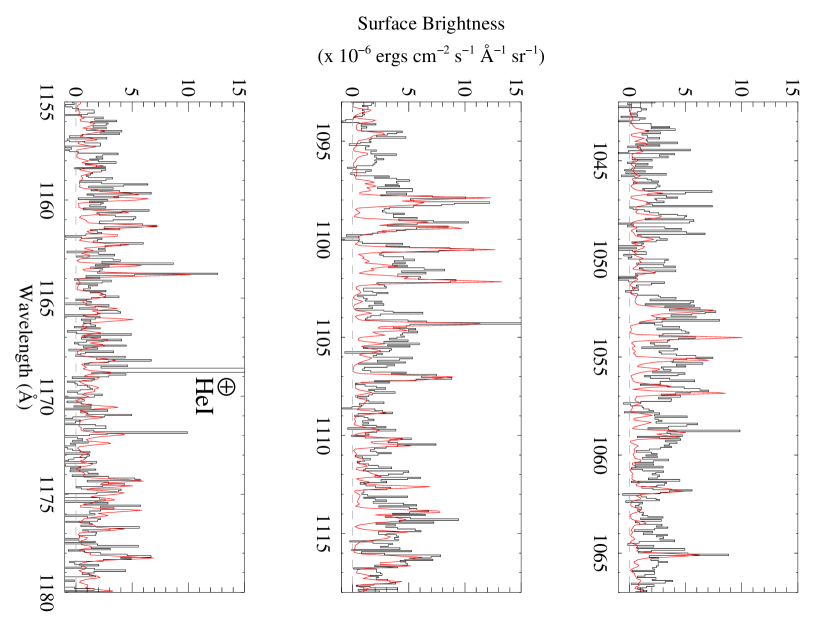
Cas exceeds the bright target limit by almost two orders of magnitude, but observing the instrumentally scattered spectrum of the star allows the spectral characteristics to be recorded while protecting the primary science detectors. Cas was observed using this offset technique on 2002 December 16 under the project bright-object test program (S52107). During this 3.1 ks observation, the LWRS aperture was located 1′ from Cas (RA = 00h56m50.65s, = +60∘42′53.0″, J2000). Spectra were obtained on the 2A and 2B detector segments, providing wavelength coverage from 916.6 – 1181.9 Å. A flux calibration was performed using the sounding rocket spectrum of Cas described below.
2.2. Description of the HUT Observation
IC 63 was observed by HUT, aboard -1, on 1990 December 08. 1668 seconds of nighttime data were obtained in the 830-1880 Å bandpass using the primary (9.4″116″) aperture (spectrum ic63_144, Figure 4). A description of the HUT instrument and data reduction can be found in Davidsen et al. (1992). The spectrum was acquired from the Multi-Mission Archive at the Space Telescope Science Institute (MAST). The pointing is identical to where Witt et al. (1989) detected ultraviolet H2 fluorescence which is coincident with the POS1.
2.3. Sounding Rocket Observation of Cas
Cas was observed by a rocket-borne spectrograph in 2003 December. This was the first flight of the Long-Slit Imaging Dual-Order Spectrograph (LIDOS, McCandliss et al. 2003). LIDOS employs two complimentary ultraviolet-sensitive detectors to achieve a large dynamic range in flux for imaging spectroscopy. An updated version of the Faint Object Telescope (0.4-meter diameter, f/15.7 Dall-Kirkham; Hartig et al. 1980; McCandliss et al. 1994; France et al. 2004) focuses light at the entrance aperture of the spectrograph, a mirrored slit-jaw into which a long-slit (10″ 300″) is etched. The light entering the 600 mm diameter Rowland spectrograph is dispersed by a silicon carbide grating. Far-UV light diffracted in the +1 order (900 – 1590 Å) is recorded by a windowless -doped CCD that is sensitive to bright objects whereas the –1 order UV light (930 – 1680 Å) is recorded by a photon-counting micro-channel plate (MCP) detector with a CsI photocathode, read out by a double delay-line anode (McPhate et al., 1999). The MCP detector has a low background equivalent flux, extending our detection limit towards fainter diffuse objects.
LIDOS was launched aboard a Black Brant IX sounding rocket (NASA 36.208 UG) from White Sands Missile Range, New Mexico, on 2003 December 16 at 20:00 MST. The pointing was obtained using an axially mounted onboard startracker with a field of view of 2∘. Target acquisition was within a few arcminutes of the nominal pointing, and this field was relayed to the ground in real-time through a Xybion TV camera imaging the slitjaw (20′ field-of-view). Fine adjustments (e.g. placing the star in the slit) were performed via commands to the ACS in real-time by a ground based operator. Cas was placed in the spectrograph slit near T+200 seconds and a 28 second exposure was obtained with the CCD, shown in Figure 5. Bias and dark frames were also obtained in-flight. Following the CCD exposure, the MCP high-voltage was turned on and pointing offsets were made to both IC 59 and IC 63. The integration time was sufficiently short on the two nebulae that only a scattered light spectrum of Cas was detected at the position of IC 63.
The rocket data were analyzed using IDL code customized to read the data as supplied by the telemetry system. A background subtraction can be made by measuring the flux on the detector adjacent to where the star was located. The data are then calibrated with measurements of the telescope mirror reflectivities and spectrograph quantum efficiencies, measured both before and after flight in the calibration facilities located at The Johns Hopkins University. The high levels of CCD background and fixed pattern noise, combined with a telescope focus problem experienced during flight, prevent a detailed analysis of the stellar spectrum, but the flux calibration can be transferred to LWRS observations of the scattered spectrum of Cas described above. Spectral windows with appreciable signal-to-noise in the rocket data were transferred to the spectrum, with the long wavelength end required to match the spectrum of Cas. This flux-calibrated spectrum of HD 5394, shown in Figure 6, is used as the input spectrum for the molecular hydrogen fluorescence model described in Section 4.
3. Nebular Line Identification
Our observations show a detection of fluorescent H2 clearly at POS1 and POS2, and there is a tentative detection at POS3. The strongest molecular hydrogen line complexes are centered on 1055, 1100, 1115, and 1161 Å. C II∗ 1037 and N II∗/N II∗∗ 1085 are seen strongly at all three positions. S III∗∗ 1021 is seen seen clearly at POS1 and POS3. Interestingly, we do not detect the ground state transitions of C II (1036) and S III (1012), and only marginally detect N II 1084 at POS1 and POS3. C II 1036, for example, would be expected to be roughly half as strong as the excited C II∗ line (shown in Figure 3), detectable at the S/N of these observations. We attribute this behavior to self-absorption by ground state ions within the nebula. This is supported by the off-nebula spectra simultaneously acquired in the LWRS aperture. While C II 1036 is still undetected, the lower lying transitions of N II (1084) and S III (1012 and 1015) are seen. This suggests that the ionized nebula extends beyond both the bright optical emission and the molecular emission, traced by the H2 fluorescence and the CO maps of Jansen et al. (1994). This picture agrees with the findings of Karr et al. (2005), who find an ionization front in the direction of Cas giving way to molecular material (traced by PAH emission) deeper into the nebula.
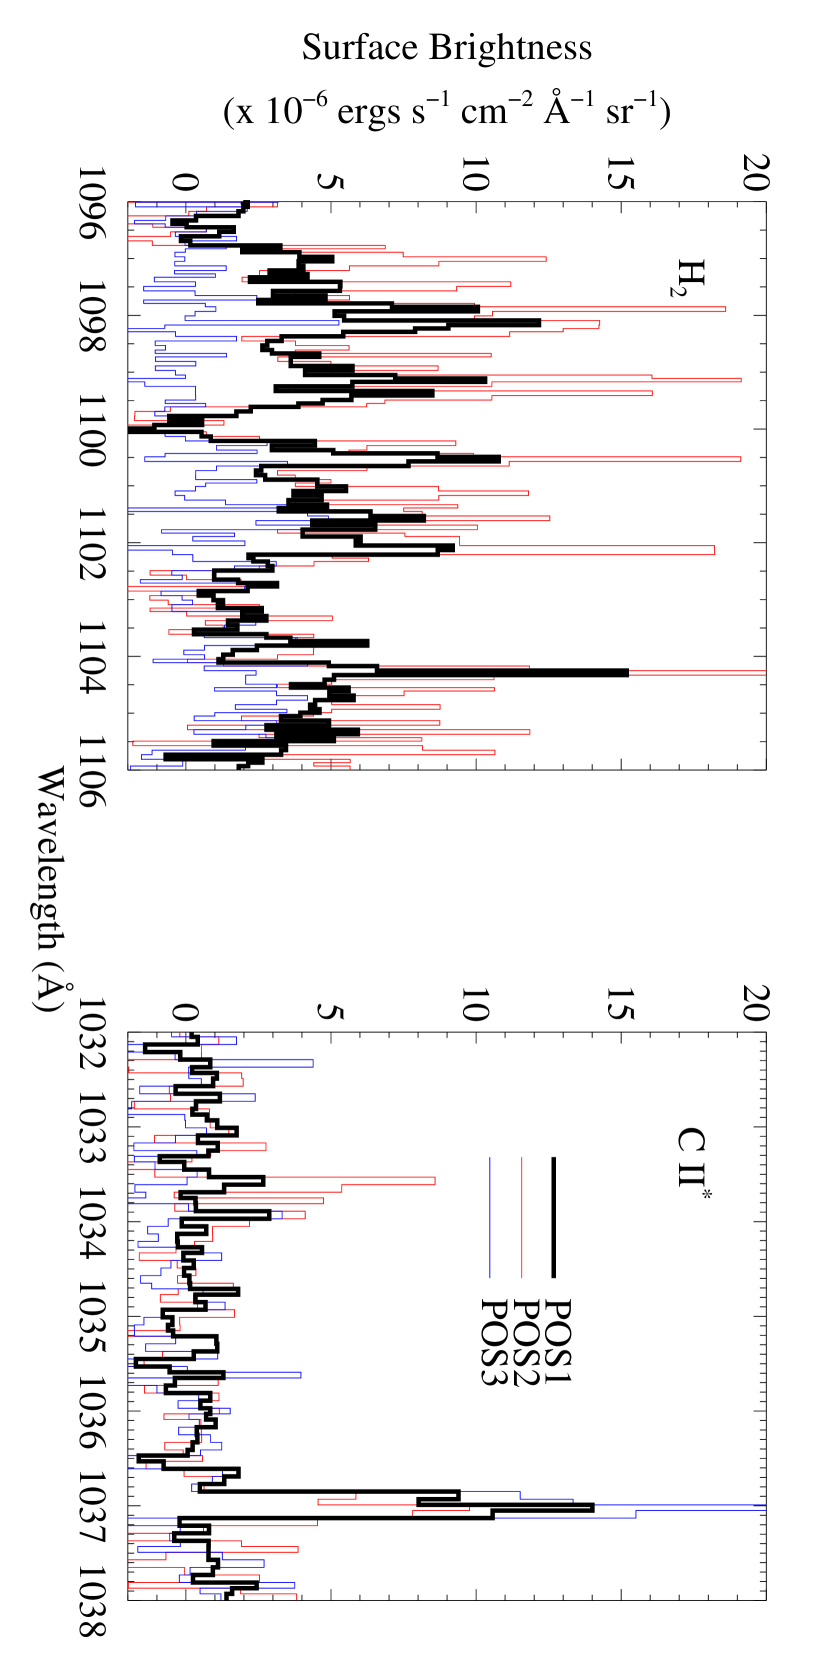
Line strengths are measured by integrating over wavelength and subtracting the integrated continuum of a nearby region to account for the large uncertainty in the image background subtraction. The ionic and the H2 line strengths, listed in Table 2, display inverse relationships with distance from the /HUT position. The ions show a dip in strength at POS2, rising to a maximum at POS3 whereas the molecular hydrogen lines show a peak at POS2, and fall to nearly zero beyond the optical nebula (POS3). The exception to this anti-correlation is N II∗∗ 1085, which roughly follows the molecular trend, but does not truncate as sharply as the H2 at POS3. Errors are difficult to estimate due to the differences in the size and location of the extraction regions used, we conservatively assign errors of 25% to the quoted values. We measure the widths of the ionic lines to be 0.1 – 0.15 Å, and find them to be at their rest wavelengths. This is consistent with the 1 – 2 km s-1 velocities found by Karr et al. (2005). We would not expect to measure a wavelength shift at the resolution of the instrument. The molecular hydrogen lines are found to be somewhat broader, as discussed in Section 5. Finally, we have found an unidentified triplet feature near 962 Å whose brightness increases in the MDRS aperture from POS1 to POS3. This feature is most likely P II 961.04/962.12/962.57, however it does not exhibit the spatial variation seen in any of the other species. This feature is not seen in the LWRS aperture, confining its spatial extent to within 200″ of the optical nebula.
| Line | (Å) | Line Strengths | ||
|---|---|---|---|---|
| POS1 (0″) | POS2 (28″) | POS3(56″) | ||
| H2 | 1055 | 5.2 x 10⁻⁶ | 9.5 x 10⁻⁶ | 0 |
| H2 | 1100 | 3.1 x 10⁻⁵ | 6.3 x 10⁻⁵ | 5.9 x 10⁻⁶ |
| C II∗ | 1037 | 2.8 x 10⁻⁶ | 1.9 x 10⁻⁶ | 4.0 x 10⁻⁶ |
| N II | 1084 | 1.8 x 10⁻⁶ | 3.7 x 10⁻⁷ | 7.3 x 10⁻⁷ |
| N II∗ | 1085 | 4.6 x 10⁻⁶ | 4.0 x 10⁻⁶ | 4.1 x 10⁻⁶ |
| N II∗∗ | 1085 | 9.5 x 10⁻⁶ | 1.0 x 10⁻⁵ | 5.0 x 10⁻⁶ |
| P IIaaTentative identification | 962 | 4.8 x 10⁻⁶ | 1.2 x 10⁻⁵ | 2.5 x 10⁻⁵ |
| S III∗∗ | 1021 | 1.5 x 10⁻⁶ | 8.5 x 10⁻⁷ | 1.9 x 10⁻⁶ |
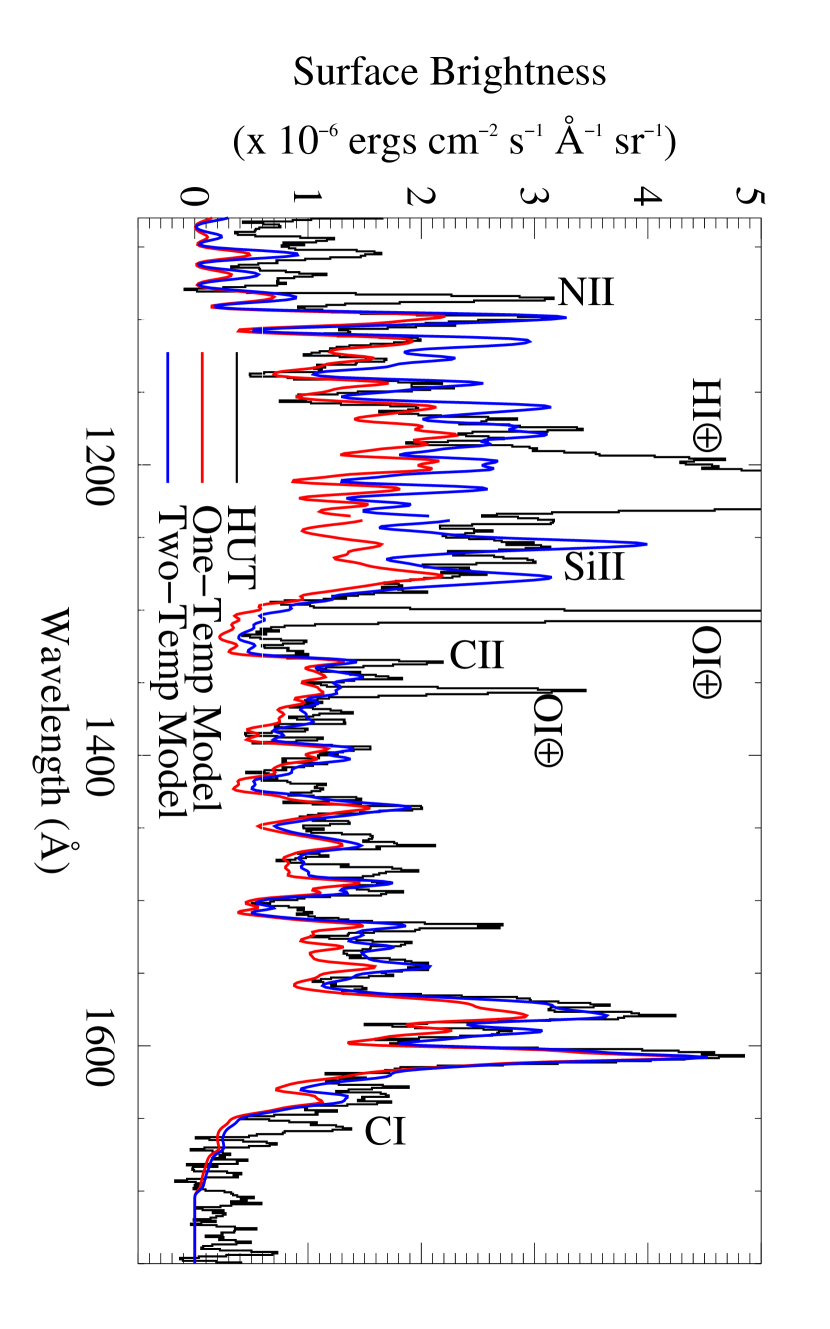
The strongest nebular feature seen in the HUT spectrum is the 1578/1608 H2 emission. The short-wavelength hydrogen bands are suggested, but are hard to identify unambiguously at the HUT resolution ( 3 Å, depending on the filling fraction within the slit). C II 1335 and N II 1085 are seen as well a scattered light contribution from nebular dust. The HUT spectrum gives us the opportunity to compare the emission from H2 both above and below Ly-, necessary for a thorough test of molecular hydrogen fluorescence models (see § 4). The HUT spectrum of IC 63 is shown in Figure 4 following a scattered light subtraction similar to the correction described by Witt et al. (1989). The scattered light was assumed to have a form where was made from a composite spectrum of Cas created from archival data and the spectrum described above. The data were degraded to the resolution and then joined to created a composite stellar spectrum spanning the entire range ( 900 – 1900 Å) covered by HUT. Following this procedure, we find that = 1.3 10-5 and = 1.5.
4. Fluorescent Molecular Hydrogen Model
Synthetic spectra of fluorescent emission from molecular hydrogen can be made by computing the radiative excitation rates into the excited electronic states of H2. Such models assume a ground electronic state population, then use photoexcitation cross sections and an incident radiation field to calculate the rovibrational levels of the upper electronic state (predominantly and ). The molecules will then return to the ground electronic state following the appropriate selection rules and branching ratios, producing the observed ultraviolet emission lines and leaving the molecules in excited rovibrational levels. Sternberg (1989) has described calculations of the far-ultraviolet spectrum of H2. However, Hurwitz (1998) finds that these models overpredict the observed short-wavelength intensity by roughly an order of magnitude. Such trends are hinted at in the model spectrum of Witt et al. (1989), although it seems that their observations did not go deep enough into the far-ultraviolet to see this effect fully.

We have adopted a modified version of the synthetic molecular hydrogen emission spectrum presented by Wolven et al. (1997) to model fluorescence induced by solar Ly- at the Shoemaker-Levy 9 impact site on Jupiter. These models include photoexcitation cross-sections computed using the line transition probabilities from Abgrall et al. (1993a, b). We adopted a Doppler -value of 2 km s-1. Sub-mm molecular line widths are seen to be quite narrow (Jansen et al., 1994; Hurwitz, 1998), and 2 km s-1 is the smallest -value that is compatible with the optical depth templates described by McCandliss (2003). The model is largely insensitive to the actual choice of -value for values of a few km s-1. The ratio of atomic to molecular hydrogen column densities is fixed to be 0.1, extrapolating the values found in the translucent cloud survey of Rachford et al. (2002). Additionally, the Wolven models allow for absorption out of upper vibrational states ( 0) and include a first-order correction for self-absorption by H2 at wavelengths shorter than 1100 Å. These models also take into account electronic transitions to the , , , and states, although their relative contribution to the resultant spectrum is small. Finally, transitions to predissociating states and vibrational states that result in dissociation ( 14, the vibrational continuum) are considered. For the model developed for IC 63, we find a dissociation fraction of 16.8%.
There are several important differences between the model described in Wolven et al. (1997) and the one presented here. The first is that the we only consider the photo-induced fluorescence, no electron-impact induced contribution is included. Witt et al. (1989) has determined that neither high-energy electrons nor a stellar wind make a large contribution to the H2 excitation. Hurwitz (1998) has provided additional evidence against contributions from high-energy electrons. The solar Ly- profile that was used as the excitation spectrum in Wolven et al. (1997) has been replaced by the flux calibrated spectrum of Cas, described in Section 2.1 and shown in Figure 6. We only include the 917 – 1182 Å region covered, but with the majority of the upper states populated through absorption between the Lyman limit and the (0 - 0) band near 1108 Å, we expect errors induced by this approximation to be minor.
The fluorescence code described here uses two temperature components, the rotational temperature quoted in Habart et al. (2004), 620 K, and a higher “non-thermal” vibrational temperature of 2500 K that was required to find agreement with the HUT data. The feature near 1578 Å that is produced in transitions to the vibrational continuum of the ground electronic state was underpredicted without a high-temperature component (Figure 4).

The physical basis for this vibrational temperature component is to mimic the effects of multiple pumping by UV photons. As described above, the fluorescence process can leave the molecule in a number of excited vibrational levels of the ground electronic state. Since the quadrupole decay rates are comparatively slow, the molecule can absorb another UV photon before it has returned to the ground vibrational state. We simulate this excited vibrational population with the second, higher temperature component. The 2500 K temperature applies only to the distribution of vibrational levels and is not coupled to the population of the rotational states. This decoupling occurs because of the selection rules for the electronic transitions of H2. The molecule can only change its rotational level () by -1, 0, or +1, where as the vibrational levels can change () by any value during the electronic transitions.
We also use the column density from Habart et al. (2004; 5 1021 cm-2) in the fluorescence code. We found that the model required an additional molecular hydrogen absorption component (of the same column and -value used in the emission model) to agree with the HUT data at the 1100 Å H2 emission band. This additional absorption component was calculated using the templates (McCandliss, 2003). The spectra are better fit without this added absorption. As the bulk of the H2 emission seen in the HUT data is unaffected by this additional absorption component, it is difficult to assign the a level of significance to this result, especially given the uncertainties discussed below. Assuming that the interstellar extinction along the line of sight to IC 63 is small, as is the case for Cas, we do not include a reddening correction.
5. Discussion
5.1. Spatial Extent of the Fluorescing Region
We can gain an estimate of the size of the region from which the H2 fluorescence emanates by comparing the line fluxes observed by , and HUT. The slit areas of these three instruments were 80, 530 & 1090 ″2, respectively. Based on the MAST archival spectra we find that the integrated fluxes for the line complexes at 1055Å and 1100Å we find the the fluxes observed by and HUT are consistent with each other at 2 and 310-13 ergs s-1 cm-2, respectively. The same two regions yield integrated fluxes of 5 and 710-14 ergs s-1 cm-2 in the observations. Although such a comparison is complicated by the fact that the slit geometries differ, with and HUT having rectangular slits while employed a circular slit, we find that the region giving rise to the H2 fluorescence extends beyond the area of the MDRS slit, but does not fill the HUT or slits. If we assume that the emitting region is of uniform surface brightness, we can use the flux ratios to estimate that the slit was about 60 % filled. As the emission seen by towards POS2 is of similar strength as POS1 we conclude that the center of the emitting region is probably located between these two positions. If we assume that the emitting region is a circle, centered between our POS1 and 2, we can then estimate that the diameter of the emitting region is about 30”.
5.2. H2 Modeling Results
Figures 2 and 4 show a comparison of the nebular H2 emission spectrum with the model described above. The HUT data allow us to test this model both above and below Lyman- for the first time while the spectrum gives us the opportunity to study the short wavelength H2 spectrum in detail. In each instance, the model requires an offset in the absolute flux to agree with the observations. Our H2 model is seen to roughly fit the spectrum of IC 63 both below Ly- and at the longest ultraviolet wavelengths ( 1600 Å), resolving the order of magnitude discrepancy between the relative strengths of the ultraviolet emission components seen in Hurwitz (1998) and suggested in the spectrum presented by Witt et al. (1989). Our model still shows some deviation at short wavelengths, but the differences are a factor of two at the most. H2 emission in the 1115 and 1143 Å bands are better fit with the single temperature model, shown in red in Figure 4, despite the underprediction of this model elsewhere in the spectrum. Disagreement between the model and the data could be due to an imperfect scattered light subtraction and/or an unknown amount of interstellar extinction. To achieve the fit to the HUT spectrum, the model requires an overall scale factor of 11, yet his is probably an under representation of the actual scaling required because the molecular emission is unlikely to be filling the entire HUT aperture (§ 5.1).
We find that the model shows relatively good agreement with the strengths of the rotationally resolved lines in the data. The lines appear broader than would be expected from a purely instrumental effect. We expect a filled-slit resolution of 0.125 Å in the MDRS aperture, yet some H2 lines are broader than 0.25 Å. We tentatively explain this as a redistribution effect caused by the finite width of the absorbing transition (Hummer, 1962). The exact cause is beyond the scope of this paper and will be addressed in future work. In contrast to the HUT spectrum, where the model needed to be scaled up to fit the data, we find that in order to achieve a good fit to the H2 lines observed in the spectra, the model needs to be scaled down by a factor of 0.5.
One possible explanation for the variations we find in the scaling needed to reach agreement between the model and the different data sets could be the clumpy nature of the molecular gas in IC 63. Recent work has found that molecular gas and dust tend to form dense knots in the presence of an intense ultraviolet radiation field (O’Dell, 2000; Huggins et al., 2002; France et al., 2004). If we assume that such knots exist in IC 63, then the 30″ emitting region may be composed of dense clumps instead of smoothly distributed molecular gas. This could reconcile the scaling we require to bring our model into agreement with the data. The larger HUT aperture may have included several of these dense clumps, where as the smaller MDRS aperture may have picked up fewer, or simply missed the brightest of these knots. Differing contributions from dense regions in IC 63 could explain the different scale factors needed to predict the absolute flux seen in the nebular spectra.
6. Summary
We have presented far-ultraviolet spectroscopy of the emission/reflection nebula IC 63. The MDRS aperture on was used to obtain high-resolution spectra of three positions within the nebula across the 912 – 1187 Å bandpass. These data were complemented by an archival HUT spectrum of IC 63 at lower resolution, extending the wavelength coverage to beyond 1700 Å. These data confirm the presence of a population of fluorescing H2 seen in previous studies. Models of this emission have been shown to overpredict the relative strength of the shortest wavelength lines by as much as an order of magnitude. We use these data to develop a model that not only accurately describes the detailed rotational structure of the emission lines, but resolves the perceived discrepancy between the shortest and longest ultraviolet wavelengths spanned by H2. This model incorporates a realistic incident radiation field by using sounding rocket observations to calibrate a scattered light spectrum of the exciting star, Cas. Our model finds satisfactory agreement with the spectral structure seen with and finds relative consistency at all wavelengths. Our model still does not predict the correct absolute flux that is observed, and the emission lines in the spectra are broader than what would be expected from instrumental effects alone. We are addressing these problems by developing a more sophisticated H2 model that takes the finite width of the absorbing transition into account.
References
- Abgrall et al. (1993a) Abgrall, H., Roueff, E., Launay, F., Roncin, J. Y., & Subtil, J. L. 1993a, A&AS, 101, 273
- Abgrall et al. (1993b) —. 1993b, A&AS, 101, 323
- Chrysostomou et al. (1993) Chrysostomou, A., Brand, P. W. J. L., Burton, M. G., & Moorhouse, A. 1993, MNRAS, 265, 329
- Davidsen et al. (1992) Davidsen, A. F., Long, K. S., Durrance, S. T., Blair, W. P., Bowers, C. W., Conard, S. J., Feldman, P. D., Ferguson, H. C., Fountain, G. H., Kimble, R. A., Kriss, G. A., Moos, H. W., & Potocki, K. A. 1992, ApJ, 392, 264
- Duley & Williams (1980) Duley, W. W. & Williams, D. A. 1980, ApJ, 242, L179
- France et al. (2004) France, K., McCandliss, S. R., Burgh, E. B., & Feldman, P. D. 2004, ApJ, 616, 257
- Gatley et al. (1987) Gatley, I., Hasegawa, T., Suzuki, H., Garden, R., Brand, P., Lightfoot, J., Glencross, W., Okuda, H., & Nagata, T. 1987, ApJ, 318, L73
- Habart et al. (2004) Habart, E., Boulanger, F., Verstraete, L., Walmsley, C. M., & Pineau des Forêts, G. 2004, A&A, 414, 531
- Hartig et al. (1980) Hartig, G. F., Fastie, W. G., & Davidsen, A. F. 1980, Appl. Opt., 19, 729
- Huggins et al. (2002) Huggins, P. J., Forveille, T., Bachiller, R., Cox, P., Ageorges, N., & Walsh, J. R. 2002, ApJ, 573, L55
- Hummer (1962) Hummer, D. G. 1962, MNRAS, 125, 21
- Hurwitz (1998) Hurwitz, M. 1998, ApJ, 500, L67+
- Jansen et al. (1994) Jansen, D. J., van Dishoeck, E. F., & Black, J. H. 1994, A&A, 282, 605
- Karr et al. (2005) Karr, J. L., Noriega-Crespo, A., & Martin, P. G. 2005, AJ, 129, 954
- Luhman & Rieke (1996) Luhman, K. L. & Rieke, G. H. 1996, ApJ, 461, 298
- Luhman et al. (1994) Luhman, M. L., Jaffe, D. T., Keller, L. D., & Pak, S. 1994, ApJ, 436, L185
- Luhman et al. (1997) Luhman, M. L., Luhman, K. L., Benedict, T., Jaffe, D. T., & Fischer, J. 1997, ApJL, 480, L133
- McCandliss (2003) McCandliss, S. R. 2003, PASP, 115, 651
- McCandliss et al. (2003) McCandliss, S. R., France, K., Feldman, P. D., & Pelton, R. 2003, in Future EUV/UV and Visible Space Astrophysics Missions and Instrumentation. Edited by J. Chris Blades, Oswald H. W. Siegmund. Proceedings of the SPIE, Volume 4854, pp. 385-396 (2003)., 385–396
- McCandliss et al. (1994) McCandliss, S. R., Martinez, M. E., Feldman, P. D., Pelton, R., Keski-Kuha, R. A., & Gum, J. S. 1994, in Proceedings of the SPIE, Vol. 2011
- McPhate et al. (1999) McPhate, J. B., Feldman, P. D., McCandliss, S. R., & Burgh, E. B. 1999, ApJ, 521, 920
- Moos (2000) Moos, H. W. et al. 2000, ApJ, 538, L1
- O’Dell (2000) O’Dell, C. R. 2000, AJ, 119, 2311
- Rachford et al. (2002) Rachford, B. L., Snow, T. P., Tumlinson, J., Shull, J. M., Blair, W. P., Ferlet, R., Friedman, S. D., Gry, C., Jenkins, E. B., Morton, D. C., Savage, B. D., Sonnentrucker, P., Vidal-Madjar, A., Welty, D. E., & York, D. G. 2002, ApJ, 577, 221
- Sahnow (2000) Sahnow, D. J. et al. 2000, ApJ, 538, L7
- Sternberg (1989) Sternberg, A. 1989, ApJ, 347, 863
- Takami et al. (2000) Takami, M., Usuda, T., Sugai, H., Kawabata, H., Suto, H., & Tanaka, M. 2000, ApJ, 529, 268
- Witt et al. (1989) Witt, A. N., Stecher, T. P., & Boroson, T. A. an d Bohlin, R. C. 1989, ApJL, 336, L21
- Wolven et al. (1997) Wolven, B. C., Feldman, P. D., Strobel, D. F., & McGrath, M. A. 1997, ApJ, 475, 835
- Zuckerman & Gatley (1988) Zuckerman, B. & Gatley, I. 1988, ApJ, 324, 501