Early optical-IR emission from GRB 041219a: neutron-rich internal shocks and a mildly magnetized external reverse shock
Abstract
Very early optical and near infrared (IR) emission was discovered accompanying the long gamma-ray burst (GRB) 041219a. We show that the optical/IR flash tracking the gamma-ray lightcurve during the prompt emission could be understood as emission from neutron-rich internal shocks, as has been suggested by Fan & Wei. The early -band afterglow lightcurve after the prompt phase could be well-modeled as the superposition of a reverse shock and a forward shock component. The radio data also support the reverse shock interpretation.
Subject headings:
Gamma Rays: burstsISM: jets and outflows–radiation mechanisms: nonthermal1. Introduction
GRB 041219a was detected both by the IBIS (Imager on Board the INTEGRAL Satellite) detector of the INTEGRAL satellite (Gotz et al. 2004) and by the Swift Burst Alert Telescope (BAT) (Barthelmy et al. 2004). This burst distinguishes itself from other bursts in several aspects. (1) It is very bright. The 15-350 keV fluence measured by the Swift BAT was approximately (Barthelmy et al. 2004), placing it in the top few percent among the 1637 GRB events listed in the comprehensive fourth Burst and Transient Source Experiment (BATSE) catalogue (Paciesas et al. 1999). (2) The duration of prompt ray emission () is approximately 520 seconds, making it one of the longest bursts ever detected. (3) The prompt optical and infrared (IR) emission was detected to accompany the prompt ray emission (Vestrand et al. 2005; Blake et al. 2005). This is the second case since GRB 990123 (e.g., Akerlof et al. 1999). (4) The location of this burst is near the Galactic plane and in a direction with high optical extinction (Galactic coordinates , ), so that the R-band extinction is very large ( magnitudes or even larger). For this reason, no late optical afterglow has been detected. Fortunately, in the IR band, the afterglow (including that in the very early phase) has been well detected (Blake et al. 2005). The redshift is unknown. In this Letter, we assume .
The very early long-wavelength observation is very important to diagnose the outflow composition (Fan et al. 2004; Zhang & Kobayashi 2005; Fan et al. 2005)111In principle, the ejecta of GRBs may be Poynting flux dominated (see Lyutikov & Blandford 2003 and the references therein) or neutron-rich (e.g., Derishev et al. 1999; Beloborodov 2003; Pruet et al. 2003) or both (e.g., Vlahakis et al. 2003)., since the late afterglow taking place hours after the burst trigger is powered by the forward shock (FS), so that essentially all the initial information of the ejecta is lost. In this Letter, we apply our previous analyses to discuss the very early long-wavelength observation of GRB 041219a.
2. The prompt optical and near-IR flash
There has been some interest in discussing/searching for prompt long-wavelength radiation accompanying prompt rays emission even in the pre-afterglow era (e.g., Katz 1994; Schaefer et al. 1994; Wei & Cheng 1997). In the afterglow era, more theoretical attention was paid on the topic. In the standard internal shocks model, accompanying the prompt ray emission, long wavelength flashes are expected (Mészáros & Ress 1997, 1999; Fan & Wei 2004a). If there are a large amount of neutrons contained in the GRB outflow, the decayed neutron shells would provide more collisions at a larger distance from the central engine. If a burst is long enough, the neutron-rich internal shocks would give rise to detectable long wave-length flashes during the prompt ray emission phase (Fan & Wei 2004b).
In the standard internal shock model, the synchrotron-self-absorption frequency could be estimated as (e.g., Li & Song 2004) , where is the synchrotron radiation luminosity, is the comoving-frame magnetic field strength in the internal shock phase, is the typical internal shock radius, is the bulk LF of the merged two shells, is the observed variable timescale of the prompt ray lightcurve, and the convention has been adopted in cgs units here and throughout the text. For typical GRB parameters, one can see that is usually well above the optical band. This tends to suppress the optical flux. Also the spectrum is expected to have a power law index 5/2, inconsistent with the prompt IR data of GRB 041219a (see Figure. 2 of Blake et al. 2005). Although with proper adjustment of parameters, the proton-dominated internal shocks models may be able to match the observation, in this Letter we focus an alternative interpretation, i.e. the neutron-rich internal shock model (Fan & Wei 2004b).
There are good reasons to assume that a large amount of neutrons (comparable to the amount of protons) exist in the GRB ejecta (e.g., Derishev et al. 1999; Beloborodov et al. 2003; Pruet et al. 2003). In the neutron-rich internal shock model, the LFs of the proton shells are variable, so are the LFs of accompanying neutron shells. For the slow neutrons (with ) coupled with the slow proton shells, they do not interact with other materials before decaying (the typical decay radius is cm, where is the speed of light). However, if the GRB lasts long enough, the slow neutron shells ejected at earlier times would be swept successively by the faster proton shells ejected at later times. This happens in the distance range of cm, in which the slow neutron shells decay continuously. The proton shells interact with the decay products of the slow neutron shells and power detectable long wavelength prompt emission, as shown in Fan & Wei (2004b).
A detailed treatment of the process has been presented in §2 of Fan & Wei (2004b). A novel effect taken into account here is the inverse Compton (IC) cooling of the electrons because of the space-time overlapping between the proton shellneutron shell interaction region and the prompt MeV ray photon flow (e.g. Beloborodov 2005; Fan et al. 2005). The inverse Compton parameter is calculated as , where is the energy loss rate of one electron via IC scattering with the prompt ray emission, is the energy loss rate of one electron via synchrotron radiation, is the random Lorentz factor of the emitting electron, and is the magnetic energy density generated during the interaction. Since the Klein-Nishina correction is important for the IC process discussed here, we strictly use Eqs. (2.47-2.51) and Eq. (2.56) in Blumenthal & Gould (1970) to calculate . The prompt rays photon number distribution is taken as for and for , where keV is the peak energy of the observed spectrum222Given a same , the calculated results are not very sensitive to the photon spectral indices assumed., is constrained by the condition , where is the initial ray photon energy density, is the evolving bulk LF of the proton shell during the sweeping process333Notice that we have adopted the same symbols as in Fan & Wei (2004b) to keep consistency between the two papers., and is the prompt ray luminosity.
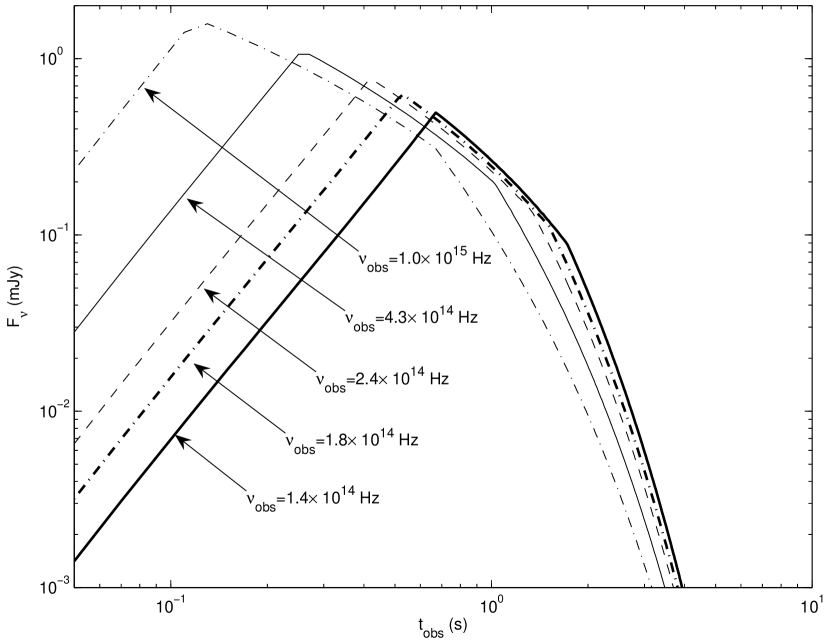
We calculated the synchrotron lightcurves for a proton shell interacting with the decay products of a series of slow neutron shells. The result is shown in Fig. 1. Following parameters have been taken: g is the rest mass of one proton shell; g is the initial rest mass of one neutron shell; ; (With these parameters, we get at the end of the interaction. This will be regarded as the intial Lorentz factor in the afterglow phase, and we will rewrite it as in §3. This matches the one found in our modeling the early band afterglow. See §3); s; cm is the luminosity distance; ; and and are the fraction of shock energy given to the shocked electrons and magnetic field, respectively. The lightcurves reach the peak as the observer frequency crosses the synchrotron-self-absorption frequency , and another break during the decaying phase marks the epoch as crosses the typical synchrotron radiation frequency. The is much smaller than that in the standard internal shock model because of the following reasons. Firstly, we have . Secondly, the forward shock upstream proton number density is much smaller than that in the standard internal shocks (see eq.[1] of Fan & Wei (2004b) for detail), which results in a smaller and weaker synchrotron emission. Finally, with the IC cooling effect taken into account, and since synchrotron emission is weaker, the parameter is large, i.e. about tens to hundreds with the typical parameters. The synchrotron radiation luminosity is further lowered by a factor .
The detected flux should be the integrated emission powered by a series of proton shells interacting with the decay trail of slow neutron shells. For Hz, the predicted flux are mJy, respectively. Such strong emission is detectable with the current telescopes, and is consistent with the optical observation of GRB 041219a when the extinction correction is taken into account (Vestrand et al. 2005). The averaged spectrum is flat, which is roughly consistent with the earliest IR band observation of GRB 041219a (Blake et al. 2005). As mentioned in Fan & Wei (2004b), the predicted long-wavelength emission is expected to be correlated with the prompt ray emission but has a s lag. This is also consistent with the tracking behavior of the prompt optical flashes (Vestrand et al. 2005). Notice that it is not our intention to fit the prompt optical and near IR emission lightcurves closely (which requires additional complicated assumptions about the central engine behavior). The main purpose of the current discussion is to indicate that the neutron-rich internal shock model suffers less constraints than the proton-dominated internal shock model, and can better account for the observed prompt optical/IR spectrum.
3. The very early near-IR afterglow
After the internal shock phase, as the fireball is decelerated by the circumburst medium, usually a pair of shocks develop (Mészáros & Rees 1997; Sari & Piran 1999). The early optical afterglow lightcurve is usually composed of the contributions from both the forward and the reverse shocks. Zhang et al. (2003) pointed out that depending on parameters, there are two types of early optical/IR lightcurves for a fireball interacting with a constant density medium (ISM), i.e. Type I (rebrightening) in which distinct reverse shock and the forward shock peaks are detectable, and Type II (flattening) in which the forward shock peak is buried beneath the reverse shock peak. The previous two strong cases of reverse shock emission (GRB 990123, Akerlof et al. 1999; and GRB 021211, Fox et al. 2003, Li et al. 2003) all belong to Type II. Visual inspection of the early IR lightcurve of GRB 021219a (Blake et al. 2005, see also Fig.2) indicates that it is a clear Type I case. Below we will model the lightcurve in detail and show that the data are indeed consistent with such an explanation.
Following the standard afterglow model for a fireball interacting with a constant density medium (e.g., Piran 1999), we write down the cooling frequency , the typical synchrotron frequency and the maximum spectral flux of the FS emission, i.e., , , , where , is the isotropic energy of the outflow, and are the fractions of the shock energy given to electrons and to magnetic fields in the forward shock, respectively, is the number density of the external medium, is the power-law distribution index of the shocked electrons. Hereafter denotes the observer’s time corrected for the cosmological time dilation effect, and is in unit of day. The superscript “f” (“r”) represent the FS (RS) emission, respectively. We assume that and the electron spectral index are essentially the same for both the FS and RS444If they are different, additional corrections are needed, see Zhang et al. (2003) and Zhang & Kobayashi (2005) for details., but we will allow different values for both regions. One reason for this assumption is that the magnetic field generated in the internal shock phase may have not been dissipated effectively in a short time, and would play a dominant role in the reverse shock region (Fan et al. 2004 and the references listed therein). In this Letter, we will denote and , where is the ratio of the magnetic field in the RS emission region to that in the FS emission region (Zhang et al. 2003). Previous analyses indicate that at least for some bursts (e.g. GRB990123 and GRB021211) the RS emission region is more magnetized than the FS region (e.g. Fan et al. 2002; Zhang et al. 2003; Kumar & Panaitescu 2003).
As shown in Fig.2 (data taken from Blake et al. (2005), only the richest -band data are plotted), the time when the RS crosses the ejecta ((1+z)) is about 30 minutes after the trigger, which is much longer than s. So, the RS is non-relativistic (e.g., Sari & Piran 1995; Kobayashi 2000; Kobayashi & Zhang 2003). Further evidence for a non-relativistic RS is the rapid increase of the early afterglow lightcurve (e.g., Kobayashi 2000; Kobayashi & Zhang 2003). , the LF of the decelerated outflow relative to the initial LF at , can be estimated by solving (e.g., Sari & Piran 1995; Fan et al. 2004) numerically. Here is the bulk LF of the shocked ejecta, is the initial bulk LF of the outflow, is the LF of the decelerated ejecta at , is the corresponding velocity (in unit of ) of the LF . For GRB 041219a, one has , so that is much smaller than 1, i.e., the RS is non-relativistic. In such a case, can be approximated as
| (1) |
The typical frequency of the RS emission is
| (2) |
Following Zhang et al. (2003), we have
| (3) |
Generally, the band flux satisfies .

Assuming , and (consistent with the gamma-ray fluence and our assumed redshift), , and can be constrained by the following two conditions. (1) At , and mJy; (2) is about 30/(1+z) minutes. We then get
| (4) |
It is interesting to see that since , we have , and . The parameter can be constrained by noticing mJy and by taking , which reads
| (5) |
which hints that the reverse shock region is mildly magnetized.
Following Fan et al. (2005), the forward-reverse shock emission has been calculated numerically. Since the RS is non-relativistic, the spreading of the ejecta (e.g. Piran 1999) has been taken into account. The fits to the band data are presented in Fig. 2. It is found that the data can be well modeled with the following parameters: , , , , , , . These are consistent with the analytical estimates above.
There are three radio data points available (Soderberg & Frail 2004; van der Horst et al. 2004a, 2004b). The 8.5GHz flux at 1.1 day is mJy, and the 4.9 GHz flux at 1.6 day and 2.6 day are 0.2mJy and 0.34mJy, respectively. By taking our best fitted parameters, the corresponding FS fluxes are mJy, respectively, too low to interpret the data. When we consider the RS contribution to the radio band (e.g. Sari & Piran 1999; Kobayashi & Zhang 2003; Gou et al. 2004), the over all corresponding fluxes become mJy, respectively, roughly matching the data. Therefore, the radio data also support the reverse-forward shock interpretation.
4. Summary & Discussion
The prompt optical/IR observations of GRB 041219a (Vestrand et al. 2005; Blake et al. 2005) offer a great opportunity to diagnose the unknown GRB ejecta composition. We have shown that the prompt optical emission tracking the gamma-ray emission profile may be consistent with the picture that the ejecta is neutron rich, and that the optical emission is powered by the proton shells interacting with the neutron decay products at a distance farther away from the central engine than the typical internal shock radius.
By modeling the band early afterglow lightcurve, we identify a reverse shock emission component, which is clearly separated from the forward shock emission component. Such a rebrightening (Type I) lightcurve has been expected by Zhang et al. (2003) to be more common if the RS is not strongly magnetized. Indeed, detailed modeling indicates that in GRB 041219a is at most mild, in contrast with GRB 990123 and GRB 021211 (e.g., Fan et al. 2002; Zhang et al. 2003; Kumar & Panaitescu 2003). This is also consistent with the neutron-rich picture conjectured in interpreting the prompt optical emission. The mild magnetization of the ejecta may be due to magnetic field generation during the internal shock phase. The radio data also support our reverse-forward shock interpretation.
It is interesting to note that for the three bursts with reverse shock identification (GRB 990123, GRB 021211 and GRB 041219a), the inferred number densities of interstellar medium are typically lower than the standard value for ISM (see also Kumar 2004) — For GRB 990123, (e.g., Wang et al. 2000; Panaitescu & Kumar 2002; Nakar & Piran 2004); For GRB 021211, (e.g., Wei 2003; Kumar & Panaitescu 2003); For the current GRB 041219a, . The reason is unclear, but certain selection effects may play a role.
References
- (1) Akerlof, C. et al. 1999, Nature, 398, 400
- (2) Barthelmy, S. et al. 2004, GCN Circ. 2874 (http://gcn.gsfc.nasa.gov/gcn/gcn3/2874.gcn3)
- (3) Beloborodov, A. M. 2003, ApJ, 588, 931
- (4) ——. 2005, ApJ, 618, L13
- (5) Blake, C. H. et al. 2005, Nature, 435, 181
- (6) Blumenthal, G. R., & Gould, R. J. 1970, Rev. Mod. Phys., 42, 237
- (7) Derishev, D. E., Kocharovsky, V. V., & Kocharovsky, V. V. 1999, ApJ, 521, 640
- (8) Fan, Y. Z., Dai, Z. G., Huang, Y. F., & Lu, T. 2002, Chin. J. Astron. Astrophys. 2, 449 (astro-ph/0306024)
- (9) Fan, Y. Z., & Wei, D. M. 2004a, MNRAS, 351, 292
- (10) ——. 2004b, ApJ, 615, L69
- (11) Fan, Y. Z., Wei, D. M., & Wang, C. F. 2004, A&A, 424, 477
- (12) Fan, Y. Z., Zhang, B., & Wei, D. M. 2005, ApJ, in press (astro-ph/0412105)
- (13) Fox, D. et al. 2003, ApJ, 586, L5
- (14) Gotz, D., Mereghetti, S., Shaw, S., Beck, M., & Borkowski, J. 2004, GCN Circ. 2866 (http://gcn.gsfc.nasa.gov/gcn/gcn3/2874.gcn3)
- (15) Gou, L. J., Mészáros, P., Abel, T. & Zhang, B. 2004, ApJ, 604, 508
- (16) Katz, J. Z. 1994, ApJ, 432, L107
- (17) Kobayashi, S. 2000, ApJ, 545, 807
- (18) Kobayashi, S., & Zhang, B. 2003, ApJ, 582, L75
- (19) Kumar, P. 2004, talk given at 22nd Texas Symposuium on Relativistic Astrophysics, Stanford University, Dec. 2004
- (20) Kumar, P., & Panaitescu, A. 2003, MNRAS, 346, 905
- (21) Li, Z., & Song, L. M. 2004, ApJ, 608, L17
- (22) Li, W. D., Filippenko, A. V., Chornock, R., & Jha, S. 2003, ApJ, 586, L9
- (23) Lyutikov, M., & Blandford, R. 2003 (astro-ph/0312347)
- (24) Mészáros, P., & Rees, M. J. 1997, ApJ, 476, 232
- (25) ——. 1999, MNRAS, 306, L39
- (26) Nakar, E., & Piran, T. 2004, MNRAS, 353, 647
- (27) Paciesas, W. et al. 1999, ApJS, 122, 465
- (28) Panaitescu, A., & Kumar, P. 2002, ApJ, 571, 779
- (29) Piran, T. 1999, Phys. Rep., 314, 575
- (30) Pruet, J., Woosley, S. E., & Hoffman, R. D. 2003, ApJ, 586, 1254
- (31) Sari, R., & Piran, T. 1995, ApJ, 455, L143
- (32) ——. 1999, ApJ, 517, L109
- (33) Schaefer, B. E. et al. 1994, ApJ, 422, L71
- (34) Soderberg, A. M., & Frail, D. A. 2004, GCN Circ. 2881 (http://gcn.gsfc.nasa.gov/gcn/gcn3/2881.gcn3)
- (35) van der Horst, A. J., Rol, E., & Strom, R. 2004a, GCN Circ. 2894 (http://gcn.gsfc.nasa.gov/gcn/gcn3/2894.gcn3)
- (36) ——. 2004b, GCN Circ. 2895 (http://gcn.gsfc.nasa.gov/gcn/gcn3/2895.gcn3)
- (37) Vestrand, W. T. et al. 2005, Nature, 435, 178
- (38) Vlahakis, N., Peng, F., & Königl, A. 2003, ApJ, 694, L23
- (39) Wang, X. Y., Dai, Z. G., & Lu, T. 2000, MNRAS, 319, 1159
- (40) Wei, D. M. 2003, A&A, 402, L9
- (41) Wei, D. M., & Cheng, K. S. 1997, MNRAS, 290, 107
- (42) Zhang, B., Kobayashi, S., & Mészáros, P. 2003, ApJ, 595, 950
- (43) Zhang, B., & Kobayashi, S. 2005, ApJ, in press (astro-ph/0404140)