The origin of intergalactic metals around Lyman-break galaxies
Abstract
Theoretical and observational arguments suggest that the intergalactic medium (IGM) might have been polluted with metals produced by early star formation. In this scenario, Lyman-break galaxies (LBGs) at redshift are likely to be surrounded by old metal bubbles, relics of an era when the characteristic mass of galaxies was small and gas retainment more difficult. We find that pregalactic enrichment of the IGM from dwarf galaxies at can quantitatively explain the high cross-correlation between C systems and LBGs observed at . The reason is twofold. First, both LBGs and high- dwarfs are biased tracer of the mass distribution and form from exceptionally high density fluctuations which are strongly clustered. Second, the action of gravity tends to increase the spatial association between metal bubbles and LBGs. Our analysis shows that, in order to match the abundance of C systems observed at , the metal bubbles generated by high- dwarfs must have comoving sizes of kpc. We conclude that the observed galaxy–C spatial association needs not to be generated by late “superwinds” from LBGs.
Subject headings:
cosmology: theory – galaxies: high-redshift – intergalactic medium – quasar: absorption lines1. Introduction
Quasar absorption lines constitute a fossil record that holds the clues to the exchange of mass, metals, and energy between active galactic nuclei, protogalaxies, and the intergalactic medium (IGM). The distribution of metals in the IGM is highly inhomogeneous, with a global cosmic abundance at of [C/H] for gas with overdensities (Schaye et al. 2003). The epoch at which this cosmic enrichment occurred is uncertain, and so is the nature of the galaxies responsible for seeding the IGM with nuclear waste. The extent of metal pollution seem to require galaxy-scale outflows to overcome the gravitational potential of their host halos, and enriched material to be ejected far away from the density peaks where large galaxies form, gas cools, and star formation takes place.
Observationally, C absorbers and Lyman-break galaxies (LBGs) at are found to be spatially correlated (Adelberger et al. 2003, hereafter ASSP). The mean number of LBGs within a comoving distance from a detectable C system () equals one for Mpc. This is much smaller than the value expected for a random distribution ( Mpc, ASSP). Stronger C systems seem to be even more closely associated with LBGs ( Mpc for ). At the same time, the Lyabsorption produced by the IGM within Mpc from an LBG appears to be systematically reduced with respect to random locations. Moreover, high-resolution spectra reveal that LBGs have high star formation rates and strong winds with outflow velocities exceeding several hundred kilometers per second. All these facts led ASSP to argue that metal-rich “superwinds” from LBGs are responsible for distributing the product of stellar nucleosynthesis on Mpc scales.
In this Letter we argue that this interpretation may be an oversimplication of a far more complex physical picture. The starting point of our investigation is the fact that LBGs are highly biased tracers of the underlying mass-density field. The observed clustering amplitude suggests that LBGs reside in dark-matter halos with mass at (Porciani & Giavalisco 2002; Adelberger et al. 2005). In hierarchical cosmogonies, these halos are expected to form within overdense regions (extending for a few Mpc) which are likely to be pre-enriched by subgalactic objects at much higher redshifts. The ejection of supernova debris from the shallow potential wells of collapsed, rare density fluctuations is, in fact, expected to lead to an early era of metal pollution and preheating in biased regions of the IGM (e.g. Tegmark et al. 1993; Madau et al. 2001; Scannapieco et al. 2002; Thacker et al. 2002). We show that pregalactic enrichment from dwarf galaxies at can quantitatively explain both the observed close spatial coincidence between C systems and LBGs and the abundance of C absorbers at . Throughout this paper we will adopt a flat CDM background cosmology with parameters (.
2. Basic theory
The properties of the dark-matter halo population as a function of redshift can be approximately computed with the excursion-set formalism (Bond et al. 1991). In this approach, the halo mass function is determined by following the random walk of the linear density contrast, , as a function of spatial resolution (parameterized by the mass variance, ) and measuring the rate with which different trajectories first upcross a given threshold value, . Here is the linear overdensity of a top-hat perturbation at collapse ( in a Einstein-de Sitter universe) and is the linear growth factor of density perturbations, normalized such that .
Porciani et al. (1998) have shown that the excursion-set formalism can be also used to derive the clustering properties of dark-matter halos in the Lagrangian coordinate system (which gives the positions of proto-halo centers in the linear density field, formally at ). This is obtained accounting for the spatial coherence of the linear density field and simultaneously following a number of correlated random walks associated with different spatial locations. More recently, Scannapieco & Barkana (2002) generalized these results to halos collapsing at different epochs. Here we use their analytical approximation to compute the Lagrangian correlation function , between halos of mass forming at and halos of mass forming at . Hereafter, will denote the mass of the host-halo of an LBG forming at while the free-parameters and will characterize subgalactic halos collapsing at earlier epochs.
In order to compare theory and observations, one needs to compute the halo clustering properties in the Eulerian coordinate system (in which galaxies are observed). The mapping of halo positions from Lagrangian to Eulerian space depends on the gravity driven dynamics of the background mass density field (Catelan et al. 1998). Consider the evolution of a spherically-symmetric shell of Lagrangian radius centered onto a halo of mass . Its Eulerian position at redshift only depends on the mean overdensity within it: (for the sheared case see Catelan et al. 1998). Using the spherical top-hat model it is possible to relate the non-linear density contrast to its linearly extrapolated counterpart , as (Pavlidou & Fields 2004). This implies . What is the probability distribution of the linear overdensity within a shell of given Lagrangian size centered onto an halo of mass ? This can be easily computed using the excursion-set model. The conditional probability that a trajectory assumes the value when smoothed on the scale (corresponding to the mass variance ), given that it will first upcross the threshold at the mass variance (corresponding to the mass ), is
| (1) |
where
| (2) |
is the probability density of trajectories at , and
| (3) |
denotes the probability distribution of first upcrossings. The conditional probability distribution of given a Lagrangian separation can then be written as
| (4) | |||||
where , denotes the distribution given in equation (1), and is the Dirac delta function.
The mean number of objects (per unit length) with mass located at distance from a halo of mass is then
| (5) |
with the Lagrangian radius of the halo of mass and the mean comoving density of the universe. For a population of halos with an extended range of masses at , this becomes
| (6) |
Note that, by redshift , halos with mass and have merged with the “central” object of mass . The mass function of the remaining halos is , where indicates the mean number of halos which ended up within a single halo (this is in good agreement with Lacey & Cole 1993). From the definition of the Eulerian cross-correlation, we then obtain
| (7) |
3. Results
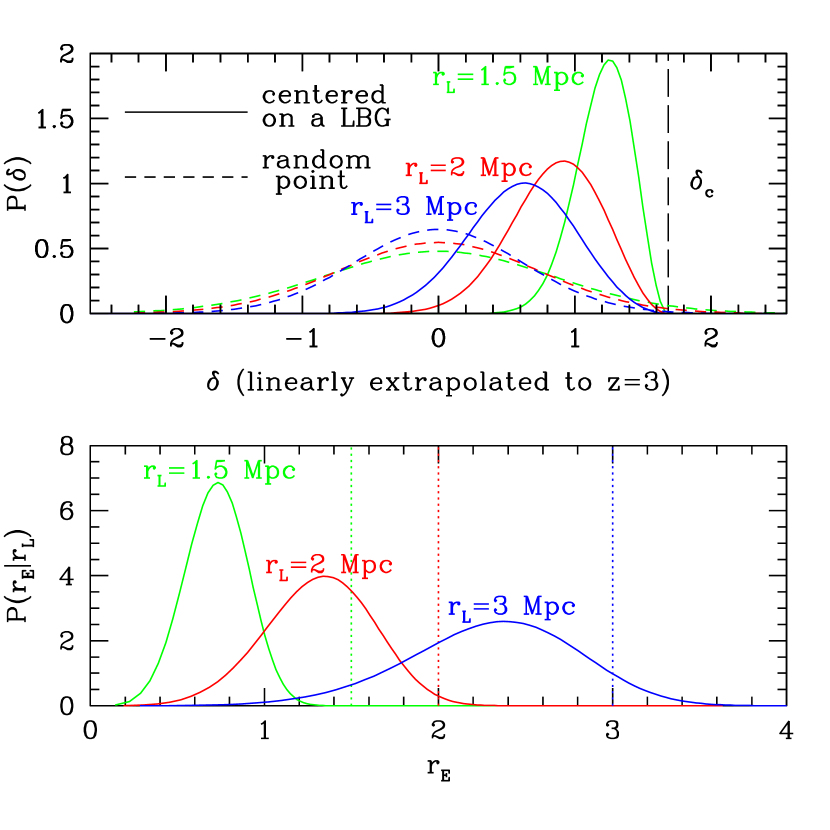
We can now turn to the main point of this Letter. Can the observed correlation between C absorbers and LBGs at be explained by SN-driven outflows from low mass systems at much higher redshifts? Figure 1 shows that LBGs form within overdense regions extending for a few comoving Mpc. Assume that these biased regions have been already polluted by protogalaxies, i.e. that C systems are associated with metal “bubbles” that have been expelled from halos of mass at some epoch between and .111Note that, at redshift , most of the halos of mass have lost their identity by merging into larger halos (of mass ). We do not follow the details of this process and assume that all the C bubbles preserve their identity. Since the bubble size is small with respect to the spatial separations achievable by observations, this assumption does not alter our conclusions. Most of the bubbles lying in the vicinity of the formation site of an LBG will be driven by gravity towards the forming galaxy thus producing the observed spatial association (see bottom panel in Fig. 1).
In this scenario, the projected cross-correlation function between LBGs and the bubble centers is:
| (8) |
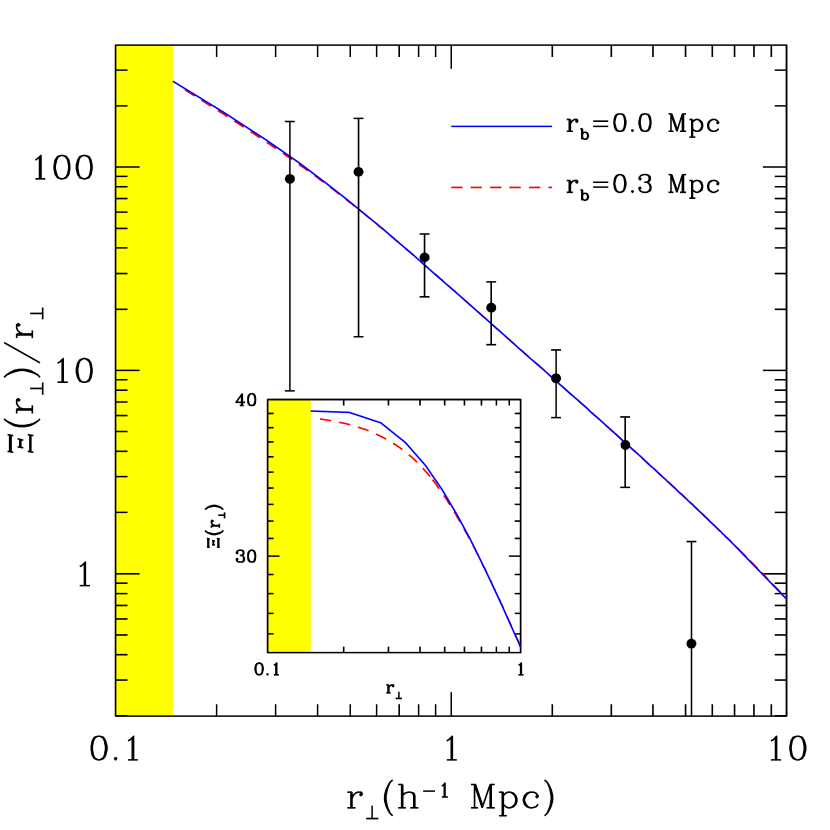
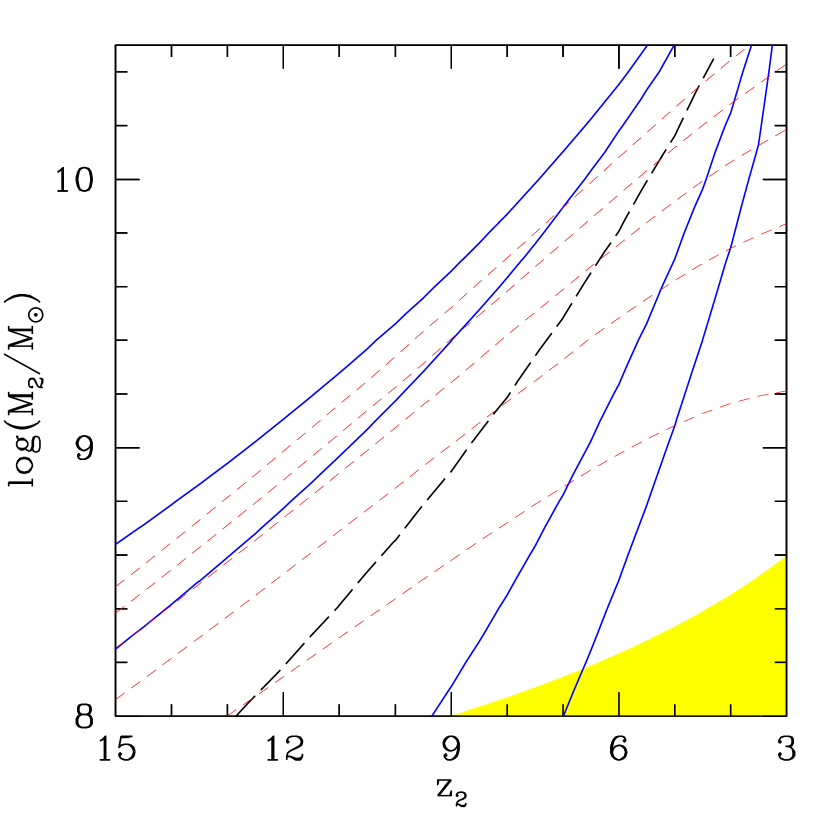
where denotes the component of the Eulerian separation in the plane of the sky. For simplicity, we assume that each halo of mass gives origin to a spherical C bubble of comoving radius . The cross-correlation function between LBGs and C systems is then obtained by convolving the correlation function in equation (8) with a 2-dimensional top-hat window function (see the Appendix in Porciani & Giavalisco 2002). In Figure 2, we show that the free parameters of our model can be tuned to reproduce the correlation function measured by ASSP. Here we consider a unit logarithmic interval in mass for . The best-fitting solution is not unique: models with values of (, ) linked by the equation reproduce the data with equal accuracy (right panel in Fig. 2). This corresponds to perturbations with . In the redshift interval , ranges from 2 to 2.7, i.e. with increasing rarer and rarer density fluctuations are required to pollute the surroundings of LBGs in order to match the observed . Note that massive LBGs at corresponds to peaks, i.e. the dwarf galaxies that are the source of C absorption around LBGs must have been equally or more biased tracers of the mass distribution than the LBGs themselves. These high- halos form first and, most likely, inhibit star formation (and thus the production of new metal bubbles) in lower density peaks which collapse at a more recent epoch (Thacker et al. 2002).
Figure 2 also shows that the clustering data by ASSP cannot constrain . Winds from star-forming low-mass systems at are expected to sweep up regions of the IGM of comoving size kpc (Mori et al. 2002; Furlanetto & Loeb 2003) while has been measured for separations Mpc where the bubble size leaves no imprint. We thus constrain by comparing the observed mean number of C absorbers per unit redshift with the expectations from our model. From Songaila (2001), we infer that for C systems with at . This corresponds to a bubble size of the order of 100 comoving kpc and implies that has to increase when one moves towards lower redshifts along the degeneracy line (see Fig. 2). Thus enriched outflows of size kpc around halos at (or of size kpc around halos at ) might explain both the mean absorption-line density and the LBG–C cross-correlation observed at redshift 3.
4. Discussion
In hierarchical cosmologies, LBGs represent only the tail end of a larger population of pregalactic starbursts that formed at much higher redshifts. The metal pollution of the IGM may then have started at early times, perhaps by the same sources responsible for hydrogen reionization. In “pregalactic enrichment” scenarios, LBGs are expected to form within biased regions of the IGM (as indicated by their strong clustering), which are the sites of previous star formation and enrichment. In this Letter we showed that the LBG–C cross-correlation function measured by ASSP can be explained by outflows from dwarf galaxies () collapsing at . These originate from density peaks with (equally or more biased than the LBGs themselves) and are gravitationally pulled towards the LBG formation sites. Note that, assuming that LBGs are hosted by halos with , our model automatically reproduces also the observed correlation function of LBGs (Porciani & Giavalisco 2002; Adelberger et al. 2005). Contrary to previous beliefs, our results then indicate that the observed coincidence between LBGs and C systems does not necessarily imply that the metals observed in the IGM at were driven out of massive LBGs by a superwind.
Typical LBGs seem to generate gas outflows with velocities in the range (ASSP). Material moving at a constant speed of for 300 Myr can only cross 0.7 comoving Mpc at . Realistic SN-driven winds will slow down as they physically displace baryons in the IGM, and can propagate out to Mpc only if they are able to tap 100% of the available SN energy (e.g. Croft et al. 2002). The association between LBGs and the weakest metal line absorbers cannot then be readily explained by superwinds. Moreover, while the distribution of heavy elements in the Lyforest shows a positive gradient with overdensity, there is little evolution of the total metal content of the IGM over the redshift range 1.5–5 (Schaye et al. 2003; Pettini et al. 2003; Songaila 2001), as expected if most of the intergalactic metals were already in place at the highest currently observable redshifts. All this provides supporting evidence for our proposed scenario where SN-driven winds from a biased population of subgalactic halos at very high redshift pollute the regions surrounding LBGs with metals. This does not require the winds to propagate to large distances. Comoving metal bubbles of kpc expelled by halos of at are sufficient to explain the observed abundance of C systems at .
It is fair to point out at this stage that the initial epochs of the galaxy formation process are currently only poorly understood. N-bodyhydrodynamical simulations of CDM cosmogonies have convincingly shown that the IGM is expected to fragment into bound structures at early times, but are much less able to predict the efficiency with which gravitationally collapsed objects lit up, reionized, and enriched the universe at the end of the “dark ages”. Still, from the arguments presented above, it would seem unwise to use the spatial association between C absorbers and LBGs and draw far-reaching conclusions on the extent of galactic superwinds and the direct impact of LBGs on the Lyforest. Uncovering the relative contributions of LBGs and young dwarfs to the pollution of the IGM may prove difficult. Metals ejected during an early episode of star formation may be seen in absorption against bright background sources such as rare quasars or gamma-ray bursts at (Furlanetto & Loeb 2003). This, however, requires high-resolution spectroscopy of faint sources in the near-IR and may have to wait for the James Webb Space Telescope. On the other hand, old wind bubbles may have different abundance patterns than young winds from LBGs. As recently pointed out by Cen et al. (2004), the gaseous relics of an era when the characteristic mass of galaxies was small, gas retainment more difficult, and metal recycling more limited, are expected to contain lower ratios of secondary (e.g. Nitrogen) to primary (e.g. Carbon, Oxygen) metals. For instance, theoretical yields from pair-instability SNe originating from massive Population III stars are characterized by large Si/C ratios (Heger & Woosley 2002). Tests relying on measurements of relative metal abundances at high-, however, are made impractical by the uncertainties in the ionization corrections and the lack of information regarding the stellar initial mass function.
References
- (1) Adelberger, K. L., Steidel, C. C., Pettini, M., Shapley, A. E., Reddy, N. A., & Erb, D. K. 2005, ApJ, 619, 697
- (2) Adelberger, K. L., Steidel, C. C., Shapley, A. E., Pettini, M., 2003, ApJ, 584, 45 (ASSP)
- (3) Bond, J. R., Cole, S., Efstathiou, G., Kaiser, N., 1991, ApJ, 379, 440
- (4) Catelan, P., Lucchin, F., Matarrese, S., Porciani, C., 1998, MNRAS, 297, 692
- (5) Cen, R., Nagamine, K., & Ostriker, J. P. 2004, ApJ, submitted (astro-ph/0407143)
- (6) Croft, R. A. C., Hernquist, L., Springel, V., Westover, M., & White, M. 2002, ApJ, 580, 634
- (7) Furlanetto, S. R., & Loeb, A. 2003, ApJ, 588, 18
- (8) Gnedin, N. Y., & Ostriker, J. P. 1997, ApJ, 486, 581
- (9) Heger, A., & Woosley, S. E. 2002, ApJ, 567, 532
- (10) Lacey, C., & Cole, S. 1993, MNRAS, 262, 627
- (11) Madau, P., Ferrara, A., & Rees, M. J. 2001, ApJ, 555, 92
- (12) Mori, M., Ferrara, A., & Madau P. 2002, ApJ, 571, 40
- (13) Pettini, M., Madau, P., Bolte, M., Prochaska, X., Ellison, S., & Fan, X. 2003, ApJ, 594, 695
- (14) Porciani, C., Giavalisco, M., 2002, ApJ, 565, 24
- (15) Porciani, C., Matarrese, S., Lucchin, F., Catelan, P., 1998, MNRAS, 298, 1097
- (16) Scannapieco, E., Barkana, R., 2002, ApJ, 571, 585
- (17) Scannapieco, E., Ferrara, A., & Madau, P. 2002, ApJ, 574, 590
- (18) Schaye, J., Aguirre, A., Kim, T.-K., Theuns, T., Rauch, M., & Sargent, W. L. W. 2003, ApJ, 596, 768
- (19) Songaila, A. 2001, ApJ, 561, L153
- (20) Tegmark, M., Silk, J., & Evrard, A. 1993, ApJ, 417, 54
- (21) Thacker, R. J., Scannapieco, E., & Davis M. 2002, ApJ, 581, 836