CCD photometry and membership segregation of the open cluster NGC 2548; Gaps in the Main Sequence of open clusters. ††thanks: Tables 3, 4 and 5 are only available in electronic form at the CDS via anonymous ftp to cdsarc.u-strasbg.fr (130.79.128.5) or via http://cdsweb.u-strasbg.fr/cgi-bin/qcat?J/A+A/
Deep CCD photometry in the intermediate-band system is presented for the cluster NGC 2548 (M 48). A complete membership analysis based on astrometric and photometric criteria is applied. The photometric analysis of a selected sample of stars yields a reddening value of = 0.060.03, a distance modulus of = 9.30.5 (725 pc) and a metallicity of [Fe/H] = 0.240.27. Through isochrone fitting we find an age of = 8.60.1 (400 Myr). Our optical photometry and from 2MASS are combined to derive effective temperatures of cluster member stars. The effective temperature distribution along the main sequence of the cluster shows several gaps. A test to study the significance of these gaps in the main sequence of the HR diagram has been applied. The method is also applied to several other open clusters (Pleiades, Hyades, NGC 1817 and M 67) to construct a sequence of metallicities and ages. The comparison of the results of each cluster gives four gaps with high significance (one of them, centred at 4900 K, has not been previously reported).
Key Words.:
Galaxy: open clusters and associations: individual: NGC 2548 – Techniques: photometry – Astrometry – Methods: observational, data analysis, statistical – Stars: Hertzsprung-Russell (HR) and C-M diagrams1 Introduction
The open cluster NGC 2548 (C0811-056), also known as M 48, in Hydra (=, ) with an estimated distance of 630 pc (Pesch pesch (1961)) or 530 pc (Clariá Claria (1985)), is an intermediate-age open cluster, around = 8.5 (Lyngå lynga (1987)), with a slightly poorer CN abundance than the giants of the Hyades but significantly richer than the K giants of the solar neighborhood (Clariá Claria (1985); Twarog et al. Twa (1997)). It has been very poorly studied in spite of being an extended object with an apparent diameter of (Trumpler Trum (1930)) or even (Collinder Coll (1931)) and brilliant enough to be in the Messier list (XVIII century) as number 48 (Messier mess (1850)). It was even considered inexistent for several years due to the fact that Messier quoted its coordinates with an error of . Rider et al. (Rider (2004)) gives photometry in the Sloan system with a magnitude limit 18. A recent study by Wu et al. (Wu05 (2005)) gives BATC photometry in 13 filters. Radial velocities have been studied by Geyer & Nelles (GeNe (1985)) with a focal reduced spectrograph. They give data for 23 stars but with a very low quality. The only quality measurement is from Wallerstein et al. (Waller (1963)) of star WEBDA 1560.
This study of NGC 2548 is part of a series of astrometric and photometric analyses of open clusters that follows already published results on NGC 1817 (Balaguer-Núñez et al. 2004a , 2004b ) and that will be completed with a study of M 67 (Balaguer-Núñez et al. Bal05 (2005)).
Absolute proper motions of 501 stars within a 16 16 area in the NGC 2548 region, from automatic MAMA measurements of 10 plates taken with the double astrograph at Zô-Sè station of Shanghai Observatory, were studied by our group (Wu et al. Wu (2002), hereafter Paper I).
In this paper we discuss the results of a deep CCD photometric study of NGC 2548, covering an area of 34′34′ down to 22. Section 2 contains the details of the CCD observations and their reduction and transformation to the standard system. In Sect. 3 we discuss a new astrometric membership segregation based on the comparison between parametric and non-parametric approaches applied to the proper motions from Paper I. In Sect. 4 we discuss the colour-magnitude diagram and identify the sample of candidate cluster members using astrometric as well as photometric criteria. Section 5 contains the derivation of the fundamental cluster parameters of reddening, distance, metallicity and age. In Sect. 6 we calculate effective temperatures and study the significance of gaps in the main sequence. The method is also applied to our results on NGC 1817 and NGC 2682 (M 67) and to the well-studied Hyades and Pleiades clusters, allowing us to test the presence of the gaps as a function of age and metallicity. Section 7 summarizes our conclusions.
2 The data
2.1 Observations
Deep Strömgren CCD photometry of the area was performed at the Calar Alto Observatory (Almería, Spain) in January 1999 and January 2000 using the 1.23 m telescope of the Centro Astronómico Hispano-Alemán (CAHA) and in January 1999 and February 2000 using the 1.52 m telescope of the Observatorio Astronómico Nacional (OAN). Further data were obtained at the Observatorio del Roque de los Muchachos (ORM, La Palma, Canary Islands, Spain) in February 2000 using the 2.5 m Isaac Newton Telescope (INT) of ING (equipped with the Wide-Field Camera, WFC), and in December 1998 and February 2000 using the 1 m Jakobus Kapteyn Telescope (JKT) of ING, with the filter. The poor quality of the images obtained in the 1998/99 runs and in the OAN 2000 observations, due to adverse meteorological conditions, prevented us from making use of the data collected during those nights. A log of the observations with the total number of frames, exposure times and seeing conditions is given in Table LABEL:log.
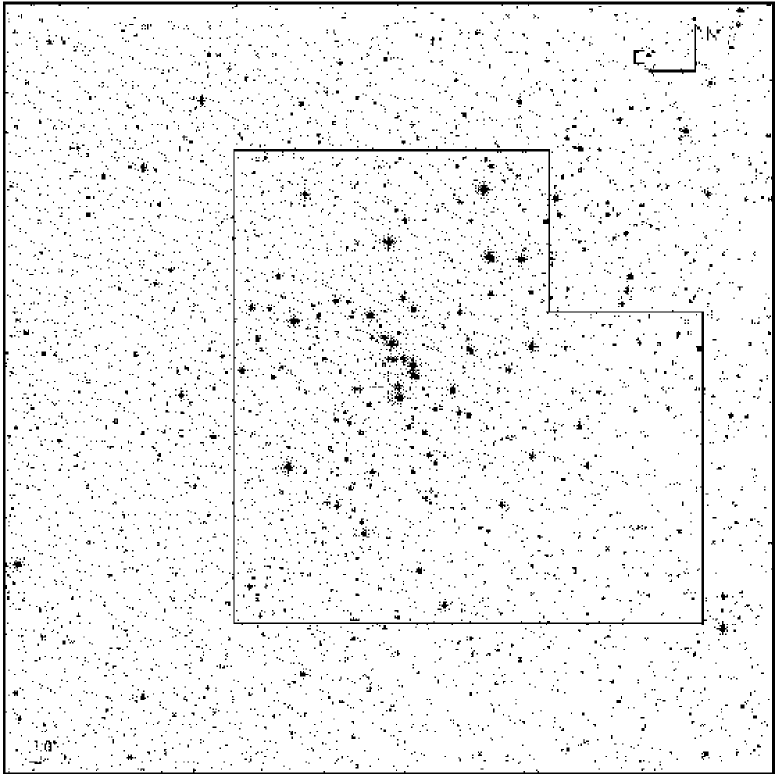
We obtained photometry for a total of 4806 stars in an area of 34′34′ around NGC 2548, down to a limiting magnitude 22. The area covered by the observations is shown in the finding chart of the cluster (Fig. 1). Due to the lack of filter at the WFC-INT, it was only possible to measure it at the JKT and CAHA telescopes, thus limiting the spatial coverage with this filter. Only 283 stars have values. Of those only 253 have values of the rest of the Strömgren filters.
| Telescope | Date | Seeing() | n. of frames | Exp. | Times | () | ||
| 1.23 m CAHA | 1999/01/12-15 | (1) | 13 | 1900 | 800 | 400 | 400 | 2000 |
| 1.23 m CAHA | 2000/01/05-10 | 1.1 | 21 | 2200 | 1400 | 900 | 800 | 1400 |
| 1.52 m OAN | 1999/01/13-16 | (1) | 15 | 1900 | 800 | 400 | 400 | 2000 |
| 1.52 m OAN | 2000/02/07-14 | (1) | 5 | - | - | - | - | 1400 |
| 1 m JKT | 1998/12/11-14 | (1) | 26 | 2000 | 1200 | 800 | 700 | 1200 |
| 1 m JKT | 2000/02/02-06 | 1.1 | 18 | - | - | - | - | 2000 |
| 2.5 m WFC-INT | 2000/02/02-03 | 1.3 | 17 | 2000 | 2000 | 1200 | 500 | - |
(1) Poor weather conditions. Images not used in the final data.
Beside long, deep exposures, additional shorter exposures were obtained in order to avoid saturation of the brightest stars.
2.2 Reduction and transformation to standard system
The reduction of the photometry is explained at length in Balaguer-Núñez et al. (2004b ). Our general procedure has been to routinely obtain twilight sky flats for all the filters and a sizeable sample of bias frames (around 10) before and/or after every run. Flat fields are typically fewer in number, from five to ten per filter. Two or three dark frames of 2000 s were also taken. IRAF111IRAF is distributed by the National Optical Astronomy Observatories, which are operated by the Association of Universities for Research in Astronomy, Inc., under cooperative agreement with the National Science Foundation. routines were used for the reduction process. The bias level was evaluated individually for each frame by averaging the counts of the most stable pixels in the overscan areas. The 2-D structure of the bias current was evaluated from the average of a number of dark frames with zero exposure time. Dark current was found to be negligible in all the cases. Flatfielding was performed using sigma clipped, median stacked, dithered twilight flats.
Our fields are not crowded. Thus, synthetic aperture techniques provide the most efficient measurements of relative fluxes within the frames and from frame to frame. We used the appropiate IRAF packages, and DAOPHOT and DAOGROW algorithms (Stetson Stet87 (1987), Stet90 (1990)). We analyzed the magnitude growth curves and determined the aperture correction with the IRAF routine MKAPFILE.
For the WFC images from the INT, we employed the pipeline specifically developed by the Cambridge Astronomical Survey Unit. The process bias subtracts, gain corrects and flatfields the images. Catalogues are generated using algorithms described in Irwin (Irw (1985)). The pipeline gives accurate positions in right ascension and declination linked to the USNO-2 Catalogue (Monet et al. USNO2 (1998)), and instrumental magnitudes with their corresponding errors. A complete description can be found in Irwin & Lewis (Irwin (2001)) and in http://www.ast.cam.ac.uk/~wfcsur/index.php.
The coefficients of the instrumental-to standard transformation equations were computed by a least squares method using the instrumental magnitudes of the standard stars and their standard magnitudes and colours in the system. Up to 68 standard stars from the cluster M 67 (Nissen et al. Nissen (1987)) were observed depending on the size of the field. Four to six short exposures in every filter were taken every night with a magnitude limit of =18. Those standard stars with residuals greater than 2 were rejected. Typically that involves a 10-15% of the standard stars, mainly variables from the M 67 field. The reduction was performed for each night independently and in two steps. The first step is to determine the extinction coefficients for each passband from the standard stars. With the extinction coefficients fixed, the transformation coefficients to the standard system were fitted.
The mean errors as a function of apparent visual magnitude are given in Table 2 for the NGC 2548 stars.
| range | ||||||||||
|---|---|---|---|---|---|---|---|---|---|---|
| 8- 9 | 3 | 0.019 | 3 | 0.028 | 2 | 0.016 | 2 | 0.002 | 2 | 0.017 |
| 9-10 | 19 | 0.012 | 19 | 0.011 | 19 | 0.013 | 16 | 0.019 | 5 | 0.003 |
| 10-11 | 25 | 0.014 | 25 | 0.016 | 25 | 0.016 | 24 | 0.010 | 6 | 0.009 |
| 11-12 | 32 | 0.012 | 31 | 0.013 | 31 | 0.018 | 31 | 0.016 | 10 | 0.030 |
| 12-13 | 45 | 0.012 | 43 | 0.013 | 43 | 0.016 | 43 | 0.011 | 12 | 0.017 |
| 13-14 | 71 | 0.012 | 71 | 0.015 | 69 | 0.020 | 69 | 0.017 | 17 | 0.027 |
| 14-15 | 152 | 0.012 | 152 | 0.023 | 146 | 0.029 | 146 | 0.030 | 29 | 0.016 |
| 15-16 | 260 | 0.015 | 260 | 0.034 | 259 | 0.047 | 251 | 0.047 | 42 | 0.025 |
| 16-17 | 380 | 0.022 | 380 | 0.043 | 376 | 0.061 | 360 | 0.063 | 53 | 0.033 |
| 17-18 | 514 | 0.030 | 514 | 0.035 | 501 | 0.043 | 468 | 0.043 | 51 | 0.036 |
| 18-19 | 639 | 0.027 | 639 | 0.028 | 592 | 0.031 | 477 | 0.032 | 8 | 0.046 |
| 19-20 | 752 | 0.012 | 752 | 0.015 | 702 | 0.022 | 383 | 0.038 | ||
| 20-21 | 859 | 0.023 | 859 | 0.028 | 662 | 0.048 | 160 | 0.052 | ||
| 21-22 | 763 | 0.049 | 763 | 0.063 | 262 | 0.089 | 21 | 0.082 | ||
| 22-23 | 222 | 0.095 | 222 | 0.122 | 28 | 0.139 | ||||
| Total | 4736 | 4733 | 3717 | 2451 | 235 | |||||
Table 3 lists the data for all 4806 stars in a region of 34′34′ around the open cluster NGC 2548 (Fig. 1). Star centres are given in the frame () and equatorial (,) coordinates. An identification number was assigned to each star following the order of increasing right ascension. Column 1 is the ordinal star number; columns 2 and 3 are and ; columns 4 and 5 are the respective , coordinates in arcmin; columns 6 and 7 are the and its error, 8 and 9 the magnitude and its error, 10 and 11 the and its error, 12 and 13 the and its error, and 14 and 15 the and its error. In column 16, stars considered candidate members (see Sect. 4.1.) are labelled ’M’, while those classified as non-members show the label ’NM’.
2.3 Comparison with previous photometry
Only three stars in the NGC 2548 area have been previously studied using Strömgren photometry (WEBDA 0366, 1560, 2156). Unfortunately, none of them is inside the area covered by our photometry. Only one of them (WEBDA 1560) is considered a cluster member from our astrometry and will be studied in Sect. 5.
The magnitude derived from the filter can be compared with the published broadband data. There are 30 stars in common with Pesch (pesch (1961)). The corresponding mean difference in , in the sense ours minus Pesch’ is 0.010.03.
Transformations between and from several authors (see Moro & Munari, ADPS (2000)) fails to cover the whole range under study. We can find a linear relation between the two indices: = (1.6320.031), =30. The standard deviation of the residuals about the mean relation is 0.048, where the typical uncertainty in is 0.02 and in is 0.016.
3 Astrometric analysis
Paper I gives absolute proper motions of 501 stars within a 16 16 area in the NGC 2548 region up to 14, from automatic MAMA measurements of 10 plates and a maximum epoch difference of 82 years. Membership determination is calculated in Paper I with a 9-parametric Gaussian model and a list of stars with a probability higher than 0.7 gives 165 cluster members.
NGC 2548 is a very extended object with a complex structure with a double core, prolate shape and a tidal tail with a clump (Bergond et al. Bergond (2001)). It has been suggested that this secondary clump is associated with the last strong disk shock that occurred between 20 and 40 Myr ago. Confirmation of members at large radii will trace the distribution of stars that are currently leaving the cluster. This will help to constrain models of the tidal disruption of open clusters.
To complement the cluster/field segregation analysis of the astrometry from Paper I we have applied a non-parametric method to the proper motion data, as explained in Balaguer-Núñez et al. (2004a ). In the non-parametric approach we are able to differenciate the cluster population without the need for any a priori knowledge. Following Galadí-Enríquez et al. (gala2 (1998)), we can perform an empirical determination of the probability density functions (PDFs) evaluating the observed local density in each node of a two-dimensional grid in the vector point diagram (VPD), with a normal circular kernel. The smoothing parameter (Gaussian dispersion) is chosen using Silverman’s rule (Sil (1986)). The procedure was tested for several subsamples applying different proper motion cutoffs. Satisfactory results are obtained with a proper motion cutoff of 15 mas yr-1.
The empirical frequency function determined from the VPD corresponding to the area occupied by the cluster is made up of two contributions: cluster and field. To differenciate the two populations we need to estimate the field distribution. For this purpose, we studied the VPD for the plate area outside a circle centered on the cluster. The centre of the cluster was chosen as the point of highest spatial density. We did tests with circles of very different radii, searching a reasonable tradeoff between cleanness (absence of a significant number of cluster members) and signal-to-noise ratio (working area not too small). The kernel density estimator was applied in the VPD to these data, yielding the empirical frequency function, for a grid with cell size of 0.2 mas yr-1, well below the proper motion errors.
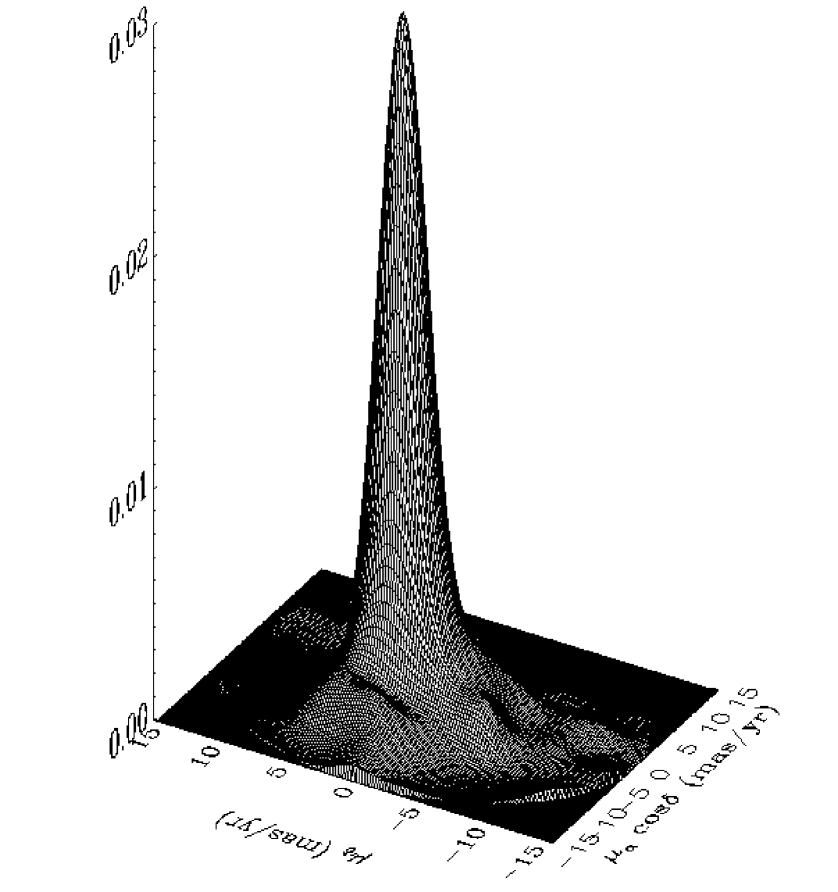
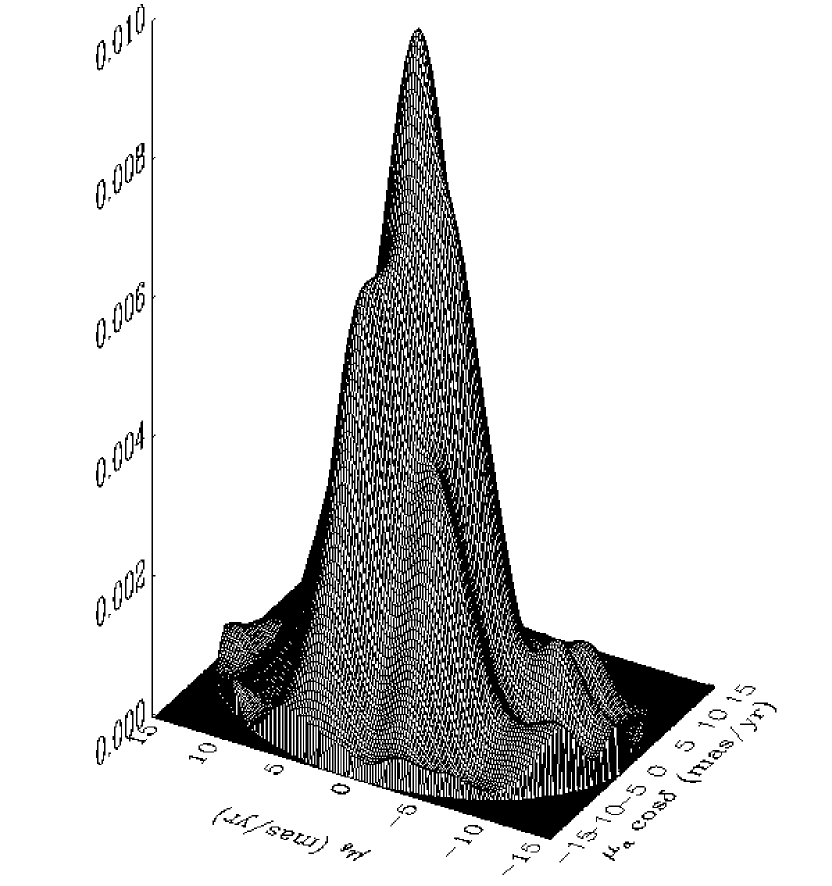
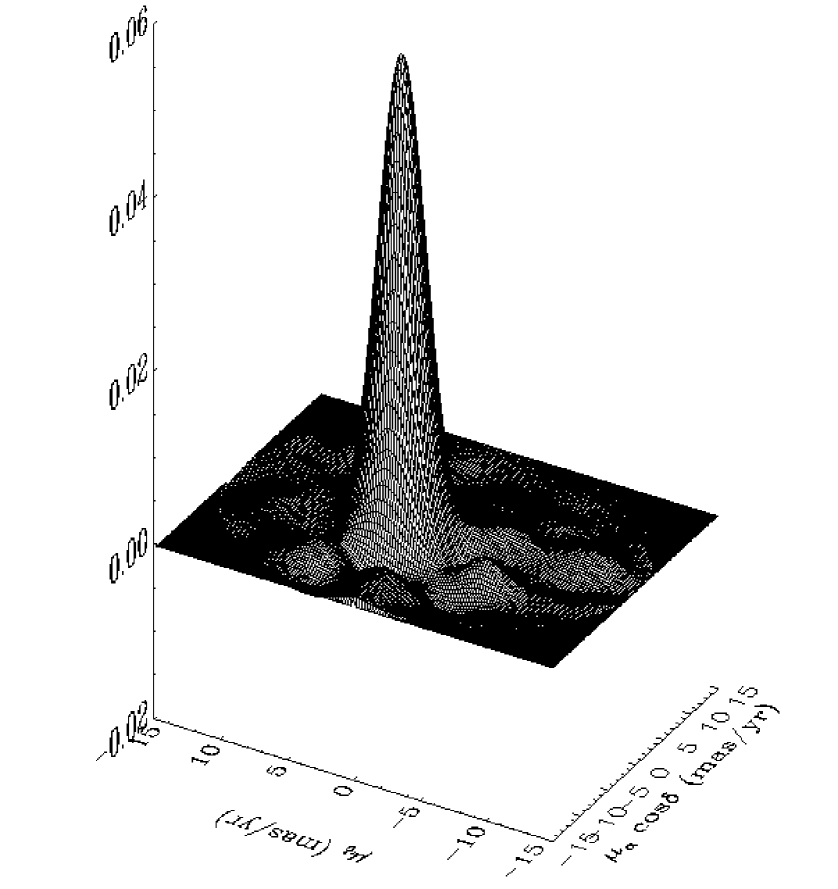
We finally found that the area outside a circle with a radius of 35 centered on the cluster yields a clean frequency function with low cluster contamination and low noise. The empirical frequency functions can be normalized to yield the empirical PDFs for the mixed population (circle), for the field (outside the circle) and for the cluster (non-field) population. Figure 2 displays these three functions. Of course, the field PDF estimated in the outer area cannot be an absolutely perfect representation of the true field PDF in the whole area. This introduces undesired noise in the frequency function of the cluster, as shown by the negative density values found in several zones and by some positive fluctuations without physical meaning. These negatives values allow us to estimate the typical noise level, , present in the result. To avoid meaningless probabilities in zones of low density, we restricted the probability calculations to the stars with cluster PDF 3. The maximum of the cluster PDF is located at () = (1.20.2,2.20.2) mas yr-1.
However, this cluster proper motion is different to the value found in Paper I. As discussed by many authors (Galadí-Enríquez et al. gala2 (1998) for example) one of the limitations of the parametric approach is the trend of the circular Gaussian distribution, used to fit the cluster, to assume an excessive width to improve the representation of the field distribution. The cluster mean proper motion will then be thus affected. To measure the influence of this effect, we decided to apply the parametric method but to fix the internal velocity dispersion of the cluster at zero. This way the model will assign to the cluster Gaussian distribution a width related only to measurement errors. We then obtained a mean proper motion of () = (1.100.08,2.090.08) mas yr-1, in agreement with the cluster proper motion obtained by the non-parametric approach.
The non-parametric technique does not take into account the errors of the individual proper motions, therefore it does not make any particular distinction between bright or faint stars, different epoch spread and so on. However, the FWHM of the empirical cluster PDF provides an estimation of the errors of the distribution. We obtained a FWHM of 4.20.2 mas yr-1. If the Gaussian dispersion owing to the smoothing parameter 1.44 mas yr-1 is taken into account, this FWHM corresponds to a value of 1.53 mas yr-1. But from Paper I we know that the mean proper motion precision is 1.18 mas yr-1 which gives us an intrinsic dispersion component of 0.97 mas yr-1, (3 km s-1 at the distance of 725 pc from Sect. 5), of the same order but slightly lower than the value obtained by the membership determination in Paper I. This indicates that the intrinsic velocity dispersion of the cluster cannot be neglected. Although fixing it to zero improves the determination of the mean motion of the cluster (position of the centre of the fitted Gaussian), the membership probability results are more meaningful taking into account the intrinsic dispersion. In our analysis, we will use the parametric results from Paper I. However, slight differences in the center of the adopted Gaussian do not affect the segregation, since the stars with highest probability of being members are almost the same in both cases.
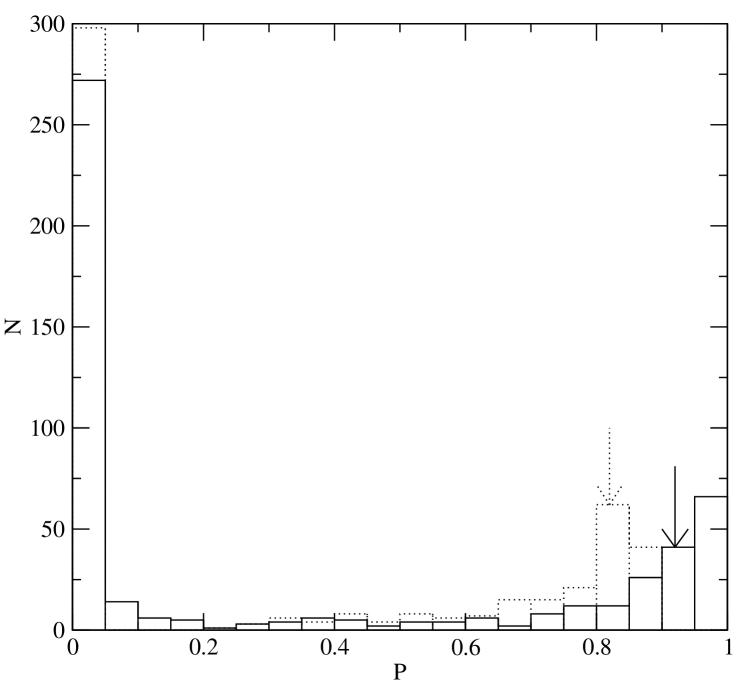
The cluster membership probability histogram (Fig. 3) shows a clear separation between cluster members and field stars in both approaches: the solid line is the traditional parametric method (from Paper I) while the dotted line is the non-parametric approach. The non-parametric approach to cluster/field astrometric segregation gives us an expected number of cluster members from the integrated volume of the cluster frequency function in the VPD areas of high cluster density, where PDF 3. This integration predicts that the sample contains 91 cluster members. Sorting the sample in order of decreasing non-parametric membership probability, , the first 91 stars are the most probable cluster members. The minimum value of the non-parametric probability (for the 91-st star) is . Table 5 lists the for the 501 stars.
There is not an equivalent rigorous way to decide where to set the limit among members and non-members in the list sorted in order of decreasing parametric membership probability, . But, if we accept the size of the cluster predicted by the non-parametric method, 91 stars, we can consider that the 91 stars of highest are the most probable members, according to the results of the parametric technique. The minimum value of the parametric probability from Paper I (for the 91-st star) is .
With these limiting probabilities (; ), we get a 91 (458 stars) agreement in the segregation yield by the two methods. The 43 remaining stars (9) with contradicting segregation should be carefully studied. Discrepancies among the two approaches are actually expected due to the statistical nature of the methods themselves.
As in Balaguer-Núñez et al. (2004a ), to set up a final and unique list, and trying not to reject true members, we accept as probable members of this cluster those stars classified as members by at least one of the two methods. This is equivalent to merging both lists (each with 91 stars) and eliminating duplicated entries. This way we get a list of 118 probable member stars.
As commented on the Introduction, the available information on radial velocities is not accurate nor complete enough to be useful in improving the membership segregation.
We have studied twenty stars in the area of the secondary clump on the tidal tail proposed by Bergond et al. (Bergond (2001)). Only three of them appear to be cluster members. The rest are randomly distributed in the VPD. Because our limiting magnitude for astrometry 14 is brighter than the 14.8 of Bergond et al. (Bergond (2001)), we cannot discard the reality of this clump. Unfortunately, our photometry does not cover this area. Deeper studies will be necessary.
4 Colour-Magnitude diagrams
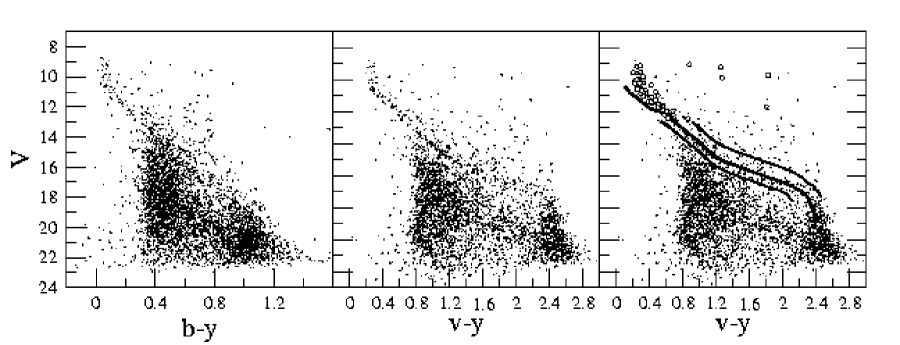
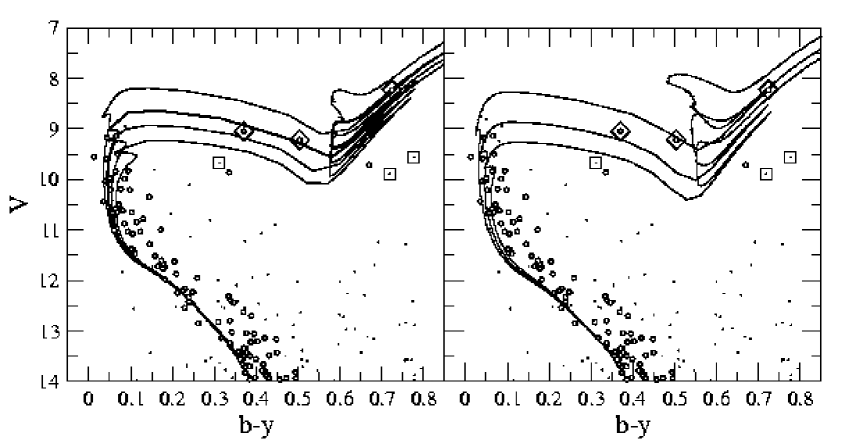
We use the colour-magnitude diagram for our study. The colour-magnitude diagram based on this colour index defines the main sequence of a cluster significantly better than the traditional diagram (Fig. 4 left and centre). The colour-magnitude diagram of all the stars in the area displays a fairly well-defined main sequence.
4.1 Selection of candidate member stars
Our photometric measurements help to reduce the possible field contamination in the proper motion membership among bright stars, as well as to enlarge the selection of members towards faint magnitudes. Among those astrometric member stars with photometric measurements, we find one star that is not compatible with the sequence of the cluster outlined in the colour-magnitude diagram. Our astrometric segregation of member stars has a limiting magnitude of 13. From this point down to we construct a ridge line following a fitting of the observational ZAMS (Crawford Craw75 (1975), Craw78 (1978), Craw79 (1979), Hilditch et al. Hil83 (1983), Olsen Ols84 (1984)) in the diagram. A selection of stars based on the distance to this ridge line is then obtained. The chosen margin for candidates includes all the stars between and from the ridge line, as shown in the right panel of Fig. 4. The margins were chosen to account for observational errors and the presence of multiple stars.
5 Physical parameters of the cluster
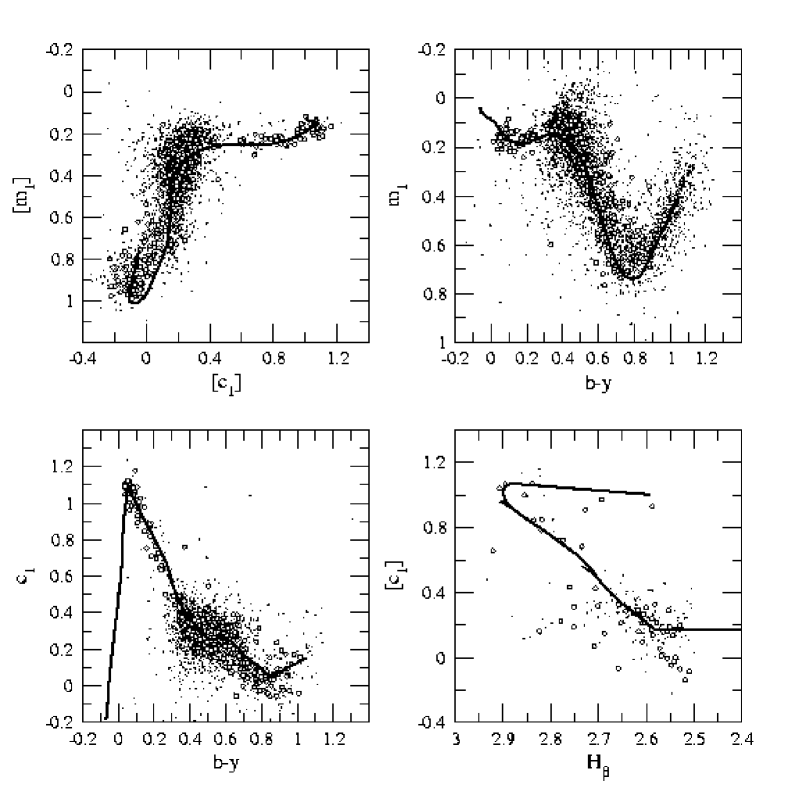
The stars selected as possible cluster members were classified into photometric regions and their physical parameters were determined as explained in Balaguer-Núñez et al. (2004b ). The algorithm, described in Masana et al. (2005a ) and Jordi et al. (Jordi97 (1997)), uses photometry and standard relations among colour indices for each of the photometric regions of the HR diagram. Absolute magnitude, effective temperature and gravity as well as the corresponding reddening, distance modulus, metallicity and raw spectral type and luminosity class are calculated for each star. Typical errors are 0.25 mag in , 0.15 dex in [Fe/H], 270 K in , 0.18 dex in and 0.015 mag in .
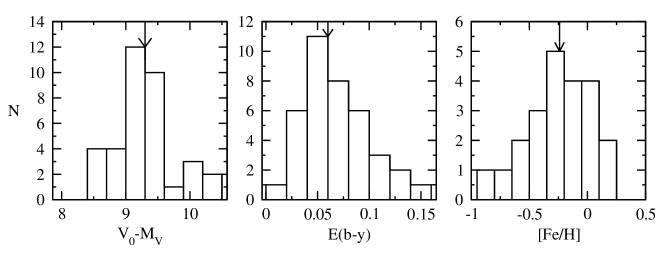
Only 62 stars among the 331 candidate members have measurements. Thus, the computation of physical parameters is only possible for that subset. The results are shown in Fig. 6. Excluding peculiar stars and those with inconsistencies in their photometric indices and applying an average with a 2 clipping to that subset, 39 stars remain. We found a reddening value of = 0.060.03 (corresponding to = 0.08) and a distance modulus of = 9.30.5 (725 pc, i.e. about 200 pc above the galactic plane). Metallicity is better calculated studying only the 26 F and G stars in our sample following Masana et al. (2005a ). We found a value of [Fe/H] = 0.240.27.
| Phot. Id. | WEBDA | M/NM | |||||
|---|---|---|---|---|---|---|---|
| 1006 | 0870 | 0.6700.0185 | 9.7120.0185 | 0.07 | 0.84 | M? | |
| 2556 | 1218 | 0.3350.0370 | 9.8620.0305 | 0.83 | 0.85 | M | |
| 2732 | 1260 | 0.3700.0002 | 9.0500.0047 | 0.97 | 0.84 | M | SB |
| 2894 | 1296 | 0.5040.0004 | 9.2150.0023 | 0.94 | 0.86 | M | SB |
| (1) | 1560 | 0.7240.0020 | 8.1990.0060 | 0.88 | 0.84 | M | SB |
| 3971 | 1521 | 0.3120.0079 | 9.6710.0081 | 0.00 | 0.00 | NM | |
| 4557 | 1616 | 0.7190.0045 | 9.8900.0045 | 0.00 | 0.00 | NM | |
| 2645 | 1241 | 0.7770.0072 | 9.5650.0072 | 0.81 | 0.66 | NM? |
(1) Photometry taken from Olsen (Ols (1993))
We have examined the bibliography in search of bright stars in the area of NGC 2548 and have found only one compatible with being a member of the cluster: The brightest star (WEBDA 1560), that was saturated in our data. We therefore took its values from Olsen (Ols (1993)). The stars in the red giant region are detailed in Table LABEL:RedG. Three of them are known spectroscopic binaries. We are cautious about our values of star WEBDA 1218, as the known values of are 9.64 (Pesch pesch (1961)) and 9.63 (Oja Oja (1976)), about 0.2 mag brighter. Star WEBDA 0870 was considered to be an astrometric non-member by Ebbinghausen (Ebb (1939)) and in Paper I, while Clariá (Claria (1985)) studied its weak CN peculiarity and opened the possibility of a cluster member with peculiar composition and proper motion. Star WEBDA 1241 was considered to be a cluster member in Paper I.
The recent publication by Clem et al. (Clem (2004)) of empirically constrained colour-temperature relations in the Strömgren system enables an isochrone fitting to our results. The best fit is found for the Pietrinferni et al. (Pie (2004)) tracks. Figure 7 shows isochrones of [Fe/H] = 0.25 for canonical models (right panel) and for models with overshooting (left panel). Taking into account the number of stars before and after the MS hook, we found a best fit for models with overshooting. The estimated age is of 400100 Myr ( = 8.6). Using a different set of tracks by Schaller et al. (Scha92 (1992)) we also found agreement with a best estimation of the age of = 8.60.1. Neither Pietrinferni et al. (Pie (2004)) nor Schaller et al. (Scha92 (1992)) isochrones provide a perfect fit to the giant members. Similar discrepancies were found by Lapasset et al. (Lapasset (2000)) studying the intermediate-age cluster NGC 2539.
Our results are consistent with previous studies. Pesch (pesch (1961)) gives an = 0.040.05 and a distance of 630 pc from photoelectric observations of 30 stars. Clariá (Claria (1985)) studied photometry of 5 giant stars and gives a value of = 0.06 and a distance of 530 pc. Twarog et al. (Twa (1997)) revised those values and gave an = 0.05, a distance of 590 pc and [Fe/H] = 0.08 from 3 stars. Harris (Harr76 (1976)) gives a value of = 8.28 from an analysis of nine stars. H\aog & Flynn (Hog (1998)) give [Fe/H] = 0.13, = 0.04 and = 8.50 from photometry of three giants. Rider et al. (Rider (2004)) fix a value = 0.03 from bibliography and give values of distance 700 pc, 0.0 and an age of 400 Myr by isochrone fitting to photometry. The recent study by Wu et al. (Wu05 (2005)) gives a slightly larger distance (780 pc) and a lower age (0.32 Gyr) also fitting isochrones with = 0.04 and solar metallicity. A summary of this information is given in Table LABEL:resultcomp for clarity.
6 Gaps in the Main Sequence
Gaps in the main sequence have been observed and debated for a long time. In the Hyades, de Bruijne et al. (Bru (2000)) confirmed the reality of two gaps near 0.38 and 0.48 ( 6400 K). Evidence for the existence of gaps among field stars has also been debated (Newberg & Yanny New (1998)), and recently Kovtyukh et al. (Kov (2004)) showed a new gap among field stars in the effective temperature range 5560 to 5610 K.
| Reference | [Fe/H] | Distance | Comments | ||
|---|---|---|---|---|---|
| mag | dex | pc | |||
| This work | 0.08 | 0.240.27 | 8.60.1 | 725 | |
| Wu et al. (Wu05 (2005)) | 0.04 | 0.0 | 8.51 | 780 | Isochrone fit |
| Rider et al. (Rider (2004)) | 0.0 | 8.60 | 700 | Isochrone fit | |
| H\aog & Flynn (Hog (1998)) | 0.04 | 0.13 | 8.50 | Phot. 3 stars | |
| Harris (Harr76 (1976)) | 8.28 | Phot. 9 stars | |||
| Twarog et al. (Twa (1997)) | 0.05 | 0.08 | 590 | Phot. 3 stars | |
| Clariá (Claria (1985)) | 0.06 | 0.1 | 530 | Phot. 5 stars | |
| Pesch (pesch (1961)) | 0.04 | 630 | Photoelectric 30 stars |
6.1 Method
The characteristics of our photometry and member selection procedure allow us to pursue the search for gaps in the main sequence not only for the previously discussed cluster, NGC 2548 (M 48), but also in the other clusters included in our project: NGC 1817 (Balaguer-Núñez et al. 2004a , 2004b ) and NGC 2682 (M 67, Balaguer-Núñez et al. Bal05 (2005)). To check the reliability of the results, we apply the same gap search to the Pleiades (M 45) and the Hyades, two well-known clusters in which gaps have been previously reported (de Bruijne et al. Bru (2000), Belikov et al. Bel (1998), and specially their Figs. 1 and 3, respectively.)
We estimate effective temperatures for our selection of candidate members following a new approach (Ribas et al. Ribas (2003), Masana et al. 2005b ) based on fitting observed IR photometry with accurately calibrated synthetic photometry. We use our values of magnitude and the 2MASS values for , , and magnitudes. The process requires metallicity and surface gravity data that we compute from our Strömgren photometry as explained in previous sections. The method is restricted to the temperature interval from 4000 K to 8000 K, with quoted uncertainties of 0.5-1.3. The upper temperature limit is due to the increased dependence of the results on the accuracy of , while the lower limit is related to the decreasing performance of the models because of molecular bands. Ribas et al. (Ribas (2003)) show that, in this range, the procedure is essentially insensitive to the adopted value of [Fe/H] and : uncertainties of 0.3 dex in metallicity and 0.5 dex in gravity induce deviations inferior to 0.5. The number of member stars from our selection of clusters that also have 2MASS photometry in the range of temperatures under study is of 269 stars for NGC 2548, 307 stars for NGC 1817 and 588 stars for NGC 2682. For Pleiades we obtain 225 member stars and for Hyades 76.
After getting the values, we proceeded to the gap search following a method analogous to that proposed by Rachford & Canterna (Rach (2000)). A simple test with one degree of freedom is used to evaluate the significance of any candidate gap. To do this, we take a candidate gap of width and we compute the number of stars within it, . This number is compared with the stars located on both sides of the gap. We take two bins of equal width, , at the sides of the candidate gap, and we count the stars inside them, . Then, is scaled to the size of the gap to give and this quantity is compared to to get the value. To limit the effect of small number statistics, and again following Rachford & Canterna (2000), the computation is done only when at least five stars are present on each side of the gap, which guarantees that .
We performed this calculation for a grid of gap widths 75 K K, at intervals of 25 K, and placing the gap centres every 1 K over the intersection of the temperature range covered by the method with the range covered by the photometry. To prevent edge effects, intervals of 300 K were avoided at the extremes of the intersection.
After several trials, we chose K for our photometry, but the Pleiades and Hyades required K, due to the smaller size of the photometric sample. It is important to note that widening can alter the relative value of and its associated probability, but with little effect on the significance of the gap centre position or width.
Having computed for the whole range of gap centres and sizes, we selected the local maxima of the resulting table. We observed that changes in do not make gaps appear or disappear, but only affect their significance. All significant gaps have probability values higher than 0.99.
| Cluster | Age | [Fe/H] | Centre | Width | Centre | Width | Centre | Width | Centre | Width |
|---|---|---|---|---|---|---|---|---|---|---|
| Gyr | dex | K | K | K | K | K | K | K | K | |
| Pleiades (M 45) | 0.1 | -0.03 | 7377 | 300 | 6821 | 325 | 5577 | 275 | 4845 | 275 |
| NGC 2548 (M 48) | 0.4 | -0.24 | 7099 | 475 | 6305 | 425 | 5465 | 350 | 4785 | 350 |
| Hyades | 0.7 | 0.15 | 7006 | 475 | 6427 | 250 | 5452 | 225 | 4972 | 275 |
| NGC 1817 | 1.1 | -0.34 | 7323 | 175 | 6674 | 350 | 5701 | 300 | - | - |
| NGC 2682 (M 67) | 4.2 | 0.01 | - | - | - | - | 5593 | 125 | 5017 | 200 |
6.2 Results
Table LABEL:gaps gives the centres and widths () for the significant gaps in the temperature range studied. The two well-known Böhm-Vitense gaps are clearly detected in Hyades and also Pleiades, which serves as a check of the reliability of the method. Both gaps are significant in the whole sample of clusters analysed, with the exception of M 67, due to the much higher age of this stellar system (the main sequence is so evolved that the corresponding effective temperature range is no longer populated).
The gap recently reported by Kovtyukh et al. (Kov (2004)) in field stars at 5560-5610 K, and already suspected in the Hyades (de Bruijne et al. Bru (2000)), stands out not only in the Hyades, but also in the other clusters surveyed. In the case of M 67, Fan et al. (Fan (1996)) also raised the possible existence of this gap placed around 1 .
The reliability of the new gap detected around K is stressed by its appereance in all the clusters under study with the only exception of NGC 1817. The reason is that, in this case, our photometry does not reach stars colder than 5000 K.
Even though we know that some amount of field contamination is present in our candidate member selection, it is worth noting that the significance of the four gaps in our photometric data is outstanding. If an even more reliable member selection would be possible, this could make the gaps even more evident in our data.
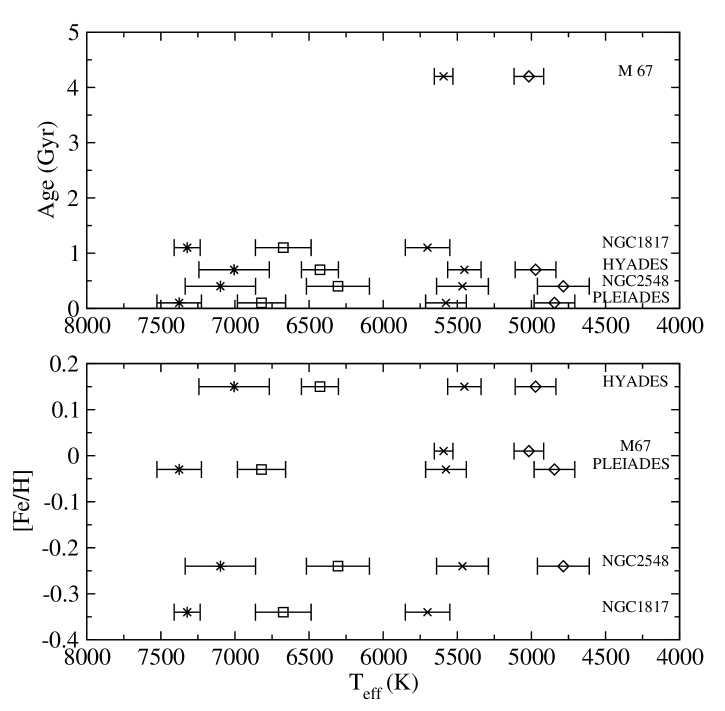
The position and width of the gaps are compared with the age and metallitity of the clusters in Fig. 8. No clear trend can be drawn from this comparison. However, metallicity effects could be masked due to the uncertainties in the metallicity determinations used for NGC 2548, NGC 1817 and NGC 2682 (M 67) that are of the order of 0.2 dex.
Independently of the physical explanation for the existence of these gaps, there is no reason, in principle, to expect them to appear at the same positions and with similar sizes in all the clusters. There can be a complex dependency on metallicity, age and other parameters. However, the clusters studied show some regularity that allows to distinguish, as mentioned, four independent gaps. Even though we know that this kind of average may lack physical meaning, we give a table with mean, approximate parameters that caracterize the loci of the four gaps (Table 9). The colour indexes and masses are taken from standard relations (Schmidt-Kaler schmidt-Kaler82 (1982)) and assume solar metallicity.
| (K) | (K) | B–V | Spec. | Mass () |
|---|---|---|---|---|
| 7200 | 180 | 0.30 | F0 | 1.6 |
| 6600 | 230 | 0.40 | F2-F5 | 1.3 |
| 5600 | 100 | 0.70 | G5-G8 | 0.80 |
| 4900 | 110 | 0.90 | K2 | 0.75 |
Several theoretical explanations have been proposed for the three hotter gaps (see the references already given). Most but not all, point to the need to improve the treatment of rotation and convection in stellar models. However, theoretical and/or empirical references to the fourth, colder gap are lacking. Spectroscopy could confirm or reject the reality of this gap whose significance is similar to that of the others, on the basis of our photometric data.
7 Conclusions
In this paper we give a catalogue of accurate Strömgren and J2000 coordinates for 4806 stars in an area of 34′34′ around NGC 2548.
We give a selection of probable members of NGC 2548, combining the photometric study with an astrometric analysis using parametric as well as non-parametric approaches. An improved determination of the physical parameters of this cluster based on our photometry gives: = 0.060.03, [Fe/H] = 0.240.27, a distance modulus of = 9.30.5 and an age of = 8.60.1. The values are consistent with previous studies (see Chen et al. Chen (2003) and references therein).
We perform a search for possible gaps in the main sequence of this cluster and, also, of the other clusters analysed in our project (NGC 1817, M 67). The Pleiades and Hyades are added as a check and to construct a sequence of ages and metallicities. We find four gaps in the effective temperature interval 4000–8000 K. The coldest gap, around 4900 K, had not been previously reported.
Acknowledgements.
We are grateful to Eduard Masana for very useful discussions and for providing the code for calculating effective temperatures. We would like to thank Simon Hodgkin and Mike Irwin for their inestimable help in the reduction of the images taken at the WFC-INT. L.B-N. also wants to thank Gerry Gilmore and Floor van Leeuwen for their continuous help and valuable comments, as well as all the people at the IoA (Cambridge) for a very pleasant stay. L.B-N. gratefully acknowledges financial support from EARA Marie Curie Training Site (EASTARGAL) during her stay at IoA. Based on observations made with the INT and JKT telescopes operated on the island of La Palma by the RGO in the Spanish Observatorio del Roque de Los Muchachos of the Instituto de Astrofísica de Canarias, and with the 1.52 m telescope of the Observatorio Astronómico Nacional (OAN) and the 1.23 m telescope at the German-Spanish Astronomical Center, Calar Alto, operated jointly by Max-Planck Institut für Astronomie and Instituto de Astrofísica de Andalucia (CSIC). This study was also partially supported by the contract No. AYA2003-07736 with MCYT. This research has made use of Aladin, developed by CDS, Strasbourg, France. This publication makes use of data products from the Two Micron All Sky Survey, which is a joint project of the University of Massachusetts and the Infrared Processing and Analysis Center/California Institute of Technology, funded by the National Aeronautics and Space Administration and the National Science Foundation.References
- (1) Balaguer-Núñez L., Jordi C., & Galadí-Enríquez D., 2005, (in preparation)
- (2) Balaguer-Núñez L., Jordi C., Galadí-Enríquez D., & Zhao J.L., 2004a, A&A 426, 819
- (3) Balaguer-Núñez L., Jordi C., Galadí-Enríquez D., & Masana E., 2004b, A&A 426, 827
- (4) Belikov A.N., Hirte S., Meusinger H., Piskunov A.E., & Schilbach E., 1998, A&A 332, 575
- (5) Bergond G., Leon S., & Guibert J., 2001, A&A 377, 462
- (6) Clariá J.J., 1985, A&AS 59, 195
- (7) Chen L., Hou J.L., & Wang J.J., 2003, AJ 125, 1397
- (8) Clem J.L, VandenBerg D.A., Grundahl F., & Bell R.A., 2004, AJ 127, 1227
- (9) Collinder P., 1931, Lund Observatory Annals n. 2.
- (10) Crawford D.L., 1975, AJ 80, 955
- (11) Crawford D.L., 1978, AJ 83, 48
- (12) Crawford D.L., 1979, AJ 84, 1858
- (13) de Bruijne J.H.J., Hoogerwerf R., & de Zeeuw P.T., 2000, AJ 544, L65
- (14) Ebbighausen E.G., 1939, ApJ 90, 689
- (15) ESA, 1997, The Hipparcos and Tycho Catalogues, SP-1200
- (16) Fan X., Burstein D., Chen J.-S., et al., 1996, AJ 112, 628
- (17) Galadí-Enríquez D., Jordi C., & Trullols E., 1998, A&A 337, 125
- (18) Geyer E.H., & Nelles B., 1985, A&AS 52, 301
- (19) Harris G.L.H., 1976, ApJS 30, 451
- (20) Hilditch R.W., Hill G., & Barnes J.V., 1983, MNRAS 204, 241
- (21) H\aog E., Fabricius C., Makarov V.V., et al. 2000, A& A 357, 367
- (22) H\aog E., & Flynn C., 1998, MNRAS 294, 28
- (23) Irwin M., & Lewis J., 2001, New Astron. Rev 45, 105
- (24) Irwin M.J., 1985, MNRAS 214, 575
- (25) Jordi C., Masana E., Figueras F., & Torra J., 1997, A&AS 123, 83
- (26) Kovtyukh V.V., Soubiran C., & Belik S.I., 2004, A&A 427, 933
- (27) Lapasset E., Clariá J.J., & Mermilliod J.-C., 2000, A&AS 361, 945
- (28) Lyngå G., 1987, Catalogue of Open Clusters, Centre de Données Stellaires, Strasbourg.
- (29) Masana E., et al. , 2005a, (in preparation)
- (30) Masana E., et al. , 2005b, (in preparation)
- (31) Messier C., 1850, CDT 1784, 227
- (32) Monet, D., Bird A., Canzian, B., et al. 1998, The USNO-A2.0 Catalogue, (U.S. Naval Observatory, Washington DC).
- (33) Moro D., & Munari U., 2000, A&AS 147, 361
- (34) Newberg H.J., & Yanny B., 1998, ApJ 499, L57
- (35) Nissen P.E., Twarog B.A., & Crawford D.L., 1987, AJ 93, 634
- (36) Oja T., 1976, private communication (as quoted in WEBDA)
- (37) Olsen E.H., 1993, A&AS 102, 890
- (38) Olsen E.H., 1984, A&AS 57, 443
- (39) Pesch P., 1961, ApJ 134, 602
- (40) Pietrinferni A., Cassisi S., Salaris M., & Castelli F., 2004, ApJ 612, 168
- (41) Rachford B.L., & Canterna R., 2000, AJ 119, 1296
- (42) Ribas I., Solano E., Masana E., & Giménez A., 2003, A&A 411, 501
- (43) Rider C.J., Tucker D.L., Smith J.A., et al. 2004, AJ 127, 2210
- (44) Schaller G., Schaerer D., Meynet G. & Maeder A., 1992, A&A 96, 269
- (45) Schmidt-Kaler Th., 1982, Landolt-Börstein: Numerical Data and Functional Relationships in Science and Technology, edited by K. Schaifers and H.H. Voigt (Springer-Verlag, Berlin), volume VI, subvolume 2b.
- (46) Silverman B.W., 1986, Density Estimation for Statistics and Data Analysis, J.W. Arrowsmith Ltd.
- (47) Stetson P.B., 1987, PASP 99, 191
- (48) Stetson P.B., 1990, PASP 102, 932
- (49) Trumpler R.J., 1930, Lick Obs. Bull., 14, 154
- (50) Twarog B.A., Ashman K.M., & Anthony-Twarog B.J., 1997, AJ 114, 2556
- (51) Wallerstein G., Westbrooke W., & Hannibal D., 1963, PASP 75, 522
- (52) Wu Z.Y., Zhou X., Ma J., & Chen J.S., 2005, PASP 117, 32
- (53) Wu Z.Y., Tian K.P., Balaguer-Núñez L., et al. 2002, A&A 381, 464 (Paper I)