22email: Francois.Bouchy@oamp.fr 33institutetext: Université Paul Sabatier, Observatoire Midi-Pyrénées, 14 av. E. Belin, 31400 Toulouse, France 44institutetext: Lisbon Observatory, Tapada da Ajuda, 1349-018 Lisboa, Portugal 55institutetext: Observatoire de Genève, 51 ch. des Maillettes, 1290 Sauverny, Switzerland
Asteroseismology of the planet-hosting star Arae.
I. The acoustic spectrum††thanks: Based
on observations collected with the HARPS spectrographs at the 3.6-m telescope
(La Silla Observatory, ESO, Chile: program 073.D-0578)
We present HARPS spectroscopy of Arae (HD160691) performed for studying the origin of the metallicity excess in this planet-hosting stars. The asteroseismologic campaign led to the previously reported discovery of a 14 earth mass planetary companion (Santos et al. 2004b ). The present analysis reinforces this interpretation by excluding other possible processes for explaining the observed Doppler variation and leads to the identification of up to 43 p-mode oscillations with =0-3, frequencies in the range 1.3-2.5 mHz and amplitudes in the range 10-40 cm s-1.
Key Words.:
stars: individual: HD160691 – stars: oscillations – techniques: radial velocities – planetary systems1 Introduction
One particularly important fact that is helping astronomers to understand the mechanisms of planetary formation has to do with the planet-hosting stars themselves. These stars were found to be particularly metal-rich, i.e. they have, on the average, a metal content higher, by 0.2 dex, than the one found in field stars without detected planetary companions (e.g. Gonzalez gonzalez98 (1998); Santos et al. santos01 (2001), santos03 (2003), 2004a ).
The impact of this fact is enormous regarding the understanding of the processes of planetary formation and evolution. If stars with planets were formed out of more-than-average metallic material, then we might conclude that the metallicity is playing a key role in the formation of giant planets. However some evidences suggest that planetary material might have fallen onto the planet-hosting stars (Israelian et al. israelian01 (2001); Murray & Chaboyer murray02 (2002)) and might be able to produce the metallicity excess observed. In this case we might conclude that the issue of planetary migration is commonly to be engulfed by the star. Which of these two scenarios is correct? In other words: is the metallicity excess observed in planet-hosting stars of primordial origin, or is it due to stellar pollution effects?
Asteroseismology consists in measuring properties of p-mode oscillations and provides a unique tool for “drilling” stellar interiors and for testing the internal structure and chemical composition of bright solar-type stars (e.g. Bouchy & Carrier bouchycarrier03 (2003); Bedding & Kjeldsen bedding03 (2003)). It also appears as the only means to determine the metallicity gradient across the stellar interior in order to solve the question of the origin of metallicity excess in planet-hosting stars (Vauclair vauclair04 (2004); Bazot & Vauclair bazot04 (2004)).
We noted earlier (Bouchy et al., bouchy04 (2004); Bouchy, bouchy05 (2005)) that with a radial velocity precision bellow 1 m s-1, the HARPS spectrograph (Pepe et al. pepe02 (2002), Mayor et al. mayor03 (2003)) mounted at the 3.6-m telescope offered promising perspectives for such asteroseismologic studies. We present here results of our asteroseismologic campaign obtained with this instrument on HD160691, one of the most metal-rich stars with planetary companions. Comparison with stellar structure models and interpretation are presented in a companion paper (Bazot et al. bazot05 (2005)).
2 Observations and data reduction
HD160691 ( Ara, HR6585) is a G3IV-V star with a V magnitude of 5.1 and a metallicity [Fe/H] of +0.32. A giant planet (1.7 ) in a long period (637 days) orbit was detected by Butler et al. (butler01 (2001)). The orbital solution was updated by Jones et al. (jones02 (2002)) and Gozdziewski et al. (gozdziewski03 (2003)), who found a long term drift possibly due to the presence of a second body ( 1.5 , 1500 days) in the system. Bright enough for HARPS, this target is furthermore well sited for an asteroseismology campaign (observable more than 10 hours per night). HD160691 was observed over 8 nights in June 2004. We took sequences of 100-s exposures with a dead time of 31-s in-between. In total 2104 spectra were collected with typical night-averaged signal-to-noise ratio (S/N) per pixel in the range 95-193 at 550 nm.
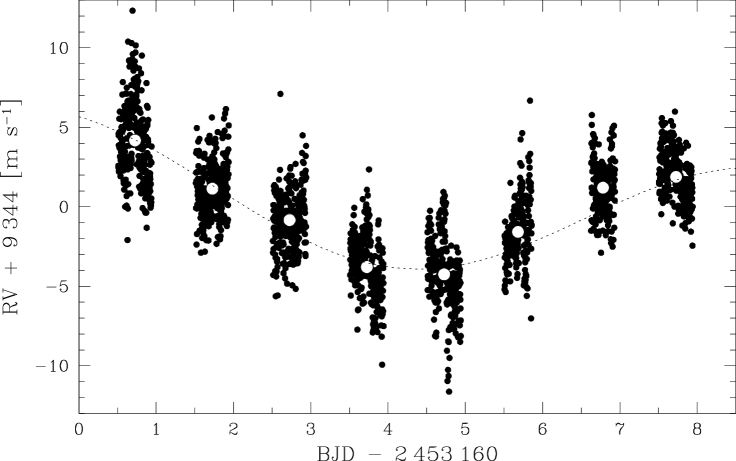
The spectra obtained were extracted on-line and in real-time using the HARPS pipeline. Wavelength calibration was performed with ThAr spectra. The radial velocities were obtained by weighted cross-correlation with a numerical mask constructed from the Sun spectrum atlas. We also computed off-line the stellar radial velocities using the optimum weight procedure as described by Bouchy et al. (bouchy01 (2001)) but found no significant gain. The journal of the observations is given in Table 1 and the radial velocities are presented in Figures 1 and 2. The dispersion of each individual nights, in the range 1.5-2.5 m s-1, is strongly dominated by the acoustic modes with period around 8 minutes as shown in Fig. 3.
The simultaneous ThAr spectrum was used in order to compute the instrumental drift using the optimum weight procedure. The spectrograph drift was systematically lower than 0.75 m s-1 during a night and lower than 2 m s-1 during the whole campaign, illustrating the extreme stability of HARPS. Considering this point, we observed without simultaneous Thorium during the fourth night in order to construct as more properly as possible (without any risk of ThAr contamination) a high S/N combined spectrum for spectroscopic analysis of HD160691.


| Date | Nb spectra | Nb hours | S/N | [ m s-1] |
|---|---|---|---|---|
| 2004/06/03 | 279 | 10.32 | 105-181 | 2.49 |
| 2004/06/04 | 274 | 10.19 | 65-237 | 1.71 |
| 2004/06/05 | 285 | 10.34 | 77-239 | 1.79 |
| 2004/06/06 | 286 | 10.38 | 132-235 | 2.03 |
| 2004/06/07 | 275 | 10.35 | 43-263 | 2.20 |
| 2004/06/08 | 229 | 8.43 | 24-233 | 2.04 |
| 2004/06/09 | 202 | 7.43 | 57-147 | 1.65 |
| 2004/06/10 | 274 | 10.42 | 32-186 | 1.49 |
3 A low-mass-planetary companion
Our first surprise was to detect in the Doppler signal an unexpected modulation with an semi-amplitude of about 4 m s-1 and a period equal or greater than 8 days. Fig. 1 clearly shows that we would not have been able to detect such a small signal if only one measurement was made each night. Indeed, the semi-amplitude of 4 m s-1 corresponds typically to the peak-to-peak variation induced by the p-modes in the time series.
In order to confirm the long period modulation, further observations were carried on during two GTO runs (program 073.C-0005) in July and August 2004. Considering that the longest periods of p-modes in this star are around 11 minutes (see Sect. 4), we decided to construct each measurement by averaging consecutive independent observations over a period of twice the longest acoustic period ( 22 minutes). These further measurements allowed us to confirm the modulation and determine the period to 9.55 days. This Doppler modulation was interpreted as caused by a 14 earth mass planetary companion, the third one detected in this exoplanetary system and the lightest planetary companion ever observed (Santos et al. 2004b ).
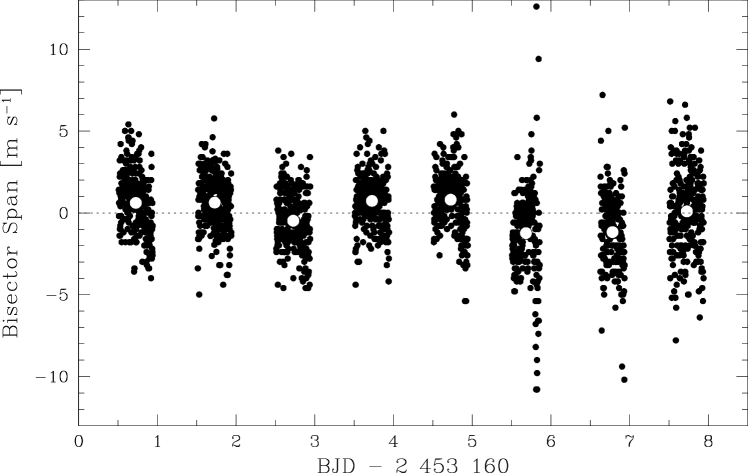
In order to verify if this long period modulation was due to a blended binary system or a stellar spot, we conducted a bisector analysis of the Cross-Correlation Function (CCF) as described in Queloz et al. (queloz01 (2001)) and Santos et al. (santos02 (2002)). Such an analysis is very efficient to discriminate between radial-velocity variations due to changes in the spectral-line profiles from pure Doppler variations due to the orbital motion of the star. Fig. 4 presents a typical CCF of HD160691. We computed the bisector velocity of each CCF for 100 different levels (dividing the CCF in 100 slices). We defined the “bottom” velocity and “top” velocity by averaging the values in the range 10-35% and 70-95% of the CCF depth, respectively. The difference is equivalent to the bisector velocity span and is used to measure the variations of the line profile. The result of our bisector analysis is presented in Fig. 5 at the same scale as Fig 1. The dispersion of the velocity span on an individual night is about 2 m s-1. No variation appears in phase with the radial-velocity variations of period of 9.55 days. We checked that no high frequency signals are present in the velocity span showing that p-modes induce a pure Doppler variation on the spectral lines. The dispersion of the night-averaged-velocity span is 0.8 m s-1. This result indicates that the periodic-radial-velocity change is not due to an blended background binary (as HD41004 - see Santos et al. santos02 (2002)) nor a dark photospheric stellar spot (as HD166435 - see Queloz et al. queloz01 (2001)).

We also checked the magnetic activity of HD160691 by computing the chromospheric activity index based on the relative flux level on CaII H and K lines (see Fig. 6). We measured the flux in two 1 Å pass bands centered on the H and K lines normalized by two 20 Å wide sections of photospheric flux centered at 3900 and 4000 Å. The index , computed on the 2104 available spectra, has values in the range 0.120-0.125. Once in the Mount Wilson scale (Vaughan et al. vaughan78 (1978)), this corresponds to a =-5.0340.006 (Noyes et al. noyes84 (1984)). As mentioned by Santos et al. (2004b ) this value, in close agreement with the one obtained by Henry et al. (henry96 (1996)), is typical of an inactive solar type star.

Finally our acoustic spectrum analysis (see Sect. 4) allows to estimate the rotational period at 22 days which definitively eliminates any stellar activity origin in the 9.55 days signal.
We noticed that the residuals around the best Keplerian fit have a rms of 0.43 m s-1 for the 8 night-averaged measurements made during our campaign of asteroseismology (average of more than 200 individual observations) and have a rms of 1.3 m s-1 for the other nights (average of 15 observations). This is due to the presence of low frequency (few hours) modulations in the Doppler signal (see Fig. 2) with semi-amplitudes of 1-2 m s-1 which are not averaged by 15 consecutive independent observations. We checked that this noise did not appear in the Thorium signal. We also checked that this noise was not introduced by chromatic effect on the fiber entrance due to atmospheric-dispersion-correction residuals with change of seeing or change of fiber centering. The flux ratio between blue and red spectral orders do not present correlation with the low frequency modulation seen in the Doppler signal. The origin of this noise is still unclear, but considering that it does not seem to be an instrumental effect and that its amplitude change with time, we strongly suspect that it could have a stellar origin (like granulation noise).
A third exoplanet with low-mass (14 ) and short-period (9.55 days) was not completely unexpected and was considered as a possible lucky by-product of this asteroseismology campaign. In fact statistics of the exoplanet sample show that the probability to find a new exoplanet is higher around a planet-hosting star (more than 10% of known exoplanets are in a multiple system), even if the host star is overmetallic. We show here that the only way to find such an companion with a semi-amplitude of only 4.1 m s-1 was to perform such an intensive campaign of radial velocity measurements in order to average properly and completely the stellar oscillations.
4 Acoustic spectrum analysis

In order to compute the power spectrum of the velocity time series of Fig. 1 (corrected from the orbital motion), we used the Lomb-Scargle modified algorithm (Lomb lomb76 (1976), Scargle scargle82 (1982)) for unevenly spaced data. The resulting LS periodogram, shown in Fig. 7, exhibits a series of peaks between 1.3 and 2.5 mHz modulated by a broad envelope, which is the typical signature of solar-like oscillations. This signature also appears in the power spectrum of each individual nights. The mean white noise level computed in the range 0.7-1.2 mHz is m2 s-2. Considering a Gaussian noise, the mean noise level in the amplitude spectrum is 4.5 cm s-1. Considering that the time series is based on 2104 measurements, the corresponding velocity accuracy thus corresponds to 1.17 m s-1. The uncertainty due to photon noise is estimated to 0.52 m s-1 indicating that we are not photon-noise limited. The origin of the external noise level of 1 m s-1 is still unclear. The main instrumental limitation of HARPS could comes from the guiding and centering errors on the optical fiber input but tests made during commissioning indicated error sources at the level of 0.2 m s-1 (Mayor et al., 2003). We strongly suspect a stellar origin of this noise (like granulation noise).

In solar-like stars, p-mode oscillations are expected to produce a characteristic comb-like structure in the power spectrum with mode frequencies reasonably well approximated by the simplified asymptotic relation (Tassoul 1980):
| (1) |
The two quantum numbers and correspond to the radial order and the angular degree of the modes, respectively. For stars of which the disk is not resolved, only the lowest-degree modes () can be detected. In case of stellar rotation, p-modes need to be characterized by a third quantum number called the azimuthal order (). Quantities , and correspond to the large spacing, the small spacing and the rotational splitting, respectively.
| = 0 | = 1 | = 2 | = 3 | |
|---|---|---|---|---|
| n = 13 | …. | …. | 1381.8a | …. |
| n = 14 | …. | 1424.5 | …. | …. |
| n = 15 | 1478.4 | 1513.7 | 1555.1a / 1557.0a | 1592.9a |
| n = 16 | 1562.3 | 1600.2 | …. | 1682.5a |
| n = 17 | …. | …. | 1731.8 / 1734.9 | 1772.2 |
| n = 18 | 1740.9 | 1780.8 | 1824.2 / 1826.6 | 1862.3 |
| n = 19 | 1831.6 | …. | 1914.5 | 1954.7 |
| n = 20 | 1922.0 | 1960.4 | 2005.9 / 2007.8 | 2042.5 |
| n = 21 | 2010.1 | 2051.0 | 2094.9 / 2096.7 | 2132.8 |
| n = 22 | 2101.0 | 2140.8 | 2182.9 / 2184.9 | …. |
| n = 23 | 2189.7a | 2231.0 | 2274.4a / 2276.0a | 2315.7a |
| n = 24 | 2280.3 | 2322.7 | …. | …. |
| n = 25 | …. | …. | …. | …. |
| n = 26 | …. | 2504.5a | …. | …. |
| = 0 | = 1 | = 2 | = 3 | |
|---|---|---|---|---|
| n = 13 | …. | …. | 11 | …. |
| n = 14 | …. | 14 | …. | …. |
| n = 15 | 18 | 16 | 10 / 11 | 12 |
| n = 16 | 18 | 17 | …. | 12 |
| n = 17 | …. | …. | 18 / 15 | 13 |
| n = 18 | 38 | 21 | 16 / 21 | 19 |
| n = 19 | 22 | …. | 26 | 22 |
| n = 20 | 14 | 39 | 18 / 16 | 19 |
| n = 21 | 32 | 29 | 24 / 25 | 19 |
| n = 22 | 16 | 16 | 15 / 16 | …. |
| n = 23 | 12 | 15 | 12 / 11 | 11 |
| n = 24 | 16 | 18 | …. | …. |
| n = 25 | …. | …. | …. | …. |
| n = 26 | …. | 12 | …. | …. |
The power spectrum, shown in Fig. 7, presents a clear and unambiguous periodicity of 90 Hz both on its autocorrelation or in the comb response. In order to identify the angular degree of each mode individually, we cut the power spectrum into slices of 90 Hz and summed up them. The result, which corresponds to the sum of the echelle diagram, is presented on Fig. 8 and allows to identify unambiguously modes and their side-lobes due to the daily aliases at 11.57 Hz.
We selected the strongest peaks with a signal-to-noise ratio greater than 3 in the amplitude spectrum and identified them as p-modes with value based on the asymptotic relation (see Eq. (1)) assuming that the parameter is near the solar value (). The Frequency and amplitude of these 33 p-modes are listed in Tables LABEL:tabfreq and LABEL:tabamp. The amplitude was determined by assuming none of the p-modes are resolved and corresponds to the height of the peak in the power spectrum after quadratic subtraction of the mean noise level. Considering that the frequency resolution of our time series is 1.56 Hz, we adopted an uncertainty on no-resolved oscillation modes of 0.78 Hz. Such an uncertainty can be considered as conservative in case of infinite time-life modes with high signal-to-noise ratio (3.5). A second inspection of the power spectrum with selection of peaks with signal-to-noise ratio in the range 2.5-3 (with amplitude in the range 11-13.5 cm s-1) allowed us to propose 10 additional p-modes. We are aware that some of these weaker modes could be miss-identifications and should be considered with caution and lower confidence.
All the identified modes are displayed on the power spectrum in Fig. 9 and in the echelle diagram in Fig. 10. A few peaks with signal-to-noise greater than 3 but not identified as p-modes or side-lobes are displayed in Fig. 10 as crosses. It could indicate that some modes are split due to their damping time.


The large spacings were computed for each pair of consecutive modes with same angular degree. For the =2 modes, which are split into 2 components due to the stellar rotation, we used the averaged value of the 2 frequencies. The result is displayed in Fig. 11. Neglecting the first three points, the residual of the large separations after a third order polynomial fit is 1.04 Hz RMS. This value indicates that the adopted uncertainty of Hz for the large separation is appropriate. The small spacings and are displayed in Fig. 12. The average small spacings and are Hz and Hz respectively.
The splitting of =2 modes are displayed in Fig. 12. Considering that such a splitting does not appear in modes =1 and the fact that the visibilities of modes are higher than modes , we strongly suspect that the observed =2 modes correspond to azimuthal order . The average splitting of Hz leads to a rotational splitting Hz which corresponds to a rotational period of days in agreement with the very low magnetic activity found in Sect. 3. Modes =3 do not appear to be split. It could indicate that we only observe modes (). An alternative is that we observe modes (). In this case modes () are expected to be at 11.1 Hz from the modes, hence completely merged with the =1 side-lobes.


5 Conclusions
Our spectroscopic observations of HD160691 first yield to the discovery of a very light planetary companion (14 ) with short period (9.55 days) (Santos et al. 2004b ). Our analysis enforces the validity of this planetary companion excluding all sources of ambiguities. Our observations of HD160691 also yield a clear detection of p-mode oscillations. Up to 43 p-modes have been identified in the power spectrum between 1.3 and 2.5 mHz with an average large spacing of 90 Hz, an average small spacing of 5.7 Hz, a rotational splitting of 0.53 Hz and an envelope amplitude of about 30 cm s-1. The identified p-mode frequencies will be compared with stellar models in a companion paper (Bazot et al. bazot05 (2005)).
Acknowledgements.
The authors wish to thank R.L. Gilliland for his helpful suggestions. We are grateful to ESO staff support at the 3.6-m telescope. S.V. acknowledges a grant from Institut Universitaire de France. N.C.S. would like to thank the support from the Swiss National Science Foundation and the Portuguese Fundação para a Ciência e Tecnologia in the form of a scholarship.References
- (1) Bazot, M., & Vauclair, S., 2004, A&A, 427, 965
- (2) Bazot, M., Vauclair, S., Bouchy, F., et al., 2005, A&A, in press
- (3) Bedding, T., & Kjeldsen, H., 2003 , PASA, 20, 203
- (4) Bouchy, F., Pepe, F., Queloz, D., 2001, A&A, 374, 733
- (5) Bouchy, F., & Carrier, F., 2002, A&A, 390, 205
- (6) Bouchy, F., & Carrier, F., 2003, Ap&SS, 284, 21
- (7) Bouchy, F., Maeder, A., Mayor, M., et al., 2004, Nature, 432(7015), 2
- (8) Bouchy, F., 2005, in Dome C Astronomy/Astrophysics Meeting, EDP Sciences, EAS Publications Series, Vol.14, in press
- (9) Butler, R.P., Tinney, C.G., Marcy, G.W., et al., 2001, ApJ, 555, 410
- (10) Gonzalez, G., 1998, A&A, 334, 221
- (11) Gozdziewski, K., Konacki, M., & Maciejewski, A.J., 2003, ApJ, 594, 1019
- (12) Henry, T.J., Soderblom, D.R., Donahue, R.A., et al., 1996, AJ, 111, 439
- (13) Israelian, G., Santos, N.C., Mayor, M., et al., 2001, Nature, 411, 163
- (14) Jones, H.R.A., Butler, R.P., Marcy, G.W., et al., 2002, MNRAS, 337, 1170
- (15) Lomb, N. R., 1976, Ap&SS, 39, 447
- (16) Mayor, M., Pepe, F., Queloz, D., et al., 2003, Messenger, 114, 20
- (17) Murray, N., & Chaboyer, B., 2002, ApJ, 566, 442
- (18) Noyes, R.W., Hartmann, L.W., Baliunas, S.L., et al., 1984, ApJ, 279, 763
- (19) Pepe, F., Mayor, M., Rupprecht, G., 2002, Messenger, 110, 9
- (20) Queloz, D., Henry, G.W., Sivan, J.P., et al., 2001, A&A, 379, 279
- (21) Santos, N.C., Israelian, G., & Mayor, M., 2001, A&A, 373, 1019
- (22) Santos, N.C., Mayor, M., Naef, D., et al., 2002, A&A, 392, 215
- (23) Santos, N.C., Israelian, G., Mayor, M., et al. 2003, A&A, 398, 363
- (24) Santos, N.C., Israelian, G., Mayor, M., et al. 2004a, A&A, 415, 1153
- (25) Santos, N.C., Bouchy, F., Mayor, M., et al., 2004b, A&A, 426, L19
- (26) Scargle, J. D., 1982, ApJ, 263, 835
- (27) Tassoul, M., 1980, ApJS, 43, 469
- (28) Vauclair, S., 2004, ApJ, 605, 874
- (29) Vaughan, A.H., Preston, G.W., & Wilson, O.C., 1978, PASP, 90, 267