The First Generation of Star-Forming Haloes
Abstract
We model gas cooling in high-resolution N-body simulations in order to investigate the formation of the first generation of stars. We follow a region of a Lambda Cold Dark Matter (CDM) universe especially selected to contain a rich cluster by the present day. The properties of the dark haloes that form in these sub-solar mass resolution simulations are presented in a companion paper by Gao et al. The first gas clouds able to cool by molecular hydrogen line emission collapse at extremely high redshift, , when the mass of the dark halo is 2.4. By , a substantial population of haloes are capable of undergoing molecular hydrogen cooling although their ability to form stars is dependent on the efficiency of feedback processes such as dissociating Lyman-Werner radiation. The mass of the main halo grows extremely rapidly and, by , its virial temperature has reached 104K, at which point gas cooling becomes dominated by more effective atomic processes. By , a small “group” of such potential galaxies will have formed unless prevented from doing so by feedback processes. By this redshift, massive () population III stars are able to ionise gas well beyond their own host halo and neighbouring HII regions can percolate to form an ionised superbubble. Such patches would be too widely separated to contribute significantly to reionisation at this time. The large number density of early cooling haloes in the pre-reionised universe raises the exciting prospect that this ultra-early generation of stars may be observable as gamma-ray bursts or supernovae.
keywords:
galaxies: haloes – galaxies: formation – methods: N-body simulations – cosmology: theory – cosmology:dark matter1 Introduction
The first stars in the universe are believed to have formed from primordial metal free gas in haloes with virial temperatures less than the 104K threshold for atomic hydrogen line cooling (see reviews by Bromm & Larson 2004; Ciardi & Ferrara 2005 and references therein). Primordial gas in these small haloes is instead able to cool by molecular hydrogen transitions, a less effective process (Saslaw & Zipoy 1967; Peebles & Dicke 1968). Molecular hydrogen is produced in a two step reaction chain in which free electrons left over from recombination serve as a catalyst via H- production (when z 100). Metal free (population III) stars are the first potential producers of UV photons that can contribute to the reionisation process, and are the first producers of the metals required for the formation of population II stars.
Tegmark et al. (1997) developed analytic methods to model early baryonic collapse via H2 cooling. The early stages of primordial star formation were later directly modelled in high-resolution hydrodynamic numerical simulations by Bromm, Coppi & Larson (1999, 2002) and Abel, Bryan & Norman (2002). Yoshida et al. (2003) further utilised simulations to develop a semi-analytic model based on the Tegmark et al. methods and included the effects of dynamical heating caused by the thermalisation of kinetic energy of infall into a deepening halo potential. This heating effect varies from halo to halo, depending on mass accretion rates, and has the potential to delay baryonic collapse.
Determining the first epoch of baryonic cooling in high redshift haloes thus requires the use of numerical simulations to follow their growth. In this paper, we study the growth of structure in a region selected to be the site where a rich cluster forms by in a large cosmological simulation. We repeatedly “resimulate” this region at increasing resolution and redshift. In this way, we are able to model the site of an extremely early generation of star formation. The simulations employed here are those described in a companion paper (Gao et al. 2005; G05 hereafter).
We estimate baryonic cooling rates using similar methods to those described by Yoshida et al. (2003), who performed a detailed hydrodynamic simulation of a 1 h-1Mpc volume in order to determine under what conditions gas in low mass haloes was able to cool sufficiently to allow collapse. Our use of a base region almost 500 h-1Mpc on a side allows us to include the important effects of large-scale modes (White & Springel 2000; Barkana & Loeb 2004), and enables us to model a much earlier generation of baryonic cooling in rare haloes with low comoving number density. In addition, we model H2 cooling by explicitly integrating the time-dependent H2 production rate as described in § 3.
Population III stars are generally expected to be massive () due to the large Jeans mass ( 1000) during initial baryonic collapse, and to the inability of zero metallicity gas clouds to subfragment into small masses during collapse (e.g. Bromm, Coppi & Larson 1999, 2002; Nakamura & Umemura 2001; Abel et al. 2002; Omukai & Palla 2003; Bromm & Loeb 2004). We will assume that baryonic cooling leads to a single massive star per halo in order to make some predictions about their effects on their surroundings and their potential observability. By determining the mean separation and clustering properties of the first star-forming haloes, we can infer their contribution to reionisation.
If the haloes hosting Pop. III stars are highly clustered, their associated HII regions could overlap, creating percolating bubbles of reionisation and, later, metal enrichment. Alternatively, if they are weakly clustered, then reionisation from the first stars would be confined to isolated HII regions. HII regions from Pop. III stars have been studied in the redshift range using 1-D codes by e.g. Kitayama et al. (2004) and Whalen, Abel, & Norman (2004) who find that most UV photons produced by a massive () star are able to escape the virial radius of small haloes such as we have simulated here. However, the extent to which high redshift ionised regions may overlap with those associated with neighbouring haloes is not yet established. If Lyman-Werner radiation or metal enrichment from the first generation of stars is effective at suppressing the formation of further Pop. III stars (e.g. Omukai & Nishi 1999; Glover & Brand 2001), overlap will not occur and the original HII region will simply collapse once the stars that power it reach the end of their lifetime.
As a first step in distinguishing between these scenarios, our simulations focus on the largest progenitors at high redshifts of a present day cluster region. The structure of this paper is as follows: The numerical techniques and assumptions of these simulations are discussed in § 2. In § 3, we describe the criteria required for baryonic collapse. In § 4, we show that the first haloes to collapse do so at extremely high redshift, and show that after a small redshift interval, many other nearby haloes also satisfy the collapse criterion. In § 5, we consider the implications of these results; we discuss potential sources of feedback, and we consider whether this early generation of star formation is open to observational study. Our conclusions are summarised in § 6. Throughout, we assume a flat CDM model with the following cosmological parameters, which are consistent with the combined WMAP/2dFGRS results (Spergel et al. 2003): matter density, ; dark energy density, ; baryon density, ; fluctuation amplitude, ; Hubble constant (in units of 100 km s-1 Mpc-1); and no tilt (i.e. a primordial spectral index of 1).
2 Numerical Techniques
2.1 The simulations
We use the parallel gravity solvers Gadget (Springel, Yoshida, & White 2001) and Gadget-2 (Springel 2005) to resimulate the region surrounding a rich cluster identified in a cosmological simulation of a 479 Mpc cube (the VLS simulation of Jenkins et al. (2001) and Yoshida et al (2001)). This cluster and its environment were part of the sample resimulated and analysed by Navarro et al. (2004) and Gao et al. (2004a,b,c). We identified the largest dark matter halo at in this resimulation, and then resimulated it again with resolution improved by an additional factor of 200. We repeated this procedure three more times stepping progressively back in redshift at increasing resolution.
Table 1 lists all our simulations, giving their initial and final redshifts, the mass of an individual particle in the highest resolution region, the mass of the main halo at the final time (the original cluster in the case of the VLS simulation), and the gravitational softening employed. The object that we picked at did not end up as part of the original cluster selected in the VLS simulation but rather as a nearby cluster of smaller mass. This accounts for the difference in masses quoted for the final “main halo” in the R1 and VLS simulations. The highest resolution resimulation ends at redshift 49, has a particle mass of 0.55 and includes a high resolution subvolume of side 90h-1kpc. We continue to follow the same halo in a resimulation ending at redshift 29 with particle mass of 29 . Initial conditions were created using the CMBFAST transfer function (Seljak & Zaldarriaga 1996), extrapolated to small scales by imposing .
| zstart | zfin | Mpart | Mhalo | rsoft | |
|---|---|---|---|---|---|
| R5 | 599 | 49 | 0.545 | 1.2105 | 4.8 |
| R4 | 399 | 29 | 29 | 5.1107 | 17 |
| R3 | 249 | 12 | 1.2104 | 2.01010 | 150 |
| R2 | 149 | 5 | 2.2 106 | 3.41012 | 800 |
| R1 | 39 | 0 | 5.1108 | 1014 | 5000 |
| VLS | 35 | 0 | 6.81010 | 81014 | 30000 |
2.2 Halo properties
Our virialized haloes are identified using the spherical overdensity (SO) algorithm (Lacey & Cole 1994), assuming the spherical tophat model (Eke, Cole, & Frenk 1996) in which the CDM virial overdensity, , in units of the mean density is 178 at high redshifts when . For a complex mass distribution such as that expected to arise from the flat fluctuation spectrum of our high redshift simulations, SO has an advantage over the simpler friends-of-friends halo identification algorithm (Davis et al. 1985) in that it is less likely spuriously to link together neighbouring haloes or to misclassify highly ellipsoidal but unvirialized structures as haloes.
The temperature of gas in virial equilibrium within a dark matter halo is given by
| (1) |
e.g. Eke et al. (1996), where is the mean molecular weight (in units of proton mass) and is the mass within the virial radius, . Simulations by Machacek, Bryan, & Abel (2001) and Yoshida et al. (2003) confirm that the local gas temperature is relatively close to the virial temperature of high redshift haloes, even within the central density peaks.
Throughout the paper, processes occurring within the haloes are calculated assuming uniform density and temperature within rvir because they depend in complex ways on mixing processes which cannot be treated realistically without simulation. This includes the assumption that gas is shock-heated upon initial infall. We neglect the possibility that some infalling H2 may be destroyed during shock-heating, but note that H2 production is rapid enough that it would be quickly replenished to a level that allows baryonic cooling. Moreover, collisional H2 dissociation rates are small below 104K, so any shock heating strong enough to cause dissociation would be accompanied by ionisation, providing free electrons that would increase the eventual H2 fraction. Detailed hydrodynamic simulations are required to model the heating of infalling gas accurately. We assume that the baryonic mass fraction in the halo is equal to the universal mean value. Lower baryon fractions are possible due to the suppression of linear baryon fluctuations on small scales before the decoupling epoch (e.g. Yamamoto, Sugiyama, & Suto 1998; Signh & Ma 2002; Yoshida, Sugiyama, & Hernquist 2003). However, even for haloes somewhat below the linear theory Jeans mass, gravitational infall into non-linear dark matter halo potential wells allows the baryons to largely catch up to the dark matter (e.g. Tegmark et al. 1997). Yoshida et al. (2003) were able to show that all these approximations are reasonably accurate for determining whether a halo undergoes sufficient H2 cooling for baryonic collapse of primordial haloes to occur.
One inevitable uncertainty involves the masses and number of the objects formed in the collapse. In order to follow the evolution of the baryonic component to the point at which individual stars are formed, fully three dimensional simulations with radiative transfer would be required. Such simulations are currently beyond the limit of numerical simulation techniques (Abel et al. 2002; Bromm, Coppi & Larson 2002; see Bromm & Larson 2004 for a review of recent progress). We thus assume a fiducial collapse model in which the baryonic cooling of a halo results in a single 120 star.
3 Star formation criteria
We apply the methodology of Tegmark et al. (1997) and Yoshida et al. (2003) to determine if the baryonic content of a halo is able to collapse and form stars. The two requirements are: (1) the cooling rate due to molecular hydrogen must be fast enough for the halo to cool within a Hubble time; (2) the dynamical heating rate due to mass accretion must be slower than the baryonic cooling rate. We assume that efficient baryon cooling leads to the formation of an increasingly dense gas core that eventually becomes Jeans unstable (e.g. Abel, Bryan, & Norman 2000).
Fig. 1 shows that halo growth-rates are remarkably fast, the haloes typically doubling in mass over a redshift interval . Here, the growth of the 20 largest haloes in simulation R5 is illustrated by tracking the evolution of their largest progenitor. We show later that because of the rapid halo growth, the associated dynamical heating causes a delay in the baryonic collapse for most haloes. Gas cooling is assumed to depend purely on the molecular hydrogen abundance, which we calculate by integrating the density and temperature-dependent H2 production rate over the lifetime of each halo, as we now discuss.

The amount of molecular hydrogen in each dark matter halo is computed according to the prescription of Tegmark et al. (1997). The primary molecular hydrogen production reaction, , requires the presence of free electrons to form H-. The H2 production rate, (where and ) is calculated as
| (2) |
where is the production rate, which is limited mainly by the supply of free electrons for the reaction . H2 production depends on the density and temperature of the gas, which are taken to be the volume-averaged virial quantities, as well as on the free electron fraction xe. We use , as obtained for a halo that virializes at z 50 from the tophat collapse approximation described in Tegmark et al.
We calculate f using a time-integrated production rate. Other authors have taken a different approach, assuming that the production of H2 stalls at a temperature dependent value when the remaining free electrons have largely recombined (e.g. Tegmark et al. 1997; Yoshida et al. 2003) but, as we show in Appendix A, our haloes grow too quickly to reach this state. Since halo growth is so rapid, we assume that infalling gas mixes uniformly with existing baryons in the halo, and this has two primary effects. The first is that the H2 within a halo is diluted by infalling material. The second is that electrons depleted through recombination are quickly replenished by infalling gas such that . The production of in a halo is then described by
| (3) |
where is the average over adjacent simulation outputs ti and ti-1, is the hydrogen density in units of the critical density, and is the halo virial mass. The primordial H2 fraction, is quite small 10-6 due to H photodissociation by CMB photons at high redshift (Anninos & Norman 1996; Galli & Palla 1998; Nishi & Susa 1999), and so can be ignored. The H2 abundance at time ti is thus:
| (4) |
We consider a halo to be a star-forming candidate when the molecular hydrogen fraction becomes large enough that its baryons can cool within a Hubble time:
| (5) |
where is Boltzman’s constant and is the adiabatic index of the gas. The cooling time, , is calculated using the cooling function, , from Galli & Palla (1998) for molecular hydrogen rotational line transitions. Fig. 2 compares the evolution of with the critical abundance, , required for cooling in the Hubble time. Sufficient H2 for baryonic cooling is produced at if we assume dilution by newly-added gas, at which point the halo has a mass of . However, we will now demonstrate that the dynamical heating due to increasing halo mass and the corresponding increasing virial temperature delays collapse.

Our second criterion for collapse is that the rate of dynamical heating must be lower than the rate of H2 cooling. If the dynamical heating rate is larger than the molecular hydrogen cooling rate, then nett cooling will not occur and baryonic collapse will be prevented. Following Yoshida et al. (2003), we require that:
| (6) |
where Q is the thermal energy per hydrogen atom. The dynamical heating rate is given by
| (7) |
and the cooling rate is
| (8) |
The quantity is calculated by tracking the virial temperature (estimated using Eqn. 1) of the most massive progenitor halo through the merger tree. The most massive progenitor is defined as the largest halo at the previous timestep for which at least half the mass and the most bound particle are part of the target halo. In Fig. 3, the dynamical heating rate falls below the H2 cooling rate after f is reached, at a redshift of 47 when the halo mass is . This suggests that baryonic collapse in the first halo is delayed by , or 4 Myr. Note that there is some uncertainty in the redshift of collapse due to the large variations of DM/Dz, and also due to the fact that the halo mass is not well defined by the SO identification when halo shapes are non-spherical.

4 Baryonic Cooling in the Simulation
4.1 The most massive halo
Summarising our main conclusions from the previous figures, the most massive halo in our simulation meets all the criteria for baryon collapse at . At this point, the halo mass is and has virial temperature of K. In this case, dynamical heating of the halo has delayed collapse from redshift 50 to redshift 47, when the universe is 51 Myr old. The halo is then expected to undergo a runaway collapse that results in the formation of the first star or stars. Simulations by Bromm & Loeb (2004) suggest that a collapsing primordial star may be able to grow to 120 in as little as 105 yr. Assuming a mass of 120 , the first supernova could happen years (Schaerer 2002) after the onset of collapse, by redshift 45. Note that the fiducial stellar mass is just below the predicted range for pair instability SNe (140-260), but is still expected to undergo an energetic (1051 ergs) envelope ejection via pulsational pair instability, ultimately forming a black hole (Heger & Woosley 2002).
4.2 Smaller haloes
In this section, we contrast the cooling of gas in the largest halo with subsequent cooling in other large haloes in the surrounding region. Fig. 4 compares the properties of the 100 most massive haloes in the simulation at with the two criteria required for gas to cool and collapse. Although 5 of the largest haloes have sufficient for rapid cooling at redshift 45, their dynamical heating rates are still so high that only 2 haloes are able to cool by this time. The mass of the smaller of these 2 haloes is h. All of these and 8 other haloes meet both baryonic cooling criteria by redshift 40, and are thus able finally to cool, as reflected in Fig. 5. At redshift 40, the characteristic collapse mass for cooling haloes, which we define as the mass above which half of the haloes meet both baryonic cooling criteria, is approximately 2h. This characteristic mass increases slowly to 3h by , at which time 80 haloes in the simulation are capable of cooling (Fig. 6). Most haloes in Figs. 4-6 lie along a rough path that follows a general sequence of increasing mass from lower-left to upper-right covering h in Fig. 4 and h in Fig. 6. Collapse is delayed by dynamical heating for the majority of our haloes, as evidenced by the fact that the path of the mass sequence crosses the line before reaching the line.
4.3 Atomic hydrogen cooling
Cooling by atomic hydrogen is possible as early as redshift 36 when the most massive halo reaches a virial temperature of K, years after it formed its first star. At this point, if gas has not all been expelled by prior energy injection, for example from a supernova, the halo should experience much more rapid baryonic cooling. If the high efficiency of metal-free atomic cooling leads to efficient star formation, this could lead to the formation of an extremely early galaxy-like system. The star formation efficiency and stellar IMF will depend on the details of the molecular cooling (or dust and metals if the gas is previously enriched) required to cool the gas below 8000K, although isothermal contraction could also lead to star formation (Omukai 2001). By redshift 29, 13 haloes are hot enough for atomic cooling to occur, and a small “group” of galaxies may already have formed. Note that this would occur well before the first stars form in the simulations by Abel et al. (2002), Bromm, Coppi & Larson (1999, 2002), and Yoshida et al. (2003), but it is critically dependent on what happens to the gas after the formation and evolution of the first stars.


4.4 Abundance and spatial distribution of the first-star forming haloes
We cannot use the simulation to determine the abundance of the first star-forming haloes directly because the high-resolution subvolume encompassed only 90h-1kpc (comoving) in diameter. The Press & Schechter (1974; P-S) prediction for the number density of objects more massive than at is , while the Sheth & Tormen (1999; S-T) formulae give a much larger value of . We do not know a priori which of these should be preferred since neither formula has been tested against N-body simulations in the regime that is relevant here. Reed et al. (2003) found the S-T mass function to be reasonably accurate even for rare massive objects at z 10, and Springel et al. (2005) showed that the S-T formula is much more accurate than the P-S formula out to similar redshift. However, these simulations are still orders of magnitude away from probing the mass range relevant to this study. Nevertheless, in what follows we will adopt the S-T predictions, but the reader has been warned that this extrapolation is uncertain. Somewhat surprisingly, G05 found that the extended Press-Schechter theory (Bower 1991; Bond et al. 1991) in the form worked out by Mo & White (1996) does accurately reproduce the abundance of haloes in the rare high density regions tracked in our R4 and R5 simulations over the range .
It is interesting to consider how rare is the initial overdensity that led to the halo where baryons were first able to cool in our simulation. To estimate this, we identify the Lagrangian volume of the halo by tracing the particles that make up the halo at (which would correspond to the lifespan of a 100 star formed at z 47) back to the starting redshift, , of the simulation. The Lagrangian volume of such a rare halo is nearly spherical because it corresponds to a high peak in the initial density field (e.g. Bardeen et al. 1986). Therefore we can characterise by its mean tophat linear overdensity, , and radius, . We compute the expected rms density fluctuations on scale , , from our initial power-spectrum. At , when the fluctuation amplitude is very nearly Gaussian-distributed, , i.e. the halo forms from a 6.5 fluctuation.
The clustering properties of the first metal-free stars will determine their role in the reionisation and metal enrichment of the surrounding gas. If these stars are highly clustered, then their HII regions could overlap and percolate leading to growing patches of reionisation. If, on the other hand, they are more uniformly distributed, percolation will be delayed, and the eventual reionisation will be more uniform. G05 used the Mo & White (1996) formalism to estimate spatial correlation functions at for haloes at least as massive as our largest halo. They found a bias factor of 24 which results in a comoving correlation length of 2.5 h-1Mpc, only slightly smaller than that of star-forming galaxies today. The comoving abundances estimated above are lower than those of such galaxies, however, and the luminosities predicted for our first star systems are very much lower. As a result, the first light sources are relatively weakly clustered despite their high bias. Neighbouring haloes that lie close enough to allow the possibility of overlapping HII regions are extremely rare at redshift . As we discuss next, the HII regions of haloes in the region we have followed may, nevertheless, percolate.
5 Discussion
We have shown that gas is able to cool and collapse in haloes of mass 2.4 already at , and that this is followed quickly by the collapse of the gas in less massive haloes in the surrounding region. In just another 22 Myr, at , the first haloes able to cool by atomic cooling have formed. In this section, we consider the impact of the collapse of the first haloes on their surroundings, focusing in particular on the size of the ionisation patches that are likely to be formed. We consider the observable consequences of the formation of the first stars in these haloes at the end of this section.
5.1 Ionising radiation from the first stars
We begin by calculating the role of the first stars in ionising the surrounding intergalactic medium (IGM). In the next subsection, we will consider the effect of the first stars on the star formation rate in surrounding haloes. In order to estimate limits on the impact of this first baryonic collapse, we use the flux and lifespan calculations for Pop. III stars by Schaerer (2002). We first establish some fiducial values. The efficiency of production of ionising photons peaks at a stellar mass of . We parameterise the total ionising photon flux resulting from the collapse of the gas in a halo as
| (9) |
where m120 is the mass, in units of , of ionising stars formed per halo, and f120 is the total number of ionising photons emitted per stellar mass relative to the specific ionising flux from a star. Since f120 is a weak function of stellar mass, nionise is a weak function of the actual mass of individual star(s) formed, and is mainly dependent on the total mass turned into stars. Later, we will assume that the dark matter halo (which contains baryons), forms a single 120 star (i.e. m120f). The maximum possible size of the HII region around such a star-forming object is kpc (comoving), if we assume no recombination (i.e. the final number of ionised atoms is equal to the total number of ionising photons produced by the star) and that the sphere expands into the mean baryon density. In practise, the high densities at such high redshift give rise to high recombination rates that are likely to limit the HII region significantly.
The size of the ionised region is uncertain for several reasons. Firstly, the recombination rate depends sensitively on the local gas density. For simplicity, we assume that gas traces dark matter, which is likely to be a good approximation outside the virial radius in the absence of feedback effects, although there is little reason to expect this to be correct within the virial radius. Secondly, a further complication arises from the effect of Compton cooling on the gas. The Compton cooling timescale is shorter than the recombination timescale in low density regions at high redshifts. This could serve to quench the growth of ionised regions because the recombination rate increases as gas cools. Thirdly, the expected short lifetimes of these massive stars could result in only a fraction of haloes hosting their first star at any one time. However, after the first star’s death, the enhanced electron fraction within its HII region may promote subsequent star formation, albeit of stars possibly of lower mass (O’Shea et al. 2005). Fourthly, supernovae from the first stars may create bubbles larger than their HII regions. Finally, as we discuss in § 5.2, Lyman-Werner radiation may destroy molecular hydrogen in neighbouring haloes, thus limiting the number of stars that form in H2-cooled hosts, although stars in atomic-cooled haloes may soon dominate the stellar population. In practice, of course, the ionised region will not be spherical but will depend on the morphology of the surrounding gas distribution.
We have estimated the size of an HII region using a steady-state 1-D code. The recombination rate is governed by the rate coefficient, (cm3s-1) (Hutchins 1976), and the temperature of the ionised gas is set to K. The size of the HII region is taken simply to be the radius at which the recombination rate within the sphere is equal to the ionising photon production rate. We assume that the gas follows an NFW profile (Navarro, Frenk & White 1996, 1997) with a concentration of 1.75 at , and 1.87 at , which provides a good fit to the dark matter profile in the simulation (G05). To estimate the effects of the shock front, we smooth the gas in the central portion of the HII region to have a uniform density over the sound crossing distance for a star with a 2.5 Myr lifespan (assuming ionised gas at 104K). This smoothing also makes the estimated HII region size less sensitive to the assumed profile shape. The mass density surrounding the largest halo in the simulation approximately follows an NFW profile extrapolation until it reaches 10 times the mean density at 3, beyond which we assume a uniform density.
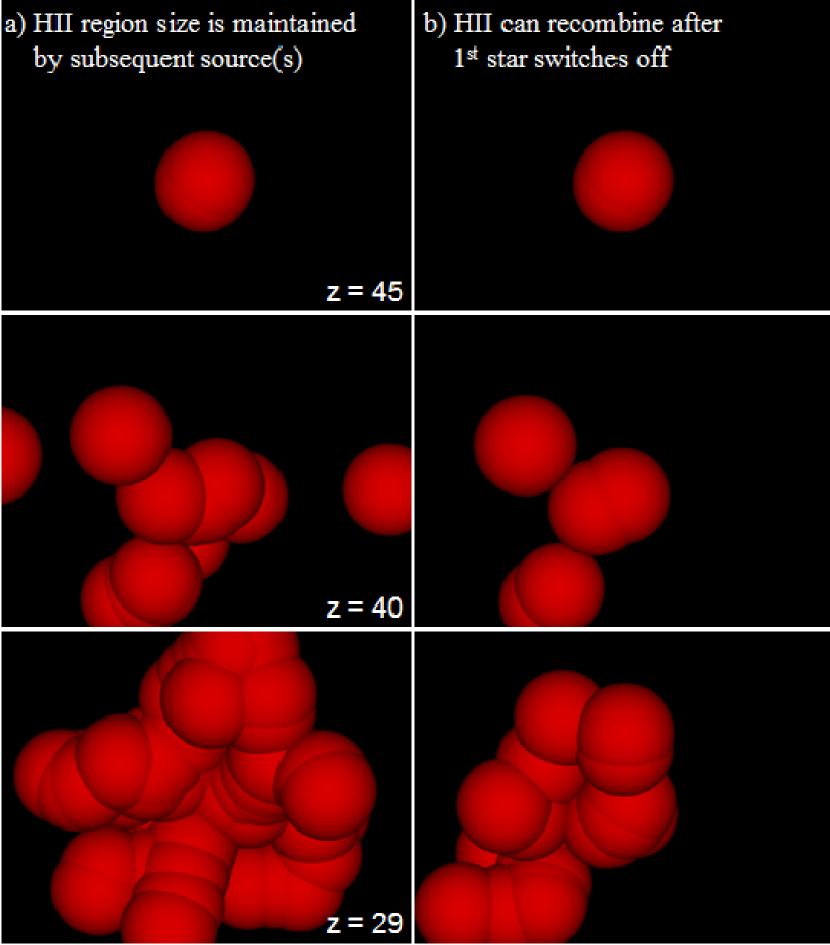
For the fiducial m120f case, at redshift 47, the HII region extends just beyond the virial radius, to in our calculation. However, by redshift 29, physical densities are low enough that over half the ionising photons from a single 120 star will escape a halo of the characteristic mass for H2-cooled haloes at this redshift (). Additionally, a much larger number of haloes are now susceptible to H2 cooling, raising the possibility that percolation of HII regions could create a large HII bubble. At , the HII region around a single 120 star would extend to 9rvir (21 h-1kpc, comoving). This is large enough for the entire 75 h-1kpc (comoving) radius region that we have simulated to have an HII filling factor of 1, provided that each halo maintains a similar sized HII region. Of course, such regions are rare and the contribution to the ionised volume of the universe as a whole is small (see § 5.3). The percolation of these HII bubbles is illustrated in Fig. 7, left panel. This scenario is probably unrealistic due to short recombination times of 1 Myr in the high density ( 10 times the mean density) vicinity of these haloes, and due to potential removal of gas by feedback. The short recombination times imply that percolation of ionised bubbles will be significantly reduced if a new ionising source(s) does not form before the end of the first star’s lifetime. The right-hand panel in Fig. 7 illustrates how percolation will be reduced if each HII region survives only one recombination time after the lifetime of the primary star. Finally, we have considered whether Compton cooling could affect the size of individual HII regions by enhancing the recombination rate, and find that this effect is likely to be unimportant over the lifetime of a massive star. At redshift 29, the 1.4 Myr Compton cooling timescale is of similar order, but generally longer than the typical local recombination time.
Thus, while the size of an HII region is quite uncertain, it seems possible that a large bubble around the first star-forming halo could become ionised well before the rest of the universe. One might then expect similarly large and widely separated HII bubbles to be scattered throughout the Universe prior to reionisation.
5.2 Feedback from the first generation of stars
In § 4, we neglected the impact of the collapse of the first stars on neighbouring haloes. The picture we have presented so far only takes into account the ability of a halo to cool and form stars according to local criteria without taking into account external influences. We now briefly discuss how negative feedback from the first stars may impact star formation in the surrounding region.
There are three (possibly more) feedback mechanisms that could mean that the ability of a halo to cool is not a local process, and does not depend solely on the mass of the dark matter halo and its formation history.
-
•
Lyman-Werner radiation: Radiation in the Lyman-Werner bands can dissociate hydrogen molecules. If the destruction rate exceeds the rate of production, the halo will not build up the amount of H2 needed to cool. As a result, the formation of the first star may “sterilise” the surrounding region and prevent other stars from forming (e.g. Haiman, Rees, & Loeb 1997; Ciardi, Ferrara, & Abel 2000; Haiman, Abel, & Rees 2000; Ricotti, Gnedin, & Shull 2002; Mackey, Bromm, & Hernquist 2003; Yoshida et al. 2003).
The photo-dissociation timescale for is given by
(10) (11) (Abel et al. 1997), where jLW is the Lyman-Werner flux at eV in units of . In the absence of self-shielding, the transmission factor Ftrans is equal to 1.
It is convenient to parameterise the dissociation timescale in terms of the photo-dissociating luminosity (12.24ev-13.51ev) for the fiducial 120 star :
(12) where d is the distance from the star in comoving Mpc.
In the absence of self-shielding (see below), a single star produces enough Lyman-Werner flux to dissociate H2 within a volume of 1 comoving Mpc3. (Here, the “sterilisation by dissociation” radius is determined by estimating the distance at which the dissociation timescale is comparable to the H2 formation timescale, which is typically 1 Myr.)
This calculation ignores the fact that the surrounding haloes are likely to contain dense cores. If the optical depth in these regions is sufficiently high, the inner mass will escape dissociation because of self-shielding in the outer parts (e.g. Glover & Brand 2001; Kitayama et al. 2001; Machacek et al. 2001). Unfortunately, the effectiveness of self-shielding depends on the internal velocity structure of the halo gas caused by infall and turbulent motions. The properties of these flows are uncertain and they will be difficult to model adequately even in the highest resolution simulations.
If the gas velocities are negligible, the transmission factor is given approximately by:
(13) (Draine & Bertoldi 1996), where N is the H2 column density, integrated from outside-in. Because it neglects gas motions, this calculation gives the maximum possible self-shielding (Machecek et al. 2001). For an NFW halo profile with a concentration of 1.75, and assuming that the H2 density traces the mass density, Eqn. 13 implies that 90 of the H2 mass () will be prone to dissociation by a single 120 star located at a distance of 65 kpc at redshift 45, for a typical fraction of 10-4. This implies that dissociation is still important at large distances. For the typical halo separation in our simulations ( 10 h-1kpc), a transmission factor of less than 1.5 would be required to ensure nett H2 production (Myr) at redshift 45. However, at this distance, the central baryonic mass that is adequately shielded is much less than that required to form a massive star unless either the baryon density or the H2 fraction are significantly enhanced. On the other hand, baryonic cooling is likely to concentrate baryons strongly towards the halo centre (e.g. Yoshida et al. 2003), increasing the Lyman-Werner optical depth and decreasing the effect of Lyman-Werner feedback. These issues can only be addressed with detailed numerical hydrodynamic simulations.
We estimate that neither L-W shielding by intergalactic H2 nor by intergalactic neutral Hydrogen will be important. Using the transmission factor of Eqn. 13, and assuming a primordial H2 fraction of 10-6 at redshift 50, L-W shielding by intergalactic H2 will be negligible except over very large distances ( at 1 Mpc, comoving). This estimate likely over-predicts the inter-galactic shielding effect because doppler shifts due to Hubble expansion and intrinsic gas motions will decrease the optical depth. More importantly, any shielding by inter-galactic H2 will be short-lived because it will quickly be dissociated. Shielding by inter-galactic neutral hydrogen is also ineffective because L-W absorption will be largely confined to the closely spaced lyman series lines in the upper energy L-W bands. Even at a distance of 1 Mpc (comoving), less than half of total L-W radiation will be absorbed by neutral H at redshift 50.
We have rerun our H2 production model including the dissociating effects of Lyman-Werner radiation under the assumption that self-shielding is unimportant. The L-W flux from a single 120 star is enough to quickly sterilise the entire (75 h-1kpc comoving radius) high resolution subvolume of the R4 simulation. However, if we then switch off the L-W flux after a 2.5 Myr stellar lifetime, a second halo is able to produce enough H2 to meet the baryonic cooling criteria within 1 - 2 Myr. Thus, the sterilising effects of a single massive star are temporary, but may nevertheless limit the star formation density to 1 star per comoving Mpc per Myr in H2-cooled hosts. However, if self-shielding within dense baryonic cores can cause a significant time delay between the onset of baryonic collapse and subsequent sterilisation of neighbouring haloes, then there may exist a brief window during which multiple haloes will have time to produce enough H2 for baryonic cooling. A sufficiently long window could allow a rapid “mini-burst” of H2 induced population III star formation in a previously sterilised region.
Thus, depending on the detailed structure of collapsing clouds, the radius out to which Lyman-Werner feedback is effective could be as large as 1 Mpc, which would substantially limit the number of haloes that undergo collapse via H2 cooling. Self-shielding is likely to mediate this feedback to some degree, but it is probably unimportant except for dense baryonic cores. However, we stress that even if all the H2 in a halo were destroyed by external Lyman-Werner radiation, atomic cooling alone should still be sufficient to trigger baryonic collapse in our haloes once they reach a sufficiently high virial temperature (e.g. Omukai 2001).
-
•
X-ray and far UV radiation: The first supernovae and mini-qso’s will bathe the surrounding region with ionising photons (e.g. Madau et al. 2004). Those of sufficiently high energy have small ionisation cross-sections and will escape from the HII region. However, even if they only ionise a small fraction of the neutral hydrogen in a nearby halo, the increase in the free electron density will catalyse the production of H2. If this process is significant in the centres of these haloes, it would promote the collapse of their gas, acting as a positive feedback mechanism (e.g. Haiman, Rees, & Loeb 1996; Haiman, Abel, & Rees 2000; see however, Machacek, Bryan, & Abel 2003, who find that a uniform X-ray background has little effect on H2-induced cooling and collapse of haloes in simulations).
-
•
Metal enrichment and SNe: The energy released by the explosion of the first SNe sends a blast wave into the surrounding IGM. If cooling haloes are fragile, the associated mechanical energy can remove portions of their outer envelope and prevent further cooling (e.g. Rees 1985; Bromm, Yoshida, & Hernquist 2003; Kitayama & Yoshida 2005).
Pop. III stars with masses in a narrow range around 200 are thought to end their life as a pair production supernova (e.g. Heger & Woosley 2002). In this case, the supernova ejecta is very metal rich and, if this material mixes in with the gas in nearby haloes, the overall gas cooling efficiency will be enhanced. Metal enrichment is, in any case, required in order to enhance baryon cooling at low temperatures (104K) so as to promote the fragmentation that results in the low-mass IMF typical of population II stars (Schneider et al. 2002, 2003; Mackey, Bromm, & Hernquist 2003). At redshift 30, energetic () SNe blastwaves may expand up to 20 kpc (comoving) before the initial fast expansion is “stalled” (estimated according to Yoshida, Bromm, & Hernquist 2004), suggesting that metal enrichment from neighbouring haloes is possible.
Thus, supernovae blast waves can produce both positive and negative feedback. However, the region affected by these processes is likely to be small compared to the region potentially affected by the Lyman-Werner radiation.
-
•
H- Photo-detachment Another possible mechanism suppressing H2 formation is the photo-detachment of H- ions before they can combine with a hydrogen atom to produce H2. We estimate the radius over which photo-detachment suppresses H2 formation by equating the photo-detachment rate to the rate at which H- reacts to form H2 (; rate taken from Hirasawa 1969), assuming virial overdensity. We assume the effective temperature and luminosity of a 120 Pop. III star from Schaerer (2002), and employ the Tegmark et al. (1997) fitting function to photo-detachment cross-sections from Wishart (1979). This yields a photo-detachment distance of 2.5 kpc (comoving) at , roughly equal to the virial radius of a typical halo on the verge of baryonic cooling at this time, and much smaller than the HII region expected from such a massive star. Thus we do not expect H- photo-detachment by Pop. III stars to impact baryon cooling in neighbouring halos.
In summary, our calculations show that Lyman-Werner radiation could “sterilise” a region as large as 1 Mpc (comoving) around a primordial massive (120 ) star. However, the effects of self-shielding are so uncertain that we cannot rule out the possibility that dissociation feedback may be ineffective at suppressing further star formation. The uncertainties in other feedback mechanisms are also considerable. In the preceding section we discussed the possibility that the HII regions around the first stars might percolate giving rise to large multi-halo HII bubbles. Whether or not this happens depends primarily on how effective the Lyman-Werner sterilisation is at suppressing star formation in the vicinity of a star, and on the impact of the other feedback schemes discussed above. However, even if sterilisation does occur, this can only delay star formation in the region, since atomic cooling, already possible in 13 haloes in our simulation by , will ultimately become the dominant path for star formation. For the case of maximally effective sterilisation, the S-T number density of haloes capable of atomic cooling surpasses that of H2-cooled haloes ( 1 per h-3Mpc3) by z 25. Gas in atomic-cooled haloes could dominate the total stellar mass and UV radiation considerably earlier than this if, as seems likely, this gas turns into stars more efficiently than gas within H2-cooled haloes due to faster rate and greater temperature sensitivity of atomic cooling.
Unfortunately, it is not yet possible to rule out any particular scenario. We proceed by exploring the extreme case where dissociative feedback is unimportant, and percolation leads to the formation of a large ionised region.
5.3 Contribution to reionisation
The sequence of events following the formation of the first generation of Pop. III stars (z 45) is uncertain because of our poor understanding of the interplay between negative feedback from Lyman-Werner radiation and positive feedback from the X-ray/UV background. If these processes are unimportant or if positive feedback dominates, our calculations suggest that large ( 100 h-1kpc comoving) patches of the universe will be reionised at . The first regions of the universe to collapse may thus become reionised much earlier than the inferred from the WMAP microwave background radiation data (Kogut et al. 2003). This could have dramatic effects on low mass galaxies forming in these regions whose gas could be removed suppressing subsequent star formation.
Observational constraints derived from observations of high redshift QSOs (Fan et al. 2001) and from the temperature of the high redshift IGM (Theuns et al. 2002) imply that complete re-ionisation occurs at . In contrast, the high optical depth for Thomson scattering inferred from the WMAP data suggests a much earlier epoch for reionisation, at least over significant fractions of the Universe. It is interesting to consider whether large patches of early reionisation could reconcile these contradictory constraints (see e.g. Bruscoli, Ferrara, & Scannapieco 2002; Cen 2003; Ciardi, Ferrara, & White 2003; Haiman & Holder 2003; Sokasian et al. 2004). However, according to the number densities inferred from the S-T formula, regions such as the one we have simulated are quite rare and so they can only make a small contribution to global reionisation and to the Thompson optical depth. Moreover, stars in H2-cooled haloes could even delay reionisation if their sterilising effects prevent H2-cooled star formation over large distances. Alternatively, strong Lyman-Werner feedback from the first population III stars might actually expedite reionisation by preventing the expulsion of gas by feedback associated with star formation in early low mass haloes, leaving plentiful gas supplies when haloes grow large enough for efficient atomic cooling.
5.4 Observability
Finally, we consider whether the first generation () of population III stars that is predicted by our simulations could actually be observed. We focus first on the case where H2 is unaffected by feedback processes, which are highly uncertain. The supernovae resulting from the collapse of these stars are potentially observable, particularly if they can be detected as gamma-ray bursts (GBRs). The time dilation of bursts occurring at higher redshifts implies that the source can be observed closer to maximum light, thus compensating for the increasing luminosity distance. In a recent paper, Gou et al. (2004) showed that GRBs can be detected in X-rays out to and beyond in exposure times as short as 300 sec.
The rest-frame ultraviolet emission from the burst will be strongly absorbed shortwards of Ly-, so that detection will need to be made in the mid infrared. Gou et al show that the James Webb Space Telescope will have the required sensitivity to detect GRBs out to in the band in only 1 hour. Detection of GRBs at higher redshift should also be possible in longer wavelength bands and larger exposure times. Radio afterglows may also possible at z 30 (Ioka & Meszaros 2005).
The number of haloes massive enough to support star formation lying in our past lightcone at is of the order of 109, according to the S-T prediction. If we assume that each of these haloes forms a single massive star with a 2.5 Myr lifespan whose endpoint is a GRB, then the event rate over the entire sky would be of the order of one per month. Our estimated abundances (which, as we discussed in § 4.4, are uncertain) are higher than, but in rough agreement with those of Miralda-Escude (2003) who, on the basis of the P-S formula, predicts the highest redshift star in our past lightcone to be at redshift 48, assuming that such stars form in haloes with a virial temperature of 2000K. Our z 50 supernovae rates are of similar order to those predicted by Wise & Abel (2004) on the basis that supernovae are hosted by haloes of mass 10 whose abundances is given by the S-T model. Note that we have ignored GRB beaming in this calculation; the number of observable GRBs that are beamed toward us is likely to be lower by a factor 1001000 (e.g. Frail et al. 2001).
The rate of potentially observable GRBs or SNe forming in haloes where gas has cooled via H2 increases rapidly at lower redshifts. At in our simulation we expect 10 supernovae per day over the entire sky, or 1 per 10 square degrees per year (again, ignoring beaming effects). If sterilisation by Lyman-Werner radiation strongly suppresses star formation, the number of observable GRBs at z29 could be reduced by a significant factor, depending on the uncertain effects of self-shielding. However,even in that case, the number density of haloes capable of sustaining atomic cooling would soon surpass that of H2-cooled haloes, leaving open the possibility of abundant pre-reionisation observational targets. The increase in the expected event rate at lower redshifts suggests that GRBs or SNe should indeed be observable in the pre-reionised universe.
We conclude that if the highest redshift Pop. III stars end their life as GRBs, the prospects for their detection are promising. Even if these stars do not have a GRB phase or if the beaming angle is small, observational evidence of the first stars may still be available, for example, through direct detection of SNe (Panagia 2003) or of emission from an early generation of accreting black holes (e.g. Madau et al. 2004). The difficulty, however, will lie in identifying such rare and faint objects and distinguishing them from foreground contaminants.
6 Conclusions
We have modelled the cooling of gas by molecular hydrogen line emission in a series of N-body simulations in order to identify the first generation of dark matter haloes capable of forming stars. We followed the formation of structure in a region selected to host a rich cluster today, repeatedly resimulating, at increasing resolution, the largest progenitors of a massive halo at the final time. To determine whether the gas is able to cool, we estimated the production rate of H2 and considered the balance between radiative cooling and dynamical heating. The dramatic growth of the halo at early times has the nett effect of delaying, but not preventing the cooling of gas. Our main results are as follows.
-
•
The first star-forming haloes: Since we have followed evolution in a special region of the universe (selected to have a rich cluster today), we find that formation of the first stars occurs significantly earlier than commonly found in simulations of volumes too small to sample such rare overdensities. At a redshift of 47, there is already a population of haloes in the simulation that are undergoing baryonic collapse via H2 cooling and can host the first stars.
The mass of these haloes is typically 2.5 and their comoving space density is comparable to that of dwarf galaxies today. By redshift 29, 80 haloes in the high-resolution simulation subvolume of radius 75h-1kpc are capable of forming stars. The largest halo reaches a virial temperature of 104K, at which gas in equilibrium can begin to cool by more efficient atomic processes, at , potentially giving rise to a first generation galaxy. By , 13 haloes in the simulation have grown large enough to sustain atomic cooling.
-
•
Ionising effects: The formation of the first stars will ionise the gas around them. At , the hydrogen recombination rates are high enough that these HII regions are likely to be contained almost entirely within their own host halo. However, by , gas densities have dropped sufficiently that massive ( 100 ), population III stars are able to ionise regions significantly beyond the halo. Percolation of neighbouring regions could lead to the formation of an HII superbubble. However, such regions would be too widely separated to contribute significantly to reionisation at this time.
-
•
Feedback: Feedback effects that could alter the cooling properties of the gas are likely to occur but their nature (and, in some cases, even their sign) is difficult to calculate. Lyman-Werner radiation from just a single massive star could sterilise a large surrounding volume by dissociating H2, severely limiting star formation throughout the volume. However, the effectiveness of this feedback channel would be limited if the H2 within dense halo cores is self-shielded by the outer halo layers. Supernova feedback could hinder star formation by removing gas, or could enhance star formation by blast wave compression, by metal enrichment, or through high energy radiation which might produce electrons that catalyse H2 formation.
Even if feedback is effective enough to suppress H2 cooling within a region of size 1 Mpc (comoving) around the first star, further star formation is still expected in haloes where gas can cool by atomic processes. This happens as early as in our simulated region.
-
•
Observability: The prospects for observing the very earliest generation of stars are encouraging. The James Webb Space Telescope may be able to view directly pre-reionisation supernovae and gamma-ray bursts from population III objects in the rest-frame mid-infrared (Panagia 2003). X-ray emission or radio afterglow from these early gamma-ray bursts may also detectable (Gou et al. 2004). The event rate of supernovae at and higher could be as large as 10 per day. However, if feedback due to Lyman-Werner radiation is important, the event rate could be substantially lower.
Acknowledgments
DR is supported by PPARC. RGB is a PPARC Senior Fellow. TT thanks PPARC for the award of an Advanced Fellowship. The simulations were performed as part of the Virgo consortium programme, on the IBM Regatta at Max Planck Inst. für Astrophysik in Garching, Germany, and on the Cosmology Machine supercomputer at the Institute for Computational Cosmology in Durham, England. We are grateful for insightful and constructive criticism by the referee, Noaki Yoshida.
References
- (1) Abel T., Anninos P., Zhang Y., Norman M., 1997, NewA, 2, 181
- (2) Abel T., Bryan G., Norman M. L., 2000, ApJ, 540, 39
- (3) Abel T., Bryan G., Norman M. L., 2002, Science, 295, 93
- (4) Anninos P., Norman M. L., 1996, ApJ, 460, 556
- (5) Bardeen J., Bond R., Kaiser N., Szalay, L., 1986, ApJ, 305, 15
- (6) Barkana R., Loeb A., 2004, ApJ, 609, 474
- (7) Bond R., Cole S., Efstathiou G., Kaiser N., 1991, ApJ, 379, 440
- (8) Bower R., 1991, MNRAS, 248, 332
- (9) Bromm V., Coppi P. S., Larson R. R., 1999, ApJ, 527, L5
- (10) Bromm V., Coppi P. S., Larson R. R., 2002, ApJ, 564, 23
- (11) Bromm V., Larson R., 2004, ARA&A, 42, 79
- (12) Bromm V., Loeb A., 2004, NewA, 9, 353
- (13) Bromm V., Yoshida N., Hernquist L., 2003, ApJ, 596, L135
- (14) Bruscoli M., Ferrara A., Scannapieco E., 2002, MNRAS, 330, L43
- (15) Cen R., 2003, ApJ, 591, 12
- (16) Ciardi B., Ferrara A., Abel T., 2000, ApJ, 533, 594
- (17) Ciardi B., Ferrara A., White S., 2003, MNRAS, 344, L7
- (18) Ciardi B., Ferrara A., 2005, Space Science Reviews, 116, 625
- (19) Davis, M., Efstathiou, G., Frenk, C.S., White, S.D.M., 1985, ApJ, 292, 381
- (20) Draine B., Bertoldi F., 1996, ApJ, 468, 269
- (21) Frail D., et al. , 2001, ApJ, 562, 55
- (22) Eke V.R., Cole S., Frenk C. S., 1996, MNRAS, 282, 263
- (23) Fan X., et al. , 2001, AJ, 122, 2833
- (24) Galli D., Palla F., 1998, A&A, 335, 403
- (25) Gao L., Loeb A., Peebles P., White S., Jenkins A., 2004a ApJ, 614, 17
- (26) Gao L., White S., Jenkins A., Stoehr F., Springel V., 2004b, ApJ, 355, 819
- (27) Gao L., De Lucia G., White S., Jenkins A., 2004c, ApJ, 352, L1
- (28) Gao L., White S. D. M., Jenkins A., Frenk C. S., Springel V., 2005, astro-ph/0503003, G05
- (29) Glover S., Brand P., 2001, MNRAS, 321, 385
- (30) Gou L., Mesazaros P., Abel T., Zhang B., 2004, ApJ, 604, 508
- (31) Haiman Z., Rees M., Loeb A., 1996, ApJ, 467, 522
- (32) Haiman Z., Rees M., Loeb A., 1997, ApJ, 476, 458
- (33) Haiman Z., Abel T., Rees M., 2000, ApJ, 534, 11
- (34) Haiman Z., Holder G., 2003, ApJ, 595, 1
- (35) Heger A., Woosley S., 2002, ApJ, 567, 532
- (36) Hirasawa T., 1969, Prog. Theor. Phys., 42, 523
- (37) Hutchins J.B., 1976, ApJ, 205 103
- (38) Ioka K., Meszaros P., 2005, ApJ, 619, 684
- (39) Jenkins A., Frenk C. S., White S. D. M., Colberg J., Cole S., Evrard A., Couchman H., Yoshida N., 2001, MNRAS, 321, 372
- (40) Kitayama T., Susa H., Umemura M., Ikeuchi S., 2001, MNRAS, 326, 1353
- (41) Kitayama T., Yoshida N., Susa H., Umemura M., 2004, ApJ, 613, 631
- (42) Kitayama T., Yoshida N., 2005, astro-ph/0505368
- (43) Kogut A., et al. , 2003, ApJS, 148, 161
- (44) Lacey C., Cole S., 1994, MNRAS, 271, 676
- (45) Machacek M., Bryan G. L., Abel T., 2001, ApJ, 548, 509
- (46) Machacek M., Bryan G. L., Abel T., 2003, MNRAS, 338, 273
- (47) Mackey J., Bromm V., Hernquist L., 2003, ApJ, 586, 1
- (48) Madau P., Rees M., Voloteri M., Haardt F., Oh S., 2004, ApJ, 604, 484
- (49) Miralda-Escudé J., 2003, Science, 300, 1904
- (50) Mo H., White S. D. M., 1996, MNRAS, 282, 347
- (51) Nakamura F., Umemura M., 2001, ApJ, 548, 19
- (52) Navarro J. F., Frenk C. S., White S. D. M., 1996, ApJ, 462, 563
- (53) Navarro J. F., Frenk C. S., White S. D. M., 1997, ApJ, 490, 493
- (54) Navarro J. F., Hayashi E., Power C., Jenkins A., Frenk C., White S., Springel V., Stadel J., Quinn T., 2004, MNRAS, 349, 1039
- (55) Nishi R., Susa H., 1999, ApJ, 523, L103
- (56) Omukai K., Nishi R., 1999, ApJ, 518, 64
- (57) Omukai K., 2001, ApJ, 546, 635
- (58) Omukai K., Palla F., 2003, ApJ, 589, 677
- (59) O’Shea B., Abel T., Whalen D., Norman M., 2005, ApJ, 628, L5
- (60) Panagia N., 2003, CHJA&A, 3, 115
- (61) Peebles P., Dicke R., 1968, ApJ, 567, 515
- (62) Press W.H., Schechter P., 1974, ApJ, 187, 425
- (63) Reed D., Gardner J., Quinn T., Stadel J., Fardal M., Lake G., Governato F., 2003, MNRAS, 346, 565
- (64) Rees, M. J., 1985, MNRAS, 213P, 75
- (65) Ricotti M., Gnedin N., Shull M., 2002, ApJ, 575, 49
- (66) Saslaw W., Zipoy D., 1967, Nature, 216, 976
- (67) Schaerer D., 2002, A&A, 382, 28
- (68) Schneider R., Ferrara A., Natarajan P., Omukai K., 2002, ApJ, 571, 30
- (69) Schneider R., Ferrara A., Salvaterra R., Omukai K., Bromm V., 2003, Nature, 422, 869
- (70) Seljak U., Zaldarriaga M., 1996, ApJ, 469, 437
- (71) Sheth R., Tormen G., 1999, MNRAS, 308, 119
- (72) Singh S., Ma C., 2002, ApJ, 569, 1
- (73) Sokasian A., Yoshida N., Abel T., Hernquist L., Springel V., 2004, MNRAS, 350, 47
- (74) Spergel D., et al. , 2003, ApJS, 148, 175
- (75) Springel V., Yoshida N., White S. D. M., 2001, NewA, 6, 79
- (76) Springel V., 2005, astro-ph/0505010
- (77) Springel V., et al. , 2005, Nature, 435, 629
- (78) Tegmark M., Silk J., Rees M., Blanchard A., Abel T., & Palla F., 1997, ApJ, 474, 1
- (79) Theuns T., Schaye J., Zaroubi S., Kim T., Tzanavaris P., Carswell B., 2002, ApJ, 567, 103
- (80) Whalen D., Abel T., Normal M., 2004, ApJ, 610, 14
- (81) White S. D. M., Springel V., 2000, “Where are the first starts now?”, The First Stars, Proceedings, eds Weiss A., Abel T., & Hill V., Springer, p. 327
- (82) Wishart A., 1979, MNRAS, 187, 59
- (83) Wise J., Abel T., 2005, ApJ, 629, 615
- (84) Yamamoto K., Sugiyama N., Sato H., 1998, ApJ, 501, 442
- (85) Yoshida N., Sheth R., Diaferio A., 2001, MNRAS, 328, 669
- (86) Yoshida N., Sugiyama N., Hernquist L., 2003, MNRAS, 344, 481
- (87) Yoshida N., Abel T., Hernquist L., Sugiyama N., 2003, ApJ 592, 645
- (88) Yoshida N., Bromm V., Hernquist L., 2004, ApJ, 605, 579
Appendix A
In this appendix, we discuss the production of H2, comparing our method for calculating f with that employed by Tegmark et al. (1997) and Yoshida et al. (2004). As the electrons left over from recombination are depleted, the production of H2 slows down. This leads to the “asymptotic” H2 fraction, , where is assumed to be equal to the virial temperature of the halo (see Eqn. 17 of Tegmark et al. 1997).
Since , where M is the halo mass, it follows that as the halo grows in mass, where is the H2 production rate needed to sustain , which increases as the halo grows. The asymptotic H2 abundance is maintained only if the halo growth is sufficiently slow so that the actual production rate
| (14) |
where is the halo H2 production rate. If the halo grows too rapidly, molecular hydrogen production will not be able to keep up (even with the primordial abundance of free electrons) and the cooling efficiency of the halo will be reduced. In Fig. 8, we show that the H2 production rate for our largest halo drops below the rate required to maintain the asymptotic H2 abundance at . This means that for , f for the halo increases more slowly than because of the high halo growth rate. Similar curves are readily produced for other high redshift haloes. It is thus necessary to estimate H2 abundances by integrating over time, rather than by simply adopting “asymptotic” H2 abundances (we also include dilution effects due to mergers as described in § 3). Some haloes have periods where (calculated from Eqn. 2) is larger than , in which case we assume that electron depletion limits H2 production to .
