Central Blue Clumps in Elliptical Galaxies of the Hubble Ultra Deep Field
Abstract
Elliptical galaxies larger than 10 pixels in the Hubble Ultra Deep Field (UDF) were surveyed for internal structure; 30 out of 100 in a sample of 884 morphologically classified galaxies exhibit large blue clumps near their centers. Unsharp-masked images of the best cases are presented. The distributions of the clumps on color-color and color-magnitude diagrams are about the same as the distributions of isolated objects in the UDF field with the same size, suggesting a possible accretion origin. In the few cases where redshifts are published, the clump masses and star-formation ages were determined from stellar evolution models, as were the galaxy masses. The clump mass scales with galaxy mass, probably because of selection effects, and ranges from M⊙ to M⊙ for galaxies with masses from M⊙ to M⊙. The clump star formation age ranges between yr and yr. With partial evaporation and core contraction in the intervening years, some of these clumps could resemble globular clusters today. Stars that evaporate will contribute to the field population in the elliptical galaxy.
1 Introduction
High resolution images of distant galaxies have revealed many mergers and interactions (e.g., Abraham et al. 1996; Conselice et al. 2003; Conselice 2004; Papovich et al. 2005), as might be expected from hierarchical galaxy build-up (see simulations by Murali et al. 2002). When mergers trigger star formation, the resulting galaxies can be blue and clumpy. Hubble Space Telescope (HST) surveys have confirmed there is a blue population of elliptical galaxies comprising 15% to 30% of the total ellipticals between z=0.1 and 1 (Menanteau et al. 1999; Im et al. 2001; Gebhardt et al. 2003). Color gradients also indicate blue cores and other inhomogeneities in over 30% of resolved ellipticals in the Tadpole field (Menanteau et al. 2004) and in the Hubble Deep Fields North and South (Menanteau, Abraham, & Ellis 2001). Sanchez et al. (2004) found that 25% of the AGN elliptical hosts at redshifts between 0.5 and 1.1 have evidence of central merging. Elliptical galaxies at have star formation time scales less than 1 Gy (Cross et al., 2004). These observations suggest star-formation and galaxy buildup occurs over a wide range of redshifts (Franceschini et al. 1998; Menanteau, Jiminez, & Matteucci 2001).
Nearby elliptical galaxies also suggest a history of mergers and accretions because of internal sub-structure (Redna et al. 2004) and counter-rotating central disks (e.g., Jedrzejewski & Schechter 1988; Carollo et al. 1997; Mehlert et al. 1998; Krajnovic & Jaffe 2004; Morelli et al. 2004). Double nuclei have been reported in several ellipticals (Lauer et al. 1996). Enhanced images sometimes reveal inner spirals or arcs (Lauer et al. 1995) or dust lanes and filaments (Carollo et al. 1997; Elmegreen et al. 2000; Hunt & Malkan 2004). Faber et al. (1999) found that typical elliptical nuclei have a broad range of stellar ages, from 2 to 12 Gy. Marcum, Aars, & Fanelli (2004) examined the colors and profiles of nearby isolated ellipticals and found that some have blue central regions from possible merger events 1-2 Gy ago, even if they show no unusual morphology.
Here we present data on 100 elliptical-like galaxies in the Hubble Ultra Deep Field (UDF), of which 30 show evidence of clumps near their centers in unsharp-masked images.
2 Data and Results
The UDF images were observed and processed by Beckwith et al. (2005) and are available on the Space Telescope Science Institute (STScI) archive. The UDF consists of images in 4 filters: F435W (B band, hereafter B435; 134880 s exposure), F606W (V band, V606; 135320 s), F775W (i band, i775; 347110 s), and F850LP (z band, z850; 346620 s). The images are 10500 x 10500 pixels with a scale of 0.03 arcsec per px.
We classified all galaxies larger than 10 pixels by eye on the i775 image, making a catalog of 884 objects (Elmegreen et al. 2005). Elliptical galaxies were identified by their optical appearance, contour plots, and radial profiles. Integrated magnitudes were measured in a rectangular box defined by the i775 isophotal contours 2 above the sky noise for each filter (corresponding to a surface brightness of 26.0 mag arcsec-2). The integrated i775-z850 colors of the elliptical galaxies range from to 1.1, with an average of 0.2 to 0.3. The integrated i775 magnitudes range from 20.3 to 26.5 mag.
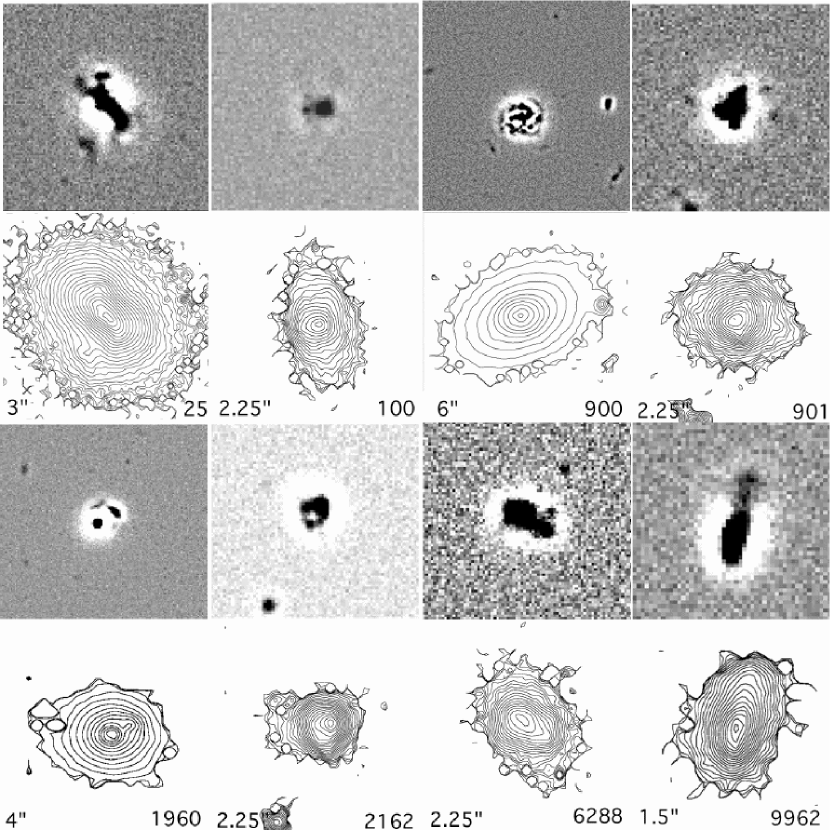
Thirty ellipticals (Table 1) have clumpy structure near their centers. We enhanced these clumps with unsharp-masked techniques by subtracting a 5-pixel Gaussian smoothed image from the originals. Figure 1 shows enhanced images of 8 of them. The figure also shows contour plots on a logarithmic scale, with the lowest contour drawn 1 above sky noise, corresponding to a surface brightness of 26.8 mag arcsec-2. In each contour panel, the lower left-hand number represents the horizontal scale of the image in arcsec, and the lower right-hand number is the galaxy identification in the UDF catalog by Beckwith et al., as listed on the STScI website. 111http://archive.stsci.edu/pub/hlsp/udf/acs-wfc/h_udf_wfc_VI_I_cat.txt
In most galaxies, the clumps are randomly oriented in the galaxy with respect to the major axis. Some are very close to the center, and some are partway out in the galaxy. Sometimes bar-like or disk-like central structures are seen (as in UDF25 and UDF9962). These tend to be aligned with the galaxy’s major axis. UDF 2162 shows a ring with three embedded clumps near the nucleus. UDF900 has an inner spiral with several clumps along the spiral arms (reminiscent of the spiral in IC 3328 – Jerjen, Kalnajs, & Binggeli 2000).
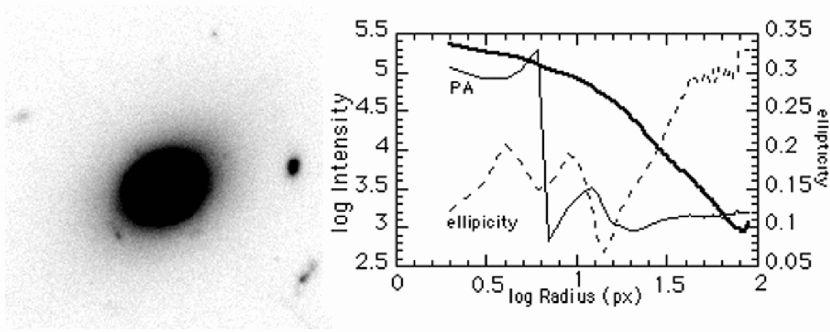
Figure 2 shows how a typical elliptical, UDF900, appears featureless on a normal grayscale image. The radial profile from ellipse fits is either a de Vaucouleurs r1/4 law or a double power (Sersic) law. For the double power law, the inner slope is and the outer is steeper, , as in a “core” galaxy (Trujillo et al. 2004). The galaxy’s position angle and ellipticity are shown as a function of radius; the spiral appears as an abrupt change near the center.
The colors and magnitudes of clumps in each galaxy in Table 1 were measured by photometry on a box encompassing the peaks, typically 3-5 px across. We subtracted the underlying galaxy intensity from the clump intensity by measuring the featureless regions adjacent to each clump. This background subtraction typically made the clumps 0.1 mag bluer in and 0.4 mag dimmer in i775. The measuring errors are about 0.1 mag for the UDF images. Figure 3 (top left) plots B435-V606 versus for the clumps and nuclei of the galaxies in Table 1, and for all 100 elliptical galaxies in integrated light. For each galaxy, the integrated colors are redder than the clumps by several tenths of a magnitude. In some galaxies the nuclei are blue in i775-z850. Figure 3 (bottom left) shows i775 versus for the clumps and the integrated galaxies. The large spread in color for clumps fainter than i mag is probably the result of low signal-to-noise. The clumps average mag fainter than the integrated galaxies.
If the clumps in these elliptical galaxies have been accreted, then the field should contain isolated objects that are similar in color and magnitude. The right hand side of Figure 3 shows sources in the UDF catalog that have sizes between 3 and 4 pixels FWHM. This is approximately the size range for the clumps in our elliptical galaxy sample. The color-magnitude and color-color distributions of the tiny field clumps resemble the distributions for the elliptical galaxy clumps, lending credibility to the accretion model.
The redshifts of four of our clumpy ellipticals were measured by Vanzella et al. (2004) and are listed in Table 2. They range from to , illustrating how clump formation or accretion occurs during a wide range of epochs. The same survey found the redshifts of 2 other ellipticals that do not have obvious clumps, UDF 3088 and UDF 9264. Using these redshifts, we converted the apparent magnitudes into absolute i775 AB magnitudes and obtained the major axis galaxy diameters, considering a standard cosmology. The background-subtracted B435-V606, V606-i775, and i775-z850 colors and the i775-band magnitudes of the clumps and whole galaxies were also compared to Bruzual & Charlot (2003) evolution models in order to estimate the masses, ages, and star formation decay times, assuming an exponential star formation rate. Two values of the internal dust extinction were taken, one from Rowan-Robinson (2003) for the appropriate redshifts and another four times larger for comparison. The Rowan-Robinson extinctions are slightly lower than others measured for spirals at the same redshift (Adelberger & Steidel 2000; Papovich, Dickinson, & Ferguson 2001), but they may be a good approximation for ellipticals; the second case with higher values should bracket most previous results. Absorption from intervening hydrogen lines and continuum were included, from Madau (1995). The models are discussed in Elmegreen & Elmegreen (2005).
The model results are in Table 2. The clump masses range from M⊙ to M⊙, with slightly larger values for higher extinctions (as shown in parentheses). The star formation ages of the clumps are typically yr for low extinction and several yr for high extinction. Clump diameters are several hundred pc to a kpc. Only clumps that gave close fits to the model colors (with an rms deviation from all 3 colors less than several tenths) are listed with a mass and age. For the whole galaxies, the star formation ages are much longer than for the clumps, but still less than the age of the Universe at that redshift. This suggests the ellipticals either have lingering star formation or contain other, more dissolved, clumps spanning a wide range of ages. To give an upper limit to the whole galaxy mass, solutions were also found for assumed ages equal to the galaxy age if star formation started at and then decayed exponentially. In these cases, the decay time was chosen to match the colors. These results are given in square brackets. Typically the galaxy mass increases by a factor of with this assumption. Considering the large measurement and model uncertainties, these results should be viewed as order of magnitude estimates.
The clump ages appear to be comparable to or less than the orbital accretion times for the elliptical galaxies, which typically exceed several hundred My. This implies that most of the young stars formed after the clumps entered the galaxies, if the accretion model is correct. We note from Figure 3 that the elliptical galaxy clumps lie at the lower envelope of the field clump B435-V606 color distribution, consistent with triggered star formation during accretion. Alternatively, the clumps could have formed inside gas clouds that were already in the ellipiticals.
The clump masses are an order of magnitude larger than globular cluster masses. Considering the likely evaporation of cluster stars in the intervening time and the likely central concentration of young stars inside these clumps, some of these objects could turn into globular clusters. This situation slightly resembles models where globular clusters and ellipticals both form during gas-rich mergers (e.g., Ashman & Zepf 1992). However, the clumps here are younger than the relaxation times of the host galaxies, so if they formed when the ellipticals formed, then star formation had to continue for a relatively long time. The observations more resemble models where globular clusters enter a galaxy as parts of dwarf galaxies (e.g., Searle & Zinn 1978). If the observed clumps evaporate more completely, then the elliptical galaxies will become more smooth, leaving only faint remnants of accretion such as those discussed in the introduction.
References
- (1) Abraham, R., Tanvir, N., Santiago, B., Ellis, R., Glazebrook, K., & van den Bergh, S. 1996, MNRAS, 279, L47
- (2) Adelberger, K.L., & Steidel, C.C. 2000, ApJ, 544, 218
- (3) Ashman, K.M., & Zepf, S.E. 1992, ApJ, 384, 50
- (4) Beckwith, S.V.W. et al., 2005, in preparation
- (5) Bruzual, G. & Charlot, S. 2003, MNRAS, 344, 1000
- (6) Carollo, C., Franx, M., Illingworth, G., & Forbes, D. 1997, ApJ, 481, 710
- (7) Conselice, C. 2004, astro-ph/0405102
- (8) Conselice, C., Bershady, M., Dickinson, M., & Papovich, C. 2003, AJ, 126, 1183
- (9) Cross, N.J.G., et al. 2004, AJ, 128, 1990
- (10) Elmegreen, B., & Elmegreen, D. 2005, submitted to ApJ
- (11) Elmegreen, D., Elmegreen, B., Chromey, F., & Fine, M. 2000, AJ, 120, 733
- (12) Elmegreen, D., Elmegreen, B., Rubin, D., & Schaffer, M. 2005, in preparation
- (13) Faber, S., Trager, S., Gonzalez, J., & Worthey, G. 1999, Ap&SS, 267, 273
- (14) Franceschini, A., Silva, L., Fasano, G., Granato, G.L., Bressan, A., Arnouts, S., Danese, L. 1998, ApJ, 506, 600
- (15) Gebhardt, K., et al. 2003, ApJ, 597, 239
- (16) Hunt, L., & Malkan, M. 2004, ApJ, 616, 707
- (17) Im, M., et al. 2001, AJ, 122, 750
- (18) Jedrzejewski, R., & Schechter, P. 1988, ApJ, L330
- (19) Jerjen, H., Kalnajs, A., & Binggeli, B. 2000, A&A, 358, 845
- (20) Krajnovic, D., & Jaffe, W. 2004, A&A, 428, 877
- (21) Lauer, T. et al. 1995, AJ, 110, 2622
- (22) Lauer, T. et al. 1996, ApJ, 471, L79
- (23) Madau, P. 1995, ApJ, 441, 18
- (24) Marcum, P., Aars, C., & Fanelli, M. 2004, AJ, 127, 3213
- (25) Mehlert, D., Saglia, R., Bender, R., & Wegner, G. 1998, MNRAS, 332, 33
- (26) Menanteau, F., Abraham, R., & Ellis, R. 2001, MNRAS, 322, 1
- (27) Menanteau, F. , Ellis, R., Abraham, R., Barger, A., & Cowie, L. 1999, MNRAS, 309, 208
- (28) Menanteau, F., Jiminez, R., & Matteucci, F. 2001, ApJ, 562, L23
- (29) Menanteau, F., et al. 2004, ApJ, 612, 202
- (30) Morelli, L., Halliday, C., Corsini, E., Pizzella, A., Thomas, D., Davies, R., Bender, R., Birkinshaw, M., & Bertola, F. 2004, MNRAS, 354, 753
- (31) Murali, C., Katz, N., Hernquist, L., Weinberg, D., & Dave, R. 2002, ApJ, 571, 1
- (32) Papovich, C., Dickinson, M., & Ferguson, H.C. 2001, ApJ, 559, 620
- (33) Papovich, C., Dickinson, M., Giavalisco, M., Conselice, C., & Ferguson, H. 2005, astro-ph/0501088
- (34) Redna, F., Forbes, D., Beasley, M., O’Sullivan, E., & Goudfrooij, P. 2004, MNRAS, 354, 851
- (35) Rowan-Robinson, M. 2003, MNRAS, 345, 819
- (36) Sanchez, S. et al., 2004, ApJ, 614, 586
- (37) Searle, L. & Zinn, R. 1978, ApJ, 225, 357
- (38) Trujillo, I., Erwin, P., Ramos, A., & Graham, A. 2004, AJ, 127, 1917
- (39) Vanzella, E., Cristiani, S., Dickinson, M., Kuntschner, H., Moustakas, L. A., Nonino, M., Rosati, P., Stern, D., Cesarsky, C., Ettori, S., and 7 coauthors, 2004, astro-ph/0406591
| UDF no. | Features | UDF no. | Features |
|---|---|---|---|
| 25 | central bar; 5 nearby clumps | 3174 | 2 outer clumps |
| 100 | 3 near-nuclear clumps | 3677 | elongated nucleus |
| 153 | 1 near-nuclear clump, 1 mid-disk clump | 4142 | elongated nucleus plus 1 near-nuclear clump |
| 206 | 1 near-nuclear clump | 4389 | central arc plus 2 clumps |
| 221 | 4 near-nuclear clumps | 4445 | 1 nuclear clump, outer streamers |
| 703 | 2 near-nuclear clumps | 4551 | elongated nucleus |
| 900 | central spiral with 10 clumps | 6018 | lumpy nucleus plus 1 nuclear clump |
| 901 | 3 nuclear clumps plus 3 clumps outside nucleus | 6027 | 2 near-nuclear clumps plus 2 outer clump arcs |
| 1088 | nuclear clump plus 2 outer clumps | 6288 | 2 big nuclear clumps plus 3 smaller clumps |
| 1564 | 1 near-nuclear clump plus 2 outer clumps | 8138 | 2 nuclear clumps |
| 1607 | elongated lumpy nucleus | 8680 | elongated nucleus |
| 1727 | elongated nucleus | 9962 | nuclear bar; 2 end-of-bar clumps |
| 1960 | 2 near-nuclear arcs | E1aano UDF numbers are given for three object in our table; we designate them by E1, E2, and E3. Their coordinates are, E1: 3h32m30.4637s, -27∘48′3.068′′; E2: 3h32m42.5604s, -27∘45′50.196′′; E3: 3h32m42.2572s, -27∘49′15.137′′ | 1 near-nuclear clump |
| 2162 | nuclear arc with 3 clumps | E2aano UDF numbers are given for three object in our table; we designate them by E1, E2, and E3. Their coordinates are, E1: 3h32m30.4637s, -27∘48′3.068′′; E2: 3h32m42.5604s, -27∘45′50.196′′; E3: 3h32m42.2572s, -27∘49′15.137′′ | 1 nuclear clump plus 1 outer arc |
| 2974 | 1 near-nuclear clump | E3aano UDF numbers are given for three object in our table; we designate them by E1, E2, and E3. Their coordinates are, E1: 3h32m30.4637s, -27∘48′3.068′′; E2: 3h32m42.5604s, -27∘45′50.196′′; E3: 3h32m42.2572s, -27∘49′15.137′′ | elongated nucleus plus 1 near-nuclear clump |
| Object | zaaRedshifts from Vanzella et al. (2004) | i | B-V | V-i | i-z | I | Diam. | Age FitbbValues in parentheses are for the extinction compared to Rowan-Robinson (2003). | Age MaxccValues are best fits assuming star formation began at redshift . | log MassbbValues in parentheses are for the extinction compared to Rowan-Robinson (2003). | log Mass MaxccValues are best fits assuming star formation began at redshift . |
|---|---|---|---|---|---|---|---|---|---|---|---|
| mag | mag | mag | mag | mag | kpc | My | My | M⊙ | M⊙ | ||
| UDF 153 | 0.98 | 21.59 | 2.05 | 1.45 | 0.88 | 29 | 1900(1900) | 5100 | 11.1(11.8) | 11.6(12.2) | |
| Clump 1 | 28.53 | 1.03 | 0.48 | 0.08 | 0.8 | 180(40) | 7.3(7.5) | ||||
| Clump 2 | 26.67 | 0.80 | 0.21 | 1.7 | 90(14) | 7.7(7.8) | |||||
| UDF 3088 | 0.127 | 25.94 | 1.37 | 1.02 | 0.73 | 1.6 | 4800(1300) | 11000 | 7.1(7.1) | 7.4(7.4) | |
| UDF 4142 | 0.737 | 21.70 | 0.60 | 0.66 | 0.20 | 15 | 120(50) | 6200 | 9.5(9.7) | 10.3(11.0) | |
| Clump 1 | 29.06 | 0.10 | 0.67 | 0.8 | 13(10) | 5.8(6.4) | |||||
| UDF 6027 | 1.317 | 23.80 | 1.12 | 1.23 | 0.91 | 16 | 1000(700) | 3900 | 10.5(11.1) | 10.8(11.5) | |
| Clump 1 | 30.21 | 0.03 | 1.0 | 20( ) | 6.0( ) | ||||||
| Clump 2 | 30.87 | 6.26 | 0.84 | 0.9 | |||||||
| Clump 3 | 31.06 | 3.23 | 1.1 | ||||||||
| Clump 4 | 30.08 | 1.4 | |||||||||
| UDF 9264 | 1.096 | 21.96 | 1.94 | 1.53 | 1.08 | 32 | 1900(1300) | 4600 | 11.2(11.8) | 11.6(12.2) | |
| E2 | 0.218 | 22.36 | 0.28 | 1.04 | 0.18 | 6 | 1200(45) | 10000 | 8.4(8.3) | 8.9(9.4) | |
| Clump 1 | 27.75 | 0.4 |