Sub-arcsec imaging of the AB Aur molecular disk and envelope at millimeter wavelengths: a non Keplerian disk. ††thanks: Based on observations carried out with the IRAM Plateau de Bure Interferometer. IRAM is supported by INSU/CNRS (France), MPG (Germany) and IGN (Spain).
We present sub-arcsecond images of AB Auriga obtained with the IRAM Plateau de Bure interferometer in the isotopologues of CO, and in continuum at 3 and 1.3 mm. These observations allow us to trace the structure of the circumstellar material of AB Aur in regions where optical and IR imaging is impossible because of the emission from the star. These images reveal that the environment of AB Aur is widely different from the proto-planetary disks that surround T Tauri stars like DM Tau and LkCa15 or HAeBe stars like MWC 480, in several aspects. Instead of being centrally peaked, the continuum emission is dominated by a bright, asymmetric (spiral-like) feature at about 140 AU from the central star. Little emission is associated with the star itself. The molecular emission shows that AB Aur is surrounded by a very extended flattened structure (“disk”), which is rotating around the star. Bright molecular emission is also found towards the continuum “spiral”. The large scale molecular structure suggests the AB Aur disk is inclined between 23 and 43 degrees, but the strong asymmetry of the continuum and molecular emission prevents an accurate determination of the inclination of the inner parts. Analysis of the emission in terms of a Keplerian disk provides a reasonable fit to the data, but fails to give a consistent picture because the inclinations determined from J=21, J=21, J=10 and J=10 do not agree. The mass predicted for the central star in such Keplerian models is in the range 0.9 to 1.2 , much smaller than the expected 2.2 from the spectral type of AB Aur. Better and more consistent fits to the J=21, J=10 data are obtained by relaxing the Keplerian hypothesis. We find significant non-Keplerian motion, with a best fit exponent for the rotation velocity law of , but no evidence for radial motions. The disk has an inner hole about 70 AU in radius. The disk is warm and shows no evidence of depletion of CO. The dust properties suggest the dust is less evolved than in typical T Tauri disks. Both the spiral-like feature and the departure from purely Keplerian motions indicates the AB Aur disk is not in quasi-equilibrium. Disk self-gravity is insufficient to create the perturbation. This behavior may be related either to an early phase of star formation in which the Keplerian regime is not yet fully established and/or to a disturbance of yet unknown origin. An alternate, but unproven, possibility is that of a low mass companion located about 40 AU from AB Aur.
Key Words.:
Stars: circumstellar matter – planetary systems: protoplanetary disks – individual: AB Aur – Radio-lines: stars1 Introduction
The existence of disks around Herbig Ae/Be stars is now widely accepted but the physical properties of these disks are poorly known. Contrary to TTauri disks, there are only a few examples of large Keplerian disks around Herbig Ae stars: the A4 star MWC480 (Mannings et al., 1997; Simon et al., 2000), and the A0 star HD 34282 (Piétu et al., 2003).
AB Auriga is one of the nearest, brightest and best studied Herbig Ae stars. It has a spectral type A0-A1 (Hernández et al., 2004) and is located at a distance pc following Hipparcos measurements (van den Ancker et al., 1998). NIR imaging with the HST-STIS (Grady et al., 1999) reveal a large envelope surrounding the star and scattering the stellar light. This flattened reflection nebulae is seen close to pole-on, up to AU from the star. New NIR observations, performed with the Subaru telescope using the Coronographic Imager and Adaptive Optics systems (Fukagawa et al., 2004), show that the circumstellar matter presents a spiral structure. AB Auriga has been also observed in MID-IR spectroscopy with ISO (Meeus et al., 2001; Bouwman et al., 2000). These data constrain the dust content several tens of AUs from the star. The modelling of the SED in this frequency range also shows that the star belongs to the Group I (Meeus et al., 2001). In the classification of Herbig Ae circumstellar matter, stars of Group I are surrounded by a flaring disk responsible for the bump in the MID-IR. The disk was imaged at 11 and 18m by Chen & Jura (2003), using the Keck I telescope. They found the disk is resolved at 18.7m with an approximate diameter of or 170 AU. Technical progresses achieved on optical interferometers allow the first quantitative studies of the very inner disks. Monnier & Millan-Gabet (2002) have shown that in such objects, the very inner dust disk is truncated by sublimation of the dust at temperature around K. For AB Auriga which is a star of K, this happens at AU. Finally, the surrounding material was also observed at millimeter wavelengths by Mannings & Sargent (1997) with OVRO, but the derived inclination () is much larger than that found from all other (optical or IR) tracers ().
Following our successful study of DM Tau in CO isotopologues (Dartois et al., 2003), we decided to perform a similar study of the AB Auriga environment. Therefore, we observed AB Auriga with the IRAM interferometer in J=21, J=10 and J=21, and J=10. We report here the results of this multi-line, CO isotope analysis. Our goals are double: we want to 1) characterize the physical structure of the circumstellar matter (vertical temperature gradient, density, kinematics) and 2) compare quantitatively the large scale mm properties with those of TTauri disks. The observations and the results are described in Sections 2 & 3, respectively. Section 4 presents the best model and we discuss in Section 5, the physical implications.
2 Observations and Results
2.1 PdBI data
The observations used 5 antennas and were carried out in winter 2001/2002 in D and C2 configurations. Baselines up to 170 m provided resolution at PA for the 1.3 mm continuum data. We observed simultaneously at 89.2 GHz (HCO+ J=10, which will be discussed in a forthcoming paper) and 230.5 GHz ( J=21). At 1.3 mm, the tuning was double-side-band (DSB) while at 3.4 mm, the tuning was purely single-side band (LSB). The backend was a correlator with one band of 10 MHz (spectral resolution 0.23 ) centered on the HCO+ J=10 line, one band of 20 MHz (0.18 resolution) centered on the J=21 line, and 2 bands of 160 MHz for the 1.3 mm and 3.4 mm continuum, respectively. The phase and flux calibrators were 0415+379 and 0528+134. The rms phase noise was 8 to 25 and 15 to 50 at 3.4 mm and 1.3 mm, respectively, which introduced position errors of , and a seeing better than . The observation time was shared with other sources: MWC480 and LkCa15 or CQ Tau and MWC758, AB Aur using only a small fraction of the transit time. The total on source integration time is hours. As a consequence, the amplitude and phase calibration of these sources is homogenous and the flux density of all sources were estimated simultaneously. This allows us to make accurate comparisons of the spectral index of the continuum emission. In all cases, the flux density scale was referred to MWC349, for which we used a flux of .
The J=10, J=10 and J=21 observations were performed between 2001 and 2004. Configurations D, C2, B1 (5 antennas) and A (6 antennas) were used, and provided baselines up to 400 m. This provides angular resolution of at PA at 220 GHz, with a residual seeing and position errors after calibration. The correlator provided a spectral resolution of 0.09 for J=21 and 0.18 for the J=10 and J=10 lines. The same phase and flux calibrators were used. The total integration time is around 30 hours, half of which was spent on the long baseline (A configuration) observations.
We used the GILDAS software package to reduce the data. Images are presented at different angular resolutions, obtained by applying a taper and re-weighting the data when needed. However, the natural weights were used in the disk modelling.
2.2 30-m data
In 2000, we also obtained a single-dish spectrum of J=21 at the 30-m telescope, which when compared to the PdB measurements indicates at most 20 % of the flux was missed by the interferometer. Accordingly, it is unlikely that the measurements are significantly affected by missing flux, specially within the inner 10 to 20′′. However, the J=21 line is much brighter and most likely hampered by structures within a more extended region.
3 Results
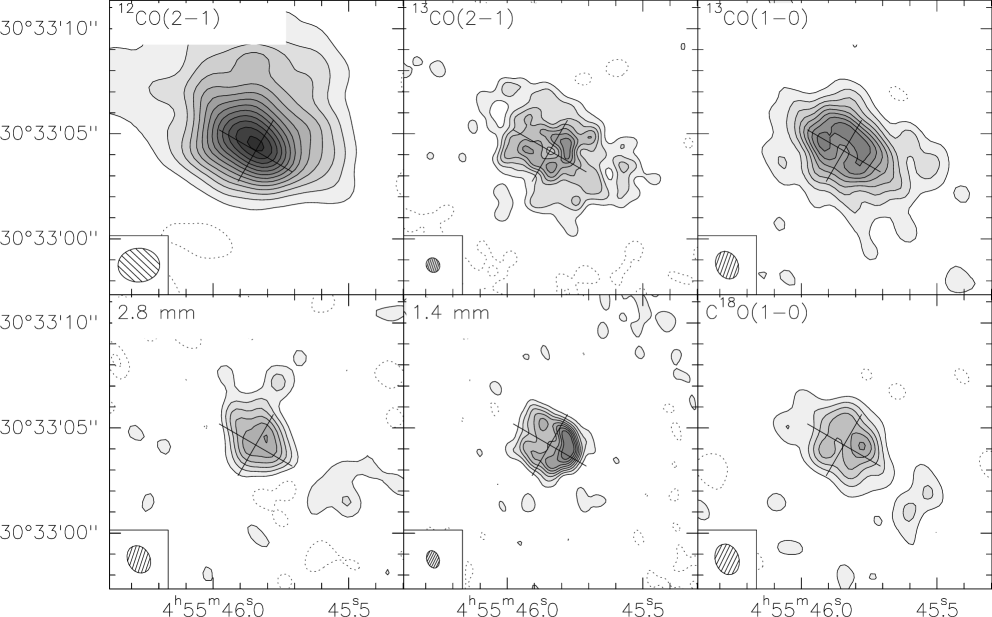
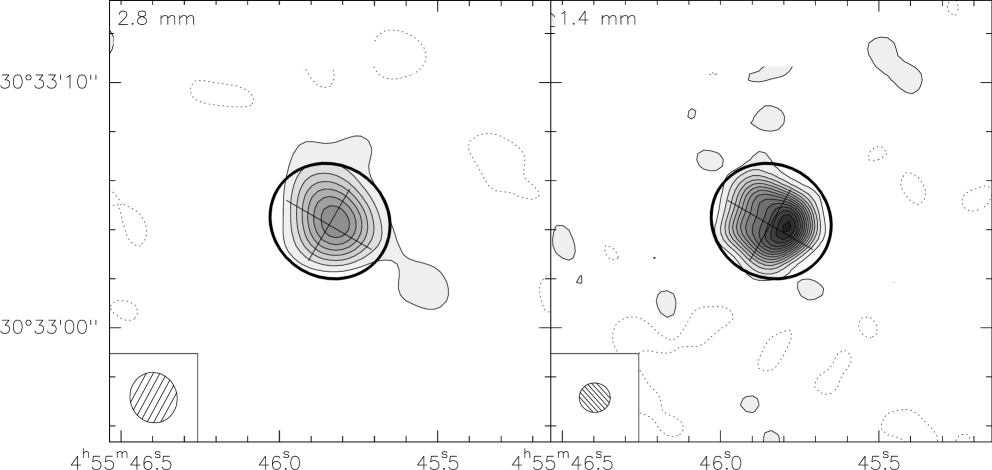
Figure 1 is a montage displaying high resolutions images of the continuum emission at 2.8 mm and 1.4 mm, and of the integrated line emission of J=21 J=21 and J=10 transitions. The 1.4 mm emission was obtained by merging the 220 and 230 GHz data in together to improve signal to noise; the flux was scaled to a reference frequency of 220 GHz assuming a spectral index of 3.0 for the emission. The (lower resolution) emission at 110 GHz is also presented. The total continuum flux at 1.4 mm is mJy, and at 2.8 mm, mJy.
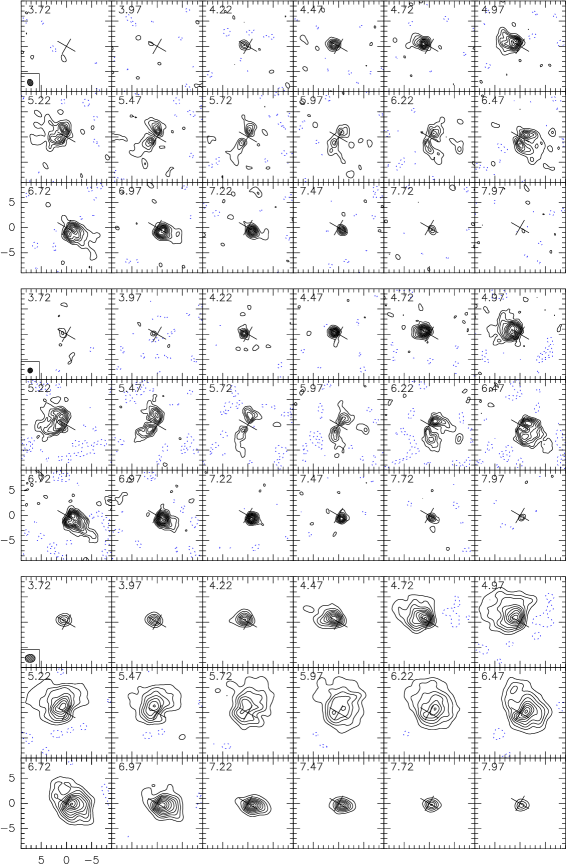
Figure 2 presents the channels maps of the J=21, J=21 and J=10 transitions. The J=21 data has been smoothed to about 1′′ resolution to help the comparison with the J=10 transition.
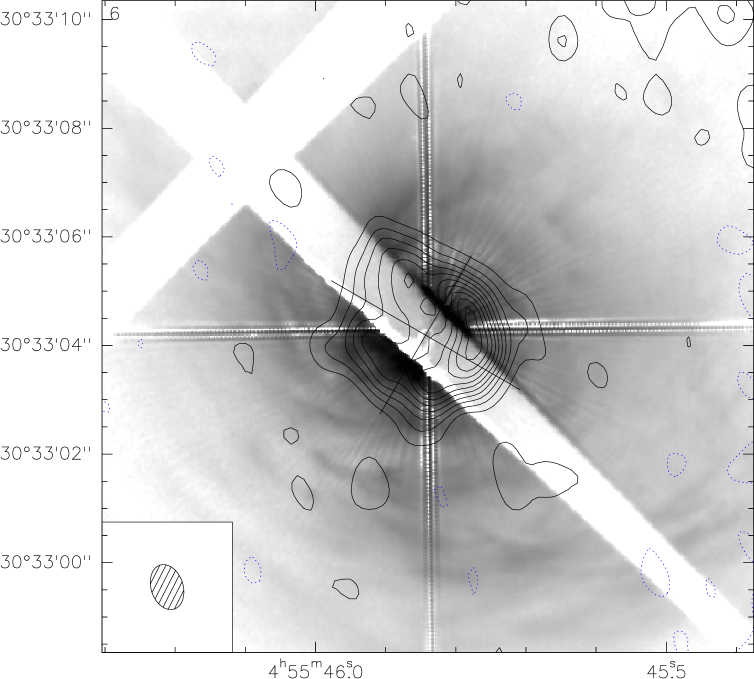
In Figure 3, the continuum emission is super-imposed on the STIS image from Grady et al. (1999). No position adjustment has been made in doing so: the absolute astrometric accuracy of the PdB measurement is better than . The best fit position of the centroid of the emission is 04:55:45.843, 30:33:04.21 only 0.03′′ from the extrapolated Hipparcos position. The HST STIS image (which was centered on the Hipparcos coordinates for 1999) was shifted southward by 0.08′′ to correct for the proper motion of AB Aur (taken from the Hipparcos catalog) between the epochs of the two observations (1999 and 2003). The emission is clearly concentrated in an arc-like structure about 1′′ from the central star. The flux density measured at 1.4 mm in the direction of the central star is mJy, but this should be considered as an upper limit because of contamination from the arc-like structure due to the limited angular resolution.
In Figure 1, the line emission was integrated between 3.8 and 8.2 . This interval contains most of the line profile, but weak emission in the line wings is still detectable 2 away (specially in ). The integrated line emission maps reveal a clear inner hole in the distribution of the emission from the CO isotopes, as well as enhanced emission at the location of the continuum ring. Note in particular that, while the 2.8 mm continuum hardly shows the central depression, the and J=10 line emissions obtained at the same angular resolution clearly show the ring.
3.1 Analysis Method
To better quantify the properties of the AB Aur circumstellar material, we used an approach similar to that applied to DM Tau by Dartois et al. (2003). The analysis is based on a new radiative transfer code, with non-LTE capabilities, which will be presented in a forthcoming paper (Piétu et al., 2005). Apart from discretization details, the LTE part (which was used exclusively here) is however equivalent to the code described in Dutrey et al. (1994). As in Guilloteau & Dutrey (1998), the comparison between models and data and the minimization is done inside the UV plane, using natural weighting. The physical model is that of a rotating, flared disk in hydrostatic equilibrium, with power law distributions for the density, temperature, rotation velocity and scale height as function of radius. Since the AB Aur disk is relatively extended, we have applied primary beam attenuation to the model images before computing the model visibilities. We have also improved the minimization technique by searching the minimum of the with the help of a Levenberg-Marquard method, instead of a simple grid search previously. The two methods were intensively compared, the new one improving the convergence speed by a factor on typical data, and providing more accurate estimate of the error bars since it takes into account the correlation between parameters. Table 1 summarizes the parameters found for the best models for the various lines and the continuum.
3.2 Continuum Emission: a spiral pattern?
The continuum emission from AB Aur is quite peculiar. While most other T Tauri stars and HAeBe stars observed at high angular resolution show a centrally peaked emission, the emission from AB Aur is reminiscent from that of GG Tau, except for the angular scale which is a factor of 2 smaller here. The emission peaks accurately coincide with bright features observed in the STIS image of Grady et al. (1999), but our observations allows to trace the regions which are occulted by coronagraphic mask or by the telescope spider in the HST observations.
No reliable estimate of the inclination of the structure can be obtained from the 1.4 mm image only, because of the highly asymmetric nature of the emission. We have deprojected the emission assuming at position angle , as derived from our analysis of the data, and an inclination of 23∘. These values are also in agreement with the numbers quoted by Fukagawa et al. (2004) from the scattered light in H-band. The result is presented in Fig.4: the asymmetry seen in continuum may follow inwards the spiral-like features detected in scattered light by Fukagawa et al. (2004). By extension, we shall refer to this structure as “the spiral”.
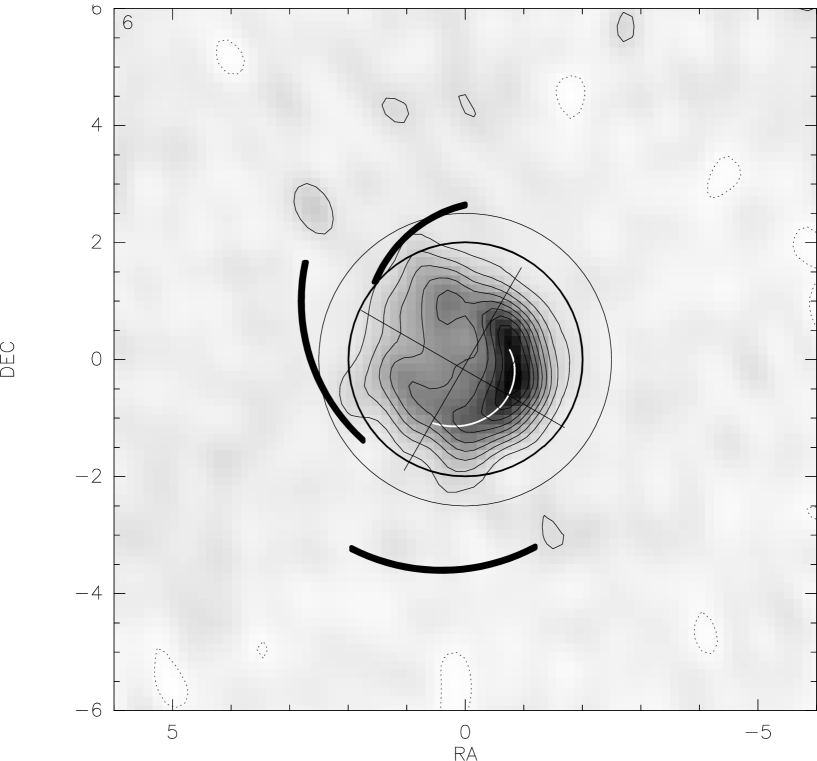
Although the spiral near 160 AU is the most striking feature in the continuum, weak extended emission is also found at larger distances from the star. When interpreted in terms of a truncated disk, the best fit requires a disk with an inner radius of AU, an outer radius AU, and a power law distribution for the surface density of (see Table 1). This outer radius is within of the 280 AU ring detected at 20.5 m by Pantin et al. (2005). Negligible emission arise from beyond 350 AU, as shown by the lower resolution, higher brightness sensitivity images displayed in Fig.5.
A larger inner radius is found at 1.4 mm than in the CO lines (see Table 1). This is presumably due to a combination of the smaller dust opacity with a progressive fall of the surface density inside the ring. When modelled with a sharp edge, this naturally results in the most optically thin tracer, namely the dust emission, having the largest apparent inner radius.
A simultaneous fit of the 2.7 and 1.4 mm continuum data allows to derive the spectral index of the dust emissivity, , assuming the emissivity .
3.3 Line Emission: the Disk
The double peak profiles, combined with the strong velocity gradient along the major axis of the emission which is found in all transitions, suggest that the material around AB Aur is dominated by a circumstellar disk in Keplerian rotation.
We thus attempted to model the emission by a simple Keplerian disk model, in hydrostatic equilibrium, as performed successfully for T Tauri stars like DM Tau (Guilloteau & Dutrey, 1998), GM Aur (Dutrey et al., 1998) and other PMS stars including the Herbig Ae star MWC 480 (Simon et al., 2000). We modelled the circumstellar matter, gas and dust, using the same strategy than those applied in Dartois et al. (2003) for the DM Tau disk. The J=21 transition traces the CO surface of the disk while the J=10 & J=21 lines trace material closer to the mid-plane.
| Assumed Distance | D (pc) = | 140 | |||||||
| Lines | J=21 † | J=21 ‡ | J=10 ‡ | J=10 | |||||
| Systemic velocity | (km.s-1) = | 5.89 | 0.01 | 5.84 | 0.01 | 5.87 | 0.03 | 5.84 | |
| Orientation | PA (∘) = | -27.5 | -31.3 | -30 | -29 | ||||
| Inclination | (∘) = | 33 | 42 | 39 | 36 | ||||
| Inner radius | (AU) = | 45 | 72 | 5 | 77 | 67 | |||
| Outer radius | (AU) = | 1050 | 10 | 890 | 10 | 1300 | 600 | ||
| Turbulent linewidth | (km.s-1) | 0.38 | 0.02 | 0.22 | 0.26 | 0.18 | |||
| Molecular Column density law: | |||||||||
| Column Density | |||||||||
| at 100 AU | (cm-2) = | () | |||||||
| exponent | = | (2.5) | 2.4 | 2.5 | 3 | ||||
| Temperature law: | |||||||||
| Temperature | |||||||||
| at 100 AU | (K) = | 68 | 38 | 2 | 34 | 20 | |||
| exponent | 0.77 | 0.10 | -0.6 | ||||||
| Velocity law: | |||||||||
| Velocity at 100 AU | (km.s-1) = | 3.06 | 2.54 | 2.73 | 2.75 | ||||
| Velocity exponent | = | 0.82 | 0.42 | 0.37 | 0.47 | ||||
| Continuum Results * | ||
|---|---|---|
| Dust: | ||
| Absorption law | (cm2/g) = | (0.1) |
| Dust exponent | = | |
| Surface Density law: | ||
| Surface Density | (H2 cm-2) = | |
| at 100 AU | (g.cm-2) = | |
| exponent | = | |
| Inner radius | (AU) = | |
| Outer radius | (AU) = | |
| Mass | () = | |
‡ ) For the 13CO lines, the error bars are derived from the 1 formal errors from the fit. We checked that all parameters (except of course ) are essentially independent of the inclinations over the range (see Section 3.3).
† ) For 12CO, multiple minima exist. We have selected a solution in which the scale height is determined from the 13CO results: AU, . The error bars, when mentioned, represent the typical (1 ) variations of the parameters obtained when varying all other ones. Numbers in parenthesis represent assumed (fixed) values.
For the C18O, only is actually constrained: . See text for details.
* ) For the continuum data, the temperature was taken as 35 K at 100 AU with an exponent of . The surface densities and mass (and their errors) are given for . An additional 30 % uncertainty should be added for these quantities, because of the error on .
Clearly, AB Aur is surrounded by a very large disk. All 4 spectral lines give a consistent value for the orientation of the disk axis, East from North. The outer radius is of order 1000 AU, except for J=10 which is significantly smaller (600 AU). Note that the J=21 transitions, specially from may underestimate the true radius because of a lack of sufficient short spacings.
Both transitions give a consistent value for the rotation velocity at 100 AU, , and a slightly different value from . When attempting to fit the data with a simple Keplerian disk model, the derived inclinations are different (34, 36 and 43∘), and the derived stellar mass (0.9 – 1.2 ) far from the expected value for an A0 star. From Table 1, it is clear that a simple Keplerian disk model fails to fit properly all observed transitions, even if account is taken of a possible vertical temperature gradient in the disk as has been observed in DM Tau by Dartois et al. (2003). The most significant result is that the velocity law deviates from Keplerian motions. From J=21, the exponent is , instead of for Keplerian motions, and the J=10 gives a consistent result. The law deduced from is much steeper, with an exponent of order 0.8.
It is of course conceivable that the J=21 data be discarded in such an analysis, because of the confusion with the surrounding molecular cloud. Indeed, the fit by emission from a disk leaves significant residual, and cannot represent for example the excess emission in the N-E which is seen in CO at velocities between 4.7 and 6.8 . The large turbulent width found in this analysis is just a result of attempting to fit non-symmetric features with a pure rotating disk. Despite these caveats, an important result from the CO data is the high temperature ( K) required in the inner 100 AU.
The two transitions of the isotopologues yield reasonably consistent results. Some of the differences can be attributed to the importance of the emission coming from the continuum spiral in the J=21 data. This bright emission dominates the total flux, and biases the derived inclination towards higher value, because the spiral curves inwards towards the North-West. If the aspect ratio of the J=21 integrated emission is taken as a measure of the inclination of a simple disk, as did Mannings & Sargent (1997), quite high values are found (). Significantly lower values are obtained when the constraints from the kinematics of a rotating disk is incorporated, but the result on the inclination is still biased because of the emission from the spiral. The J=10 line being observed with lower angular resolution is less sensitive to the spiral feature, and yields an inclination . Given the departure from circular symmetry, lower values (e.g. down to 25∘) cannot be excluded. We note also that it is necessary to introduce an inner radius of about 70 AU to best reproduce the emission (see Table). This inner gap is clearly visible in the integrated intensity maps of Fig.1.
The most clear result from the analysis is that the best fit to the velocity law is obtained with an exponent . This is a very robust result: we checked that the derived exponent is independent of the assumed inclination over a range from up to . This robustness also applies to most other parameters (column density law, inner and outer radii, temperature law, turbulent width). Using a stellar mass for AB Aur, the Keplerian speed at 100 AU is . Accordingly, for the nominal inclination of , the orbital velocities are sub-Keplerian () out to the disk edge. However, if the inclination is lower than , the orbital velocities are super-Keplerian outwards of AU.
J=10 data, although more noisy, also give a inclination. This result is important, since J=10 is the most optically thin of all observed transitions, and thus the less likely to be affected by an extended envelope. The velocity exponent found from (which still remains compatible with the results at ), is essentially Keplerian, but the projected velocity at 100 AU is much smaller than expected from an A0 star, as in the case of other transitions. To reconcile the velocities with the expected stellar mass would require an inclination of . Note also that, because of its optical thinness, this transition mostly samples the inner radii with little contribution from the outer parts of the disk ( AU) and the envelope. Also, an independent constraint on the surface density and the temperature laws is no longer possible; for an optically thin J=1-0 line, the data only constrain the ratio and the value of (Dartois et al., 2003).
For all transitions, we have also checked whether adding a radial velocity component would provide a better fit to the kinematic pattern. For and , the upper limit on a radial velocity is below 0.05 . For , a slightly better fit is found by adding outward motions of order . The significance of this result should not be overestimated, since the excess emission towards the North near (see Fig.2) may bias the result. Note that we can discriminate between inward and outward motions only because we know the full 3-D orientation of the AB Aur disk (the Southern part being towards us, in agreement with Fukagawa et al. (2004)).
4 Discussion
The observations presented above bring new information about the circumstellar environment of AB Aur, which appears to be very different from other proto-planetary disks.
4.1 The “spiral”
First, the sub-arcsecond image of the continuum emission at 1.4 mm extends inwards the spiral structure detected in the near IR by Fukagawa et al. (2004). Considering the sense of rotation, the new portion of the spiral is trailing, as the previous arms. Dust emission at long wavelengths being proportional to , this enhanced brightness could be due to 3 effects: 1) a column density, 2) a change in dust properties, with larger grains in the spiral, or 3) a larger temperature. However, grain growth cannot explain the enhanced molecular emission which is also seen in the spiral. It is not straightforward to disentangle between the two remaining effects from the present data only. Taken at face value, the analysis of lines seem to indicate a flat (or even rising) temperature throughout the disk. However, this result is to be taken with care, since the lines are optically thick only in the inner spiral, whose structure is not adequately fitted by the disk model. A better insight is given by the fact that the J=10 line emission is proportional to (Dartois et al., 2003), rather than for optically thin dust emission. Since the brightness contrast in J=10 is similar to that in the 1.4 mm continuum, it thus suggests the enhanced brightness is a column density effect.
The difference between the apparent inner radius in dust (110 AU) and in CO ( AU from all lines) indicates that the structure of the inner region is much more complex than a simple hole, in sharp contrast with the case of GG Tau (Dutrey et al., 1994; Guilloteau et al., 1999), but its detailed structure is beyond the resolving power of these observations.
4.2 The Inclination Problem and non-Keplerian Velocities
By revealing non circular structures, these observations offer some explanation for the widely different inclinations which were derived in the past from mm tracers and optical images. High inclinations are ruled out by our data. Although an inclination of seems adequate to represent most of the emission, it is certainly biased by the non-circularity of the emission. Given the uncertainties, inclinations as low as 23∘ cannot be excluded.
On the other end, we note that the inclinations derived for the inner disk ( AU) through near-IR interferometry by Eisner et al. (2003) could be biased towards low values by non-circular structure, if the “spiral” pattern persists at such distances from the star.
In any case, the orbital velocities significantly differ from the Keplerian speed. In addition, the turbulence (see Table 1) appears somewhat larger in AB Aur ( if we exclude ) than in other sources like e.g. DM Tau. Unfortunately, the exact value of the inclination plays a major role in the understanding of the environment, because depending on the assumption about projection effects, the orbital velocities of the material surrounding AB Aur can be sub-Keplerian or super-Keplerian throughout most of the disk.
4.3 Kinetic Temperature
In this respect, the AB Auriga disk behaves like those around other T Tauri stars. There is a clear evidence for a kinetic temperature gradient from the disk mid-plane to the disk surface and envelope, with the disk plane being cooler (around 30 K, as traced by and ) than the envelope ( K at 100 AU, as traced by , see Table 1), as expected from heating by the central star. The temperature remains high ( K) throughout the disk, as expected from the much higher luminosity of AB Aur compared to typical T Tauri stars. However, the temperature derived from falls below that derived from lines beyond a radius about 400 – 500 AU. This could be due to self-absorption by the (colder) envelope.
4.4 Molecular Abundances and Disk Mass
The derived outer radius of the dust disk is much smaller ( AU) than that the molecular disk ( AU). At 200 AU, the ratios of the molecular column densities and H2 surface density derived from the dust indicate a molecular abundance [/H2] , similar to that of the Taurus cloud (, Frerking et al. (1982). The value of the dust opacity index (giving cm2/g), is at the high end of the values found in circumstellar disks (and in particular of those observed simultaneously with AB Aur, which share the same flux calibration, see Section 2.1). Dutrey et al. (1996) indicate a mean value of from an ensemble of disks. This suggests that the disk around AB Aur may be younger than average, and that dust grains have not evolved as much as in disks around T Tauri stars. The relatively high temperatures (above 30 K) prevent condensation on dust grains, and probably explain why CO is not significantly depleted, contrary to most other circumstellar disks (e.g. Dutrey et al. (1996)).
The lack of detectable dust emission beyond 350 AU could indicate that the dust opacity drops there. Since the molecular content only changes smoothly with radius, this suggest that the dust absorption coefficient at 1.4 mm is smaller beyond 350 AU than inside, i.e. that the dust is significantly less evolved outside. Another alternative is a steepening of the surface density distribution beyond AU, since the values derived from the dust () is slightly lower than that derived from the CO molecules (). The latter possibility is however not supported by the data, which are only sensitive to the inner regions. It is tempting to relate the change of dust properties near 350 AU to the bright 20 m ring detected by Bouwman & Pantin (2003) at 280 AU.
Both the high value, and the possible dust opacity drop beyond 350 AU suggest that the dust in AB Aur is less evolved than in other T Tauri disks.
5 Origin of the disturbances
The AB Aur environment, although dominated by a rotating disk, is clearly highly disturbed and far from the quasi-equilibrium Keplerian stage encountered around other young stars. We discuss here some mechanisms which could lead to these peculiarities.
5.1 Multiplicity ?
Ring-like structures are easily formed by tidal truncations in binary systems, as illustrated by the case of GG Tau (Dutrey et al., 1994; Guilloteau et al., 1999). AB Aur has never been reported as having a companion. Limits on any companion mass can be derived from the literature. For example, using the brightness profile published by (Fukagawa et al., 2004) in the H band, and the evolution models from Baraffe et al. (1998, 2002), we find a (conservative, especially at large radii) upper limit on any coeval companion of less than in the field of view of the Subaru image. This upper limit on the mass holds for AU. For closer objects, the limits are more difficult to quantify. Pirzkal et al. (1997) give an upper limit of down to 0.4′′ (60 AU). A stronger limit can be derived from Leinert et al. (1994) in the range (10 to 140 AU), as their speckle observations show that the flux of any companion in K band could not exceed 1 to 3 % of the flux of AB Aur, for this range of separations. This gives an upper limit of about 5.2 – 6 to the K magnitude of a possible companion, which translates into a mass limit of 0.05 – 0.3 for ages between 1 and 10 Myr. Unfortunately, a companion of mass on an orbit with semi-major axis could create a gap of half-width a few times the Hill’s radius
| (1) |
where is an empirical factor of order 2 – 3 (Morbidelli, 2002). If viscosity is not negligible, the conditions for gap creation and the resulting gap width are different. Using an prescription for the viscosity, Takeuchi et al. (1996) indicate a gap half width
| (2) |
where is the ratio of strength of tidal effects to viscous effects
| (3) |
Using as derived from our measurements, and , we find , for . Hence, viscosity is unlikely to affect our conclusions. Accordingly, even a companion orbiting AB Aur around 40 AU could conceivably evacuate the inner hole. Whether it could sustain the non Keplerian velocities requires detailed studies. Higher sensitivity optical observations are required to setup more stringent limits on the existence of any companion.
5.2 A gravitationally unstable disk ?
Table 1 shows that the total mass of the system made by the disk and the envelope is not important enough to be self-gravitating. This can be better assessed using Toomre’s criterium:
| (4) |
where is the sound speed, and the angular momentum. With our power laws, is also a power law of the radius with
| (5) | |||||
| (6) |
Using the values from Table 1, we find at 100 AU and , well above the stability limit. To have the disk massive enough for instability would only be possible if the CO depletion was high () and the dust opacity 10 times lower than we assumed. Both possibilities are highly unlikely as discussed in Section 4.4. For example, lowering the dust opacity by a factor 10 would require a value of , assuming the absorption coefficient at Hz remains constant. Furthermore, being negative, the stability increases with distance from the star.
5.3 Possible encounters
Another possible explanation is a past encounter with a star. We have been looking in the SIMBAD database for all stars in a radius of 30 arc-minutes centered around AB Aur. Of a total of 31 stars referenced, 16 of them possess proper motion measurements. 9 come from the survey of Jones & Herbig (1979). 4 come from the Tycho Reference Catalog (Roeser & Bastian, 1988), and 3 Hipparcos measurements were available (4 all together with AB Aur) - (Perryman et al., 1997). A very simple analysis shows that at least 2 of them could have encountered AB Aurigae in the past. JH433 could have encountered AB Aur at any time older than 35 000 years, whereas there could have been an encounter between AB Aur and RW Aur, some 500 000 years ago. We should also mention that according to the early measurement of Jones and Herbig, SU Aur could have met AB Aur is a close past, but that Hipparcos measurements rule out this possibility.
5.4 A young disk ?
Rather than being affected by multiplicity, the situation may suggest instead that AB Aur is surrounded by a young circumstellar disk which has not yet relaxed to the Keplerian stage.
In the formation of a star + disk from the collapse of a rotating interstellar cloud, the low specific angular momentum directly accretes to form the star, but the higher angular momentum accretes through a disk. Cassen & Moosman (1981) have pointed out that, because of the projection of the momentum along the disk axis, the accreting material always have lower angular momentum than the Keplerian value where the accreting material trajectories cross the disk. However, when a complete history of the accretion is incorporated, Stahler et al. (1994) have shown that the disk evolution, which occurs because of the drag force induced by the accreting material, results in a semi-steady state situation in which the outer disk is super Keplerian. Both studies conclude that a massive ring should be formed. Stahler et al. (1994) show that this ring accumulates mass, and acts as a temporary storage for the excess angular momentum brought by the accreting gas.
It is tempting to identify this ring with the enhanced density region which is seen in continuum and line at about 150 AU from the star. If the inclination of the disk is low, , the measured rotation velocities exceed the Keplerian speed at all distances above 100 AU from the star (our measurements are insensitive to the exponent of the rotation velocity within the inner 100 AU). The apparent spiral arms could be the result of instabilities which necessarily occur in such a situation, since the ring is a transient phenomenon. A possible difficulty in this interpretation resides in the timescales over which the ring and supra-Keplerian velocities persist. Accretion on the disk only occurs over the infall timescale, which remains to first order similar to the free-fall time , i.e. a few years at most. The age of AB Aur, is estimated to range between 1 and 4 Myr. 4 Myr is cited by DeWarf et al. (2003), on the basis of a coevality with the nearby star SU Aur, which has similar high proper motions to AB Aur. Lower ages are usually quoted by other authors, AB Aur being among the youngest known HAeBe star. However, AB Aur is already relatively hot, being of spectral type A0 V, so that an extremely young age, a few 105 years, appears to be ruled out from the currently available evolutionary tracks. The main accretion phase on the disk should thus likely be finished.
However, the longest timescale over which the circumstellar disk evolves is the viscous timescale,
| (7) |
in the prescription of the turbulence. We find
| (8) |
Using , and the temperature and velocity from Table 1, we find yr at 100 AU, which is comparable to the estimated age of AB Aur. It is thus conceivable that the AB Aur disk has not relaxed to a purely Keplerian stage and stills exhibit a disturbed kinematic and density pattern. However, it is important to mention that the viscous timescale strongly depends on the assumed viscosity parameter , but little on the stellar properties. As a consequence, the above value is also applicable to T Tauri disks which exhibit clear Keplerian signatures, like those around DM Tau, LkCa 15 or GM Aur. Unless the viscosity is different in both type of objects, this suggests that AB Aur is younger.
6 Summary
We have shown from observations of dust and 4 lines from the CO isotopologues that AB Aur is surrounded by a flattened, non-circularly symmetric disk, in rotation around the star. As expected from the high stellar luminosity, the disk is warm, and CO is not significantly depleted. The determination of the disk inclination is biased by the non-circularity of the brightness distribution, but the rotation has clear non Keplerian characteristics. No completely satisfactory explanation exists for these unusual characteristics. The disk does not appear to be massive enough to be self-gravitating. Upper limits on any companion are not stringent enough to conclude. No evidence for infall motions could be detected. It is tempting to see AB Aur as an example of a very young object in which traces of the accretion from a rotating envelope onto the disk surface have not yet been erased by the dynamical and viscous evolution of the disk. An independent indication of youth comes from the dust properties, since the index may indicate that dust grains have not evolved in the AB Aur disk as much as in other proto-planetary disks.
Acknowledgements.
We acknowledge all the Plateau de Bure IRAM staff for performing the observations. We thank J.M.Huré and H.Beust for fruitful discussions on the physics of disks. The HST image was kindly provided by C.Grady. This research has made use of the SIMBAD database, operated at CDS, Strasbourg, France. We acknowledge financial support from the “Programme National de Physique Chimie du Milieu Interstellaire” PCMI coordinated by INSU/CNRS.References
- Baraffe et al. (1998) Baraffe, I., Chabrier, G., Allard, F., & Hauschildt, P. H. 1998, A&A, 337, 403
- Baraffe et al. (2002) Baraffe, I., Chabrier, G., Allard, F., & Hauschildt, P. H. 2002, A&A, 382, 563
- Bouwman et al. (2000) Bouwman, J., de Koter, A., van den Ancker, M. E., & Waters, L. B. F. M. 2000, A&A, 360, 213
- Bouwman & Pantin (2003) Bouwman, J. & Pantin, E. 2003, in Astrophysics of Dust
- Cassen & Moosman (1981) Cassen, P. & Moosman, A. 1981, Icarus, 48, 353
- Chen & Jura (2003) Chen, C. H. & Jura, M. 2003, ApJ, 591, 267
- Dartois et al. (2003) Dartois, E., Dutrey, A., & Guilloteau, S. 2003, A&A, 399, 773
- DeWarf et al. (2003) DeWarf, L. E., Sepinsky, J. F., Guinan, E. F., Ribas, I., & Nadalin, I. 2003, ApJ, 590, 357
- Dutrey et al. (1996) Dutrey, A., Guilloteau, S., Duvert, G., et al. 1996, A&A, 309, 493
- Dutrey et al. (1998) Dutrey, A., Guilloteau, S., Prato, L., et al. 1998, A&A, 338, L63
- Dutrey et al. (1994) Dutrey, A., Guilloteau, S., & Simon, M. 1994, A&A, 286, 149
- Eisner et al. (2003) Eisner, J. A., Lane, B. F., Akeson, R. L., Hillenbrand, L. A., & Sargent, A. I. 2003, ApJ, 588, 360
- Frerking et al. (1982) Frerking, M. A., Langer, W. D., & Wilson, R. W. 1982, ApJ, 262, 590
- Fukagawa et al. (2004) Fukagawa, M., Hayashi, M., Tamura, M., et al. 2004, ApJ, 605, L53
- Grady et al. (1999) Grady, C. A., Woodgate, B., Bruhweiler, F. C., et al. 1999, ApJ, 523, L151
- Guilloteau & Dutrey (1998) Guilloteau, S. & Dutrey, A. 1998, A&A, 339, 467
- Guilloteau et al. (1999) Guilloteau, S., Dutrey, A., & Simon, M. 1999, A&A, 348, 570
- Hernández et al. (2004) Hernández, J., Calvet, N., Briceño, C., Hartmann, L., & Berlind, P. 2004, AJ, 127, 1682
- Jones & Herbig (1979) Jones, B. F. & Herbig, G. H. 1979, AJ, 84, 1872
- Leinert et al. (1994) Leinert, C., Richichi, A., Weitzel, N., & Haas, M. 1994, in Astronomical Society of the Pacific Conference Series, 155–+
- Mannings et al. (1997) Mannings, V., Koerner, D. W., & Sargent, A. I. 1997, Nature, 388, 555
- Mannings & Sargent (1997) Mannings, V. & Sargent, A. I. 1997, ApJ, 490, 792
- Meeus et al. (2001) Meeus, G., Waters, L. B. F. M., Bouwman, J., et al. 2001, A&A, 365, 476
- Monnier & Millan-Gabet (2002) Monnier, J. D. & Millan-Gabet, R. 2002, ApJ, 579, 694
- Morbidelli (2002) Morbidelli, A. 2002, Modern celestial mechanics : aspects of solar system dynamics (London: Taylor and Francis, 2002, ISBN 0415279399)
- Pantin et al. (2005) Pantin, E., Bouwman, J., & Lagage, P. 2005, A&A, in press
- Perryman et al. (1997) Perryman, M. A. C., Lindegren, L., Kovalevsky, J., et al. 1997, A&A, 323, L49
- Piétu et al. (2005) Piétu, V., Dutrey, A., & Guilloteau, S. 2005, in preparation
- Piétu et al. (2003) Piétu, V., Dutrey, A., & Kahane, C. 2003, A&A, 398, 565
- Pirzkal et al. (1997) Pirzkal, N., Spillar, E. J., & Dyck, H. M. 1997, ApJ, 481, 392
- Roeser & Bastian (1988) Roeser, S. & Bastian, U. 1988, A&AS, 74, 449
- Simon et al. (2000) Simon, M., Dutrey, A., & Guilloteau, S. 2000, ApJ, 545, 1034
- Stahler et al. (1994) Stahler, S. W., Korycansky, D. G., Brothers, M. J., & Touma, J. 1994, ApJ, 431, 341
- Takeuchi et al. (1996) Takeuchi, T., Miyama, S. M., & Lin, D. N. C. 1996, ApJ, 460, 832
- van den Ancker et al. (1998) van den Ancker, M. E., de Winter, D., & Tjin A Djie, H. R. E. 1998, A&A, 330, 145