Virtual Observatory: From Concept to Implementation
Abstract
We review the origins of the Virtual Observatory (VO) concept, and the current status of the efforts in this field. VO is the response of the astronomical community to the challenges posed by the modern massive and complex data sets. It is a framework in which information technology is harnessed to organize, maintain, and explore the rich information content of the exponentially growing data sets, and to enable a qualitatively new science to be done with them. VO will become a complete, open, distributed, web-based framework for astronomy of the early 21st century. A number of significant efforts worldwide are now striving to convert this vision into reality. The technological and methodological challenges posed by the information-rich astronomy are also common to many other fields. We see a fundamental change in the way all science is done, driven by the information technology revolution.
1 Division of Physics, Mathematics, and Astronomy
2 Center for Advanced Computing Research
California Institute of Technology
Pasadena, CA 91125, USA
1. The Challenge and the Opportunity
Like all other sciences, and indeed most fields of the modern human endeavor (commerce, industry, security, entertainment, etc.), astronomy is being deluged by an exponential growth in the volume and complexity of data. The volume of information gathered in astronomy is estimated to be doubling every 1.5 years or so (Szalay & Gray 2000), i.e., with the same exponent as the Moore’s law. This is not an accident: the same technology which Moore’s law describes (roughly, VLSI) has also given us most astronomical detectors (e.g., CCDs) and data systems. The current ( early 2005) data gathering rate in astronomy is estimated to be TB/day, and the content of astronomical archives is now several hundred TB (Brunner et al. 2002). Note that both the data volume and the data rate are growing exponentially. Multi-PB data sets are on the horizon.
In addition to the growth in data volume, there has been also a great increase in data complexity, and generally also quality and homogeneity. The sky is now being surveyed at a full range of wavelengths, from radio to -rays, with individual surveys producing data sets measured in tens of TB, detecting many millions or even billions of sources, and measuring tens or hundreds of parameters for each source. There is also a bewildering range of targeted observations, many of which carve out multi-dimensional slices of the parameter space.
Yet, our understanding of the universe is clearly not doubling every year and a half. It seems that we are not yet exploiting the full information content of these remarkable (and expensive) data sets. There is something of a technological and methodological bottleneck in our path from bits to knowledge.
A lot of valuable data from ground-based observations is not yet archived or documented properly. A lot of data is hard to find and access in practice, even if it is available in principle. A multitude of good archives, data depositories, and digital libraries do exist, and form an indispensable part of the astronomical research environment today. However, even those functional archives are like an archipelago of isolated islands in the web, which can be accessed individually one at a time, and from which usually only modest amounts of data can be downloaded to the user’s machine where the analysis is done.
Even if one could download the existing multi-TB data sets in their full glory (a process which would take a long, long time even for the well-connected users), there are no data exploration and analysis tools readily available, which would enable actual science with these data to be done in a reasonable and practical amount of time.
We are thus facing an embarrassment of richness: a situation where we cannot effectively use the tremendous – and ever growing – amounts of valuable data already in hand. Fortunately, this is a problem where technological solutions do exist or can be developed on a reasonably short time scale.
2. The Genesis of the Virtual Observatory Concept
The Virtual Observatory (VO) concept is the astronomical community’s response to these challenges and opportunities. VO is an emerging, open, web-based, distributed research environment for astronomy with massive and complex data sets. It assembles data archives and services, as well as data exploration and analysis tools. It is technology-enabled, but science-driven, providing excellent opportunities for collaboration between astronomers and computer science (CS) and IT professionals and statisticians. It is also an example of a new type of a scientific organization, which is inherently distributed, inherently multidisciplinary, with an unusually broad spectrum of contributors and users.
The concept was defined in the 1990’s through many discussions and workshops, e.g., during the IAU Symposium 179, and at a special session at the 192nd meeting of the AAS (Djorgovski & Beichman 1998). Precursor ideas include, e.g., efforts on the NASA’s early ADS system, and its ESA counterpart, ESIS, as well as the development of many significant data and literature archives in the same period: ADS itself, Simbad and other services at CDS, NED, data archives from the HST and other space missions, Digital Sky project (by T. Prince et al.), etc. As many modern digital sky surveys (e.g., DPOSS, SDSS, 2MASS, etc.) started producing terabytes of data, the challenges and opportunities of information-rich astronomy became apparent (see, e.g., Djorgovski et al. 1997, Szalay & Brunner 1998, Williams et al. 1999, or Szalay et al. 2000). Two grassroots workshops focused on the idea of VO were held in 1999, at JHU (organized by A. Szalay, R. Hanisch, et al.), and at NOAO (organized by D. De Young, S. Strom, et al.).
The early developments culminated in a significant endorsement of the NVO concept by the U.S. National Academy’s “astronomy decadal survey” (McKee, Taylor, et al. 2000). This was then explored further in a White Paper (2001), and in other contributions to the first major conference on the subject (Brunner, Djorgovski, & Szalay 2001), from which emerged the architectural concept of services, service descriptions, and a VO-provided registry. The report of the U.S. National Virtual Observatory Science Definition Team (2002) provided the most comprehensive scientific description of the concept and the background up to that point.
More international conferences followed (e.g., Banday et al. 2001, Quinn & Gorski 2004), and a good picture of this emerging field can be found in papers contained in their proceedings. VO projects have been initiated world-wide, with a good and growing international collaboration between various efforts; more information and links can be found on their websites. 111 The U.S. National Virtual Observatory (NVO) project website: http://us-vo.org 222 The International Virtual Observatory Alliance (IVOA) website: http://ivoa.net
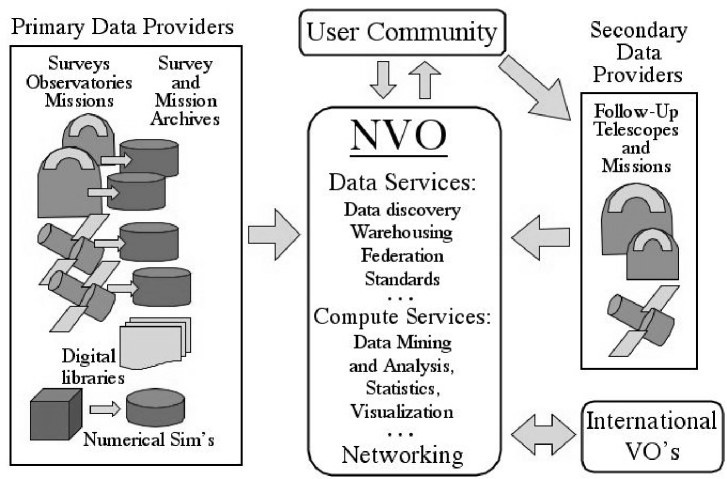
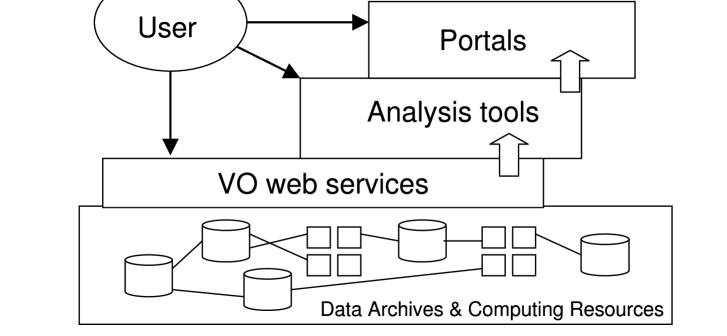
Finally, VO can be seen as a connecting tissue of the entire astronomical system of observatories, archives, and compute services (Fig. 2; Djorgovski 2002). Effectiveness of any observation is amplified, and the scientific potential increased, as the new data are folded in the system and made available for additional studies, follow-up observations, etc.
3. Scientific Roles and Benefits of a VO
The primary role of a VO is to facilitate data discovery (what is already known of some object, set of objects, a region on the sky, etc.), data access (in an easy and standardized fashion), and data federation (e.g., combining data from different surveys). The next, and perhaps even more important role, is to provide an effective set of data exploration and analysis tools, which scale well to data volumes in a multi-TB regime, and can deal with the enormous complexity present in the data. (By “data” we mean both the products of observations, and products of numerical simulations.)
While any individual function envisioned for the VO can be accomplished using existing tools, e.g., federating a couple of massive data sets, exploring them in a search for particular type of objects, or outliers, or correlations, in most cases such studies would be too time-consuming and impractical; and many scientists would have to solve the same issues repeatedly. VO would thus serve as an enabler of science with massive and complex data sets, and as an efficiency amplifier. The goal is to enable some qualitatively new and different science, and not just the same as before, but with a larger quantity of data. We will need to learn to ask different kinds of questions, which we could not hope to answer with the much smaller and information-poor data sets in the past.
Looking back at the history of astronomy we can see that technological revolutions lead to bursts of scientific growth and discovery. For example, in the 1960’s, we saw the rise of radio astronomy, powered by the developments in electronics (which were much accelerated by the radar technology of the World War II and the cold war). This has led to the discovery of quasars and other powerful active galactic nuclei, pulsars, the cosmic microwave background (which firmly established the Big Bang cosmology), etc. At the same time, the access to space opened the fields of X-ray and -ray astronomy, with an equally impressive range of fundamental new discoveries: the very existence of the cosmic X-ray sources and the cosmic X-ray background, -ray bursts (GRBs), and other energetic phenomena. Then, over the past 15 years or so, we saw a great progress powered by the advent of solid-state detectors (CCDs, IR arrays, bolometers, etc.), and cheap and ubiquitous computing, with discoveries of extrasolar planets, brown dwarfs, young and forming galaxies at high redshifts, the cosmic acceleration (the dark energy), the solution of the mystery of GRBs, and so on. We are now witnessing the next phase of the IT revolution, which will likely lead to another golden age of discovery in astronomy. VO is the framework to effect this process.
In astronomy, observational discoveries are usually made either by opening a new domain of the parameter space (e.g., radio astronomy, X-ray astronomy, etc.), by pushing further along some axis of the observable parameter space (e.g., deeper in flux, higher in angular or temporal resolution, etc.), by expanding the coverage of the parameter space and thus finding rare types of objects or phenomena which would be missed in sparse observations, or by making connections between different types of observations (for example, optical identification of radio sources leading to the discovery of quasars). Surveys are often a venue which leads to such discoveries; see, e.g., Harwit (1998) for a discussion. In a more steady mode of research, application of well understood physics, constrained by observations, leads to understanding of various astronomical objects and phenomena; e.g., stellar structure and evolution.
This implies two kinds of discovery strategies: covering a large volume of the parameter space, with many sources, measurements, etc., as is done very well by massive sky surveys; and connecting as many different types of observations as possible (e.g., in a multi-wavelength, multi-epoch, or multi-scale manner), so that the potential for discovery increases as the number of connections, i.e., as the number of the federated data sets, squared. Both approaches are naturally suited for the VO.
4. Technological and Methodological Challenges
There are many non-trivial technological and methodological problems posed by the challenges of data abundance. We note two important trends, which seem to particularly distinguish the new, information-rich science from the past:
-
•
Most data will never be seen by humans. This is a novel experience for scientists, but the sheer volume of TB-scale data sets (or larger) makes it impractical to do even a most cursory examination of all data. This implies a need for reliable data storage, networking, and database-related technologies, standars, and protocols.
-
•
Most data and data constructs, and patterns present in them, cannot be comprehended by humans directly. This is a direct consequence of a growth in complexity of information, mainly its multidimensionality. This requires the use or development of novel data mining (DM) or knowledge discovery in databases (KDD) and data understanding (DU) technologies, hyperdimensional visialization, etc. The use of AI/machine-assisted discovery may become a standard scientific practice.
This is where the qualitative differences in the way science is done in the 21st century will come from; the changes are not just quantitative, based on the data volumes alone. Thus, a modern scientific discovery process can be outlined as follows:
-
1.
Data gathering: raw data streams produced by various measuring devices. Instrumental effects are removed and calibrations applied in the domain-specific manner, usually through some data reduction pipeline (DRP).
-
2.
Data farming: storage and archiving of the raw and processed data, metadata, and derived data products, including issues of optimal database architectures, indexing, searchability, interoperability, data fusion, etc. While much remains to be done, these challenges seem to be fairly well understood, and much progress is being made.
-
3.
Data mining: including clustering analysis, automated classification, outlier or anomaly searches, pattern recognition, multivariate correlation searches, and scientific visualization, all of them usually in some high-dimensional parameter space of measured attributes or imagery. This is where the key technical challenges are now.
-
4.
Data understanding: converting the analysis results into the actual knowledge. The problems here are essentially methodological in nature. We need to learn how to ask new types of questions, enabled by the increases in the data volume, complexity, and quality, and the advances provided by IT. This is where the scientific creativity comes in.
For example, a typical VO experiment may involve federation of several major digital sky surveys (in the catalog domain), over some large area of the sky. Each survey may contain sources, and measure attributes for each source (various fluxes, size and shape parameters, flags, etc.). Each input catalog would have its own limits and systematics. The resulting data set would be somewhat heterogeneous parameter space of data vectors in dimensions. An exploration of such a data set may require a clustering analysis (e.g., how many different types of objects are there? which object belongs to which class, with what probability?), a search for outliers (are there rare or unusual objects which do not belong to any of the major classes?), a search for multivariate correlations (which may connect only some subsets of measured parameters), etc. For some examples and discussion, see, e.g., Djorgovski et al. (2001ab, 2002).
The primary challenge is posed by the large size of data volume, and – especially – large dimensionality. The existing clustering analysis algorithms do not scale well with the data volume , or dimensionality . At best, the processing time is proportional to , but for some methods it can be , where . The curse of hyperdimensionality is even worse, with typical scaling as , where ; most off-the-shelf applications can deal with . Thus, the computational cost itself may be prohibitive, and novel approaches and algorithms must be developed.
In addition, there are many possible complications: data heterogeneity, different flux limits, errors which depend on other quantities, etc. In the parameter space itself, clustering may not be well represented by multivariate Gaussian clouds (a standard approach), and distributions can have power-law or exponential tails (this greatly complicates the search for anomalies and rare events); and so on. As we search for outliers in these new rich surveys, the requirement to eliminate noise and artifacts grows. These are much more significant in an outlier search than when computing clustering properties and averages,
The difficulties of data federation are exacerbated if data is in different formats and delivery mechanisms, increasing both manual labor and the possibility of mistakes. Data with inadequate metadata description can be misleading – for example mistaking different equinoxes for proper motion because the equinox was not stated. Another difficulty can be that delivery of the data is optimized for either browsing or for bulk access: it is difficult if the user wants one, but the other is the only option. The Virtual Observatory has already provided many well-adopted standards that were built for data fedteration. The VOTable standard, for example (Ochsenbein, Williams, et al. 2001) carries rich metadata about tables, groups of tables, and the data dictionaries.
The second, and perhaps even more critical part of the curse of hyperdimensionality is the visualization of these highly-dimensional data parameter spaces. Humans are biologically limited to visualize patterns and scenes in 2 or 3 dimensions, and while some clever tricks have been developed to increase the maximum visualizable dimensions, in practice it is hard to push much beyond = 4 or 5. Mathematically, we understand the meaning of clustering and correlations in an arbitrary number of parameter space dimensions, but how can we actually visualize such structures? Yet, recognizing and comprehending such complex data constructs may lead to some crucial new astrophysical insights. This is an essential part of the intuitive process of scientific discovery, and critical to data understanding and knowledge extraction. Effective and powerful data visualization, applied in the parameter space itself, must be an essential part of the interactive clustering analysis.
In many situations, scientifically informed input is needed in designing and applying the clustering algorithms. This should be based on a close, working collaboration between astronomers and computer scientists and statisticians. There are too many unspoken assumptions, historical background knowledge specific to astronomy, and opaque jargon; constant communication and interchange of ideas are essential.
5. The Virtual Observatory Implemented
The objective of the Virtual Observatory is to improve and unify access to astronomical data and services for primarily professional astronomers, but also for the general public and students. Figure 3 gives an overview. The top bar of the figure represents this objective: discovery of data and services, reframing and analysing that data through computation, publishing and dissemination of results, and increasing scientific output through collaboration and federation. The IVOA does not specify or recommend any specific portal or library by which users can access VO data, but some examples of these portals and tools are shown in the grey box.
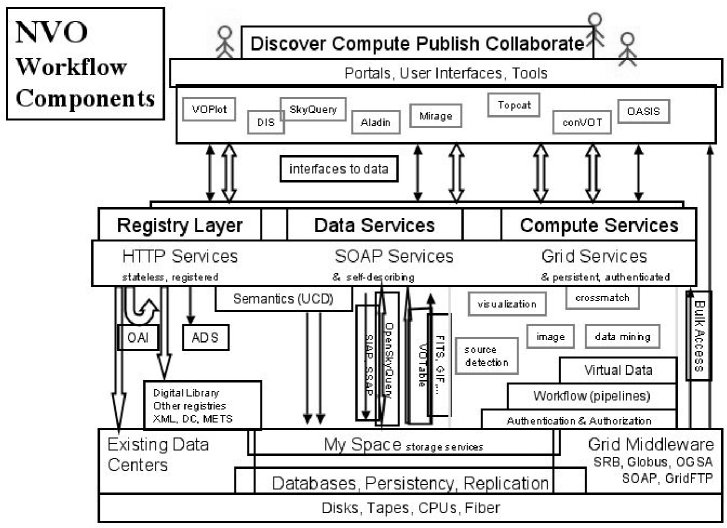
Different vertical arrows represent the different service types and XML formats by which these portals interface to the IVOA-compliant services. In the IVOA architecture, we have divided the available services into three broad classes:
-
1.
Data Services, for relatively simple services that provide access to data.
-
2.
Compute Services, where the emphasis is on computation and federation of data.
-
3.
Registry Services, to allow services and other entities to be published and discovered.
These services are implemented at various levels of sophistication, from a stateless, text-based request-response, up to an authenticated, self-describing service that uses high-performance computing to build a structured response from a structured request. In the VO, it is intended that services can be used not just individually, but also concatenated in a distributed workflow, where the output of one is the input of another.
The registry services facilitate publication and discovery of services. If a data center (or individual) puts a new dataset online, with a service to provide access to it, the next step would be to publish that fact to a VO-compliant registry. One way to do this is to fill in forms expressing who, where, and how for the service. In due course, registries harvest each other (copy new records) and so the new dataset service will be known to other VO-registries. When another person searches a registry (by keyword, author, sky region, wavelength, etc), they will discover the published services. In this way the VO advances information diffusion to a more efficient and egalitarian system.
In the VO architecture, there is nobody deciding what is good data and what is bad data, (although individual registries may impose such criteria if they wish). Instead, we expect that good data will rise to prominence organically, as it does on the World Wide Web. We note that while the web has no publishing restrictions, it is still an enormously useful resource; and we hope the same paradigm will make the VO registries useful.
Each registry has three kinds of interface: publish, query, and harvest. People can publish to a registry by filling in web forms in a web portal, thereby defining services, data collections, projects, organizations, and other entities. The registry may also accept queries in a one or more languages (for example an IVOA standard Query Language), and thereby discover entities that satisfy the specified criteria. The third interface, harvesting, allows registries to exchange information between themselves, so that a query executed at one registry may discover a resource that was published at another.
Registry services expect to label each VO resource through a universal identifier, that can be recognized by the initial string ivo://. Resources can contain links to related resources, as well as external links to the literature, especially to the Astronomical Data System. The IVOA registry architecture is compliant with digital library standards for metadata harvesting and metadata schema, with the intention that IVOA-compliant resources can appear as part of every University library.
Data services range from simple to sophisticated, and return tabular, image, or other data. At the simplest level (conesearch), the request is a cone on the sky (direction/angular radius), and the response is a list of “objects” each of which has a position that is within the cone. Similar services (SIAP, SSAP) can return images and spectra associated with sky regions, and these services may also be able to query on other parameters of the objects.
The OpenSkyQuery protocol drives a data service that allows querying of a relational database or a federation of databases. In this case, the request is written in a specific XML abstraction of SQL that is part of ADQL (Astronomical Data Query Language).
The IVOA architecture will also support queries written at a more semantic level, including queries to the registry and through data services. To achieve this, the IVOA is developing a structured vocabulary called UCD (Unified Content Descriptor) to define the semantic type of a quantity.
The IVOA expects to develop standards for more sophisticated services, for example for federating and mining catalogs, image processing and source detection, spectral analysis, and visualization of complex datasets. These services will be implemented in terms of industry-standard mechanisms, working in collaboration with the grid community.
Members of the IVOA are collaborating with a number of IT groups that are developing workflow software, meaning a linked set of distributed services with a dataflow paradigm. The objective is to reuse component services to build complex applications, where the services are insulated from each other through well-defined protocols, and therefore easier to maintain and debug. IVOA members also expect to use such workflows in the context of Virtual Data, meaning a data product that is dynamically generated only when it is needed, and yet a cache of precomputed data can be used when relevant.
In the diagram above, the lowest layer is the actual hardware, but above that are the existing data centers, who implement and/or deploy IVOA standard services. Grid middleware is used for high-performance computing, data transfer, authentication, and service environments. Other software components include relational databases, services to replicate frequently used collections, and data grids to manage distributed collections.
A vital part of the IVOA architecture is VOSpace so that users can store data within the VO. VOSpace stores files and DB tables on the greater internet, and has a good security model so that legitimate data is secure and illegitimate data disallowed. VOSpace avoids the need to recover results to the desktop for storage or to keep them inside the service that generated them. Using VOSpace establishes access rights and privacy over intermediate results and allows users to manage their storage remotely.
6. Examples of Some Prototype Services
There are several deployed applications available at the NVO web site 333 NVO Applications: http://us-vo.org/apps . A registry portal allows the user to find source catalogs, image and spectral services, data sets and other astronomical resources registered with the NVO. OpenSkyQuery provides sophisticated selection and cross-match services from uploaded (user) data with numerous catalogues. There are spectrum services for search, plot, and retrieving SDSS, 2dF, and other archives. The WESIX service asks the user to upload an image to a source-extraction code, then cross-correlates the objects found with selected survey catalogs. There is also information about publishing to the NVO and what that means.
As noted above, these are all implemented with Web Services. This means that users can effectively scale up their usage of NVO services: when the user finds the utility of a remote service that can be used by clicking on a human-oriented web page, there is often a further requirement to scale up by scripting the usage – a machine-oriented interface. We have ensured in the VO architecture that there is always a straightforward programming interface behind web page.
In the following, we examine in more detail the DataScope service.
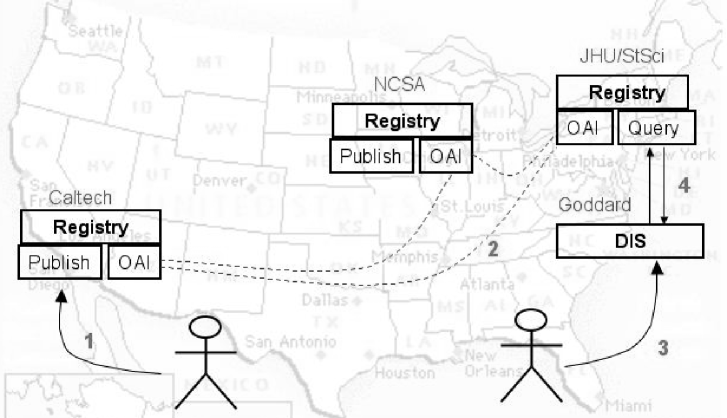
Using NVO DataScope scientists can discover and explore hundreds of data resources available in the Virtual Observatory. Users can immediately discover what is known about a given region of the sky: they can view survey images from the radio through the X-ray, explore observations from multiple archives, find recent articles describing analysis of data in the region, find known interesting or peculiar objects and survey datasets that cover the region. There is a summary of all of the available data. Users can download images and tables for further analysis on their local machines, or they can go directly to a growing set of VO enabled analysis tools, including Aladin, OASIS, VOPlot and VOStat.
As illustrated in Figure 4, DataScope provides a dynamic, simple to use explorer for VO data, protocols and analysis tools. Developed by Tom McGlynn at NASA/GSFC and collaborators at STScI and NCSA, the DataScope uses the distributed VO registry and VO access protocols to link to archives and catalogs around the world.
There are web sites that provide rapid collection and federation of multi-wavelength imaging, catalog and observation data. This sort of interface has been built before (NED, Astrobrowse, Skyview, VirtualSky, etc). In these excellent and competent systems, data may be harvested and processed in advance, and there may be a lot of effort by devoted human curators. There may be links to remote resources – but no guarantee that anything will actually be found “under the link”.
However, the DataScope is different from these web sites for two major reasons. First, the “Publish and Discover” paradigm means that DataScope is always up-to-date. When the sky position is given by the user, DataScope probes a collection of services to get relevant data, and that collection is fetched dynamically by querying the NVO Resource Registry. Therefore, when a new data service is created and published to the Registry, that service is immediately visible to the scientific community as part of Datascope.
Second, the DataScope uses standards. The NVO has defined standard service types for querying catalog and image servers. This replaces the old system, where each service implementor would choose an idiosyncratic interface, meaning that the maker of a federation service would need to learn and program each data service individually.
7. Taking a Broader View: Information-Intensive Science for the 21st Century
The modern scientific methodology originated in the 17th century, and a healthy interplay of analytical and experimental work has been driving the scientific progress ever since. But then, in mid-20th century, something new came along: computing as a new way of doing science, primarily through numerical simulations of phenomena too complex to be analytically tractable. Simulations are thus more than just a substitute for analytical theory: there are many phenomena in the physical universe where simulations (incorporating, of course, the right physics and equations of motion) are the only way in which some phenomena can be described and predicted. Recall that even the simplest Newtonian mechanics can solve exactly only a 2-body problem; for , numerical solutions are necessary. Other examples in astronomy include star and galaxy formation, dynamics and evolution of galaxies and large-scale structure, stellar explosions, anything involving turbulence, etc. Simulations relate, can stimulate, or be explained by both analytical theory and experiments or observations. While numerical simulations and other computational means of solving complex systems of equations continue to thrive, there is now a new and growing role of scientific computing, which is data-driven.
Data- or information-driven computing, which spans all of the aspects of a modern scientific work described above, and more, is now becoming the dominant form of scientific computing, and an essential component of gathering, storing, preserving, accessing, and, most of all, analyzing massive amounts of complex data, and extracting knowledge from them. It is fundamentally changing the way in which science is done in the 21st century.
Computationally driven and enabled science also plays an important societal role: it is empowering an unprecedented pool of talent. With distributed scientific frameworks like VO, which provide open access to data and tools for their exploration, anyone, anywhere, with a decent internet connection can do a first rate science, learn about what others area doing, and communicate their results. This should be a major boon for countries without expensive scientific facilities, and individuals at small or isolated institutions. The human talent is distributed geographically much more broadly than money or other resources.
8. Concluding Comments
The VO concept is rapidly spreading in astronomical community worldwide. Ultimately, it should become “invisible”, and taken for granted: it would be operating framework for astronomical research, a semantic web of astronomy.
There is an already effective, world-wide collaboration between various national and trans-national VO efforts in place. The fundamental cyber-infrastructure of interoperable data archives, standard formats, protocols, etc., and a number of useful prototype services are well under way. The next stage of technological challenges is in the broad area of data exploration and understanding (DM/KDD/DU). We are confident that continuing productive collaborations among astronomers, statisticians, and CS/IT scientists and professionals will bring forth a powerful new toolbox for astronomy with massive and complex data sets.
Just as technology derives from a progress in science, progress in science, especially experimental/observational, is driven by the progress in technology. This positive feedback loop will continue, as the IT revolution unfolds. Practical CS/IT solutions cannot be developed in a vacuum; having real-life testbeds, and functionality driven by specific application demands is essential. Recall that the WWW originated as a scientific application. Today, grid technology is being developed by physicists, astronomers, and other scientists. The needs of information-driven science are broadly applicable to information-intensive economy in general, as well as other domains (entertainment, media, security, education, etc.). Who knows what world-changing technology, perhaps even on par with the WWW itself, would emerge from the synergy of computationally enabled science, and science-driven information technology?
Acknowledgments. We thank the numerous friends and collaborators who developed the ideas behind the Virtual Observatory, and made it a reality; they include Charles Alcock, Robert Brunner, Dave De Young, Francoise Genova, Jim Gray, Bob Hanisch, George Helou, Wil O’Mullane, Ray Plante, Tom Prince, Arnold Rots, Alex Szalay, and many, many others, too numerous to list here, for which we apologize. We also acknowledge a partial support from the NSF grants AST-0122449, AST-0326524, AST-0407448, and DMS-0101360, NASA contract NAG5-9482, and the Ajax Foundation.
References
- Banday, et al. (2001) Banday, A., et al. (editors), 2001, Mining the Sky, ESO Astrophysics Symposia, Berlin: Springer Verlag
- Brunner et al. (2002) Brunner, R., Djorgovski, S.G., Prince, T., & Szalay, A. 2002, in: Handbook of Massive Data Sets, eds. J. Abello et al., Dordrecht: Kluwer Academic Publ., p. 931
- Brunner et al. (2001) Brunner, R., Djorgovski, S.G., & Szalay, A. (editors), 2001, Virtual Observatories of the Future, ASPCS, 225, San Francisco: Astronomical Society of the Pacific
- Djorgovski et al. (1997) Djorgovski, S.G., et al. 1997, in: Applications of Digital Image Processing XX, ed. A. Tescher, Proc. SPIE, 3164, 98-109 (astro-ph/9708218)
- Djorgovski & Beichman (1998) Djorgovski, S.G., & Beichman, C. 1998, BAAS, 30, 912
- Djorgovski et al. (2001a) Djorgovski, S.G., et al. 2001a, in: Astronomical Data Analysis, eds. J.-L. Starck & F. Murtagh, Proc. SPIE 4477, 43 (astro-ph/0108346)
- Djorgovski et al. (2001b) Djorgovski, S.G., et al. 2001b, in: Mining the Sky, eds. A.J. Banday et al., ESO Astrophysics Symposia, Berlin: Springer Verlag, p. 305 (astro-ph/0012489)
- Djorgovski et al. (2002) Djorgovski, S.G., et al. 2002, in: Statistical Challenges in Astronomy III, eds. E. Feigelson & J. Babu, New York: Springer Verlag, p. 125 (astro-ph/020824)
- Djorgovski (2002) Djorgovski, S.G. 2002, in: Small Telescopes in the New Millenium. I. Perceptions, Productivity, and Priorities, ed. T. Oswalt, Dordrecht: Kluwer, p. 85 (astro-ph/0208170)
- Harwit (1998) Harwit, M. 1998, in: Proc. IAU Symp. 179, New Horizons from Multi-Wavelength Surveys, eds. B. McLean et al., Dordrecht: Kluwer, p. 3
- McKee et al. (2000) McKee, C., Taylor, J., et al. 2000, Astronomy and Astrophysics in the New Millennium, National Academy of Science, Astronomy and Astrophysics Survey Committee, Washington D.C.: National Academy Press, available at http://www.nap.edu/books/0309070317/html/
- NVO SDT Report (2002) NVO Science Definition Team report, available at http://nvosdt.org
- NVO White Paper (2001) NVO White Paper “Toward a National Virtual Observatory: Science Goals, Technical Challenges, and Implementation Plan”, 2001, in: Virtual Observatories of the Future, ASPCS, 225, San Francisco: Astronomical Society of the Pacific, p. 353, available at http://www.arXiv.org/abs/astro-ph/0108115
- Ochsenbein, F., Williams, R.D., et al., (2001) Ochsenbein, F., Williams, R.D., et al. 2001), VOTable Format Definition, International Virtual Observatory Alliance, available at http://www.ivoa.net/Documents/latest/VOT.html
- Quinn & Gorski (2004) Quinn, P., & Gorski, K. (editors), Toward an International Virtual Observatory, ESO Astrophysics Symposia, Berlin: Springer Verlag
- Szalay & Brunner (1998) Szalay, A. & Brunner, R. 1998, in: Proc. IAU Symp. 179, New Horizons from Multi-Wavelength Surveys, eds. B. McLean et al., Dordrecht: Kluwer, p. 455
- Szalay et al. (2000) Szalay, A., et al. 2000, Proc. ACM SIGMOD Intl. Conf. on Management of Data, ACM SIGMOD Record, 29, 451, also Microsoft Technical Report MS-TR-99-30, available at http://research.microsoft.com/Gray/
- Szalay & Gray (2001) Szalay, A., & Gray, J. 2001, Science, 293, 2037
- Williams et al. (1999) Williams, R.D., Bunn, J., Moore, R. & Pool, J.C.T. 1999, Interfaces to Scientific Data Archives, Report of the EU-US Workshop, Future Generation Computer Systems, 16 (1): VII-VIII
- Williams (2003) Williams, R.D. 2003, Grids and the Virtual Observatory, in: Grid Computing: Making The Global Infrastructure a Reality, eds. F. Berman, A. Hey, & G. Fox, New York: Wiley, p.837