On the relation between circular velocity and central velocity dispersion in high and low surface brightness galaxies††thanks: Based on observations made with European Southern Observatory Telescopes at the Paranal Observatory under programmes 67.B-0283, 69.B-0573 and 70.B-0171.
Abstract
In order to investigate the correlation between the circular velocity and the central velocity dispersion of the spheroidal component , we analyzed these quantities for a sample of 40 high surface brightness disc galaxies (hereafter HSB), 8 giant low surface brightness spiral galaxies (hereafter LSB), and 24 elliptical galaxies characterized by flat rotation curves. Galaxies have been selected to have a velocity gradient for . We used these data to better define the previous – correlation for spiral galaxies (which turned out to be HSB) and elliptical galaxies, especially at the lower end of the values. We find that the – relation is described by a linear law out to velocity dispersions as low as , while in previous works a power law was adopted for galaxies with .
Elliptical galaxies with based on dynamical models or directly derived from the H I rotation curves follow the same relation as the HSB galaxies in the – plane. On the contrary, the LSB galaxies follow a different relation, since most of them show either higher (or lower ) with respect to the HSB galaxies. This argues against the relevance of baryon collapse in the radial density profile of the dark matter haloes of LSB galaxies. Moreover, if the – relation is equivalent to one between the mass of the dark matter halo and that of the supermassive black hole, these results suggest that the LSB galaxies host a supermassive black hole with a smaller mass compared to HSB galaxies of equal dark matter halo. On the other hand, if the fundamental correlation of SMBH mass is with the halo circular velocity, then LSBs should have larger black hole masses for given bulge dispersion.
Elliptical galaxies with derived from H I data and LSB galaxies were not considered in previous studies.
1 Introduction
A possible relation between the central velocity dispersion of the spheroidal component () and the galaxy circular velocity measured in the flat region of the rotation curve () was suggested by Whitmore et al. (1979) and Whitmore & Kirshner (1981). By measuring H I line widths they found that for a sample of S0 and spiral galaxies. Recently, Ferrarese (2002) proceeded further extending the – relation to elliptical galaxies. She interpreted the – relation as suggestive of a correlation between two different galactic components, since and probe the potential of the spheroidal component and of the dark matter (hereafter DM) halo, respectively. In particular, it results that for a given DM halo the central velocity dispersion of the spheroidal component is independent of the morphological type. The validity of this relation has been confirmed by Baes et al. (2003), who enlarged the sample of spiral galaxies.
For elliptical galaxies, is generally inferred by means of dynamical modelling of the stellar kinematics. This is the case of the giant round and almost non-rotating ellipticals studied by Kronawitter et al. (2000). These galaxies form a unique dynamical family which scales with luminosity and effective radius. As a consequence the maximum circular velocity is correlated to the central velocity dispersion of the galaxy. (Gerhard et al., 2001). Whether the same is true for more flattened and fainter ellipticals is still to be investigated. On the contrary, both shape and amplitude of the rotation curve of a spiral galaxy depend on the galaxy luminosity and morphological type (e.g., Burstein & Rubin, 1985; Persic et al., 1996). For this reason for spiral galaxies the – relation is not expected a priori.
It is interesting to investigate whether the – relation holds also for less dense objects characterized by a less steep potential well. This is the case of low surface brightness galaxies (hereafter LSB), which are disc galaxies with a central face-on surface brightness mag arcsec-2 (e.g., Schombert et al., 1992; Impey et al., 1996). Previous work concentrated on HSB and, to infer the for elliptical galaxies, they relied on stellar dynamical models. In this work we investigated the behavior of elliptical galaxies with HI-based and of LSB galaxies in the – relation.
2 Sample selection
In the past years we started a scientific program aimed at deriving the detailed kinematics of ionized gas and stars in HSB and LSB galaxies in order to study their mass distribution and structural properties. We measured the velocity curves and velocity dispersion profiles along the major axis for both the ionized-gas and stellar components for a preliminary sample of HSB galaxies [ S0–S0/a galaxies in Corsini et al. (2003); Sa galaxies in Bertola et al. (1996) and Corsini et al. (1999); S0–Sc galaxies in Vega Beltrán et al. (2001); Sb–Scd galaxies in Pizzella et al. (2004b)] and 11 LSB galaxies (Pizzella et al., 2005, 2004a)
The HSB sample consists of disc galaxies with Hubble type ranging from S0 to Scd, an inclination and a distance Mpc. The LSB sample consists of disc galaxies with Hubble type ranging from Sa to Irr, an intermediate inclination (), and a distance Mpc (except for ESO 534-G20). Three LSB galaxies, namely ESO 206-G14, ESO 488-G49, and LSBC F563-V02, have been selected from the sample observed by de Blok & McGaugh (1997). The remaining eight objects are LSB galaxies with bulge. They have been selected in Lauberts & Valentijn (1989, hereafter ESO-LV) to have a LSB disc component following the criteria described by Beijersbergen et al. (1999). Due to the bulge light contribution the total central face-on surface brightness of the galaxy could be mag arcsec-2. However, all these objects do have a LSB disc. As far as their total luminosity concerns, LSBC F563-V02 and ESO 488-G49 are two dwarf LSB galaxies but the other nine objects are representative of giant LSB galaxies (e.g., McGaugh et al., 2001).
For all the HSB and LSB galaxies we obtained the ionized-gas rotation curve by folding the observed line-of-sight velocities around the galaxy center and systemic velocity after averaging the contiguous data points and applying a correction for galaxy inclination. We rejected HSB galaxies because they had asymmetric rotation curves or rotation curves which were not characterized by an outer flat portion. Ferrarese (2002) and Baes et al. (2003) considered galaxies with the rotation curve extending farther out than . This criterion is not appropriate when the sample galaxies spans a wide range in photometrical properties. For LSB galaxies, which have a lower central surface brightness than HSB galaxies, corresponds to a relatively small radius where the rotation curve may be still rising. For this reason we adopt a criterion that select rotation curves on the basis of their flatness rather then on their extension.
The flatness of each rotation curve has been checked by fitting it with a linear low for . The radial range has been chosen in order to avoid the bulge-dominated region of the rotation curve (e.g., IC 724 and NGC 2815). The rotation curves with within 3 have been considered not to be flat. In this way HSB galaxies and LSB galaxies resulted to have a flat rotation curve. Since the velocity curves of the LSB galaxies were not presented in previous papers, we show their folded rotation curves in Fig. 1. We derived by averaging the outermost values of the flat portion of the rotation curve.
We are therefore confident that we are giving a reliable estimate of the asymptotic value of the circular velocity which traces the mass of the DM halo (see Ferrarese, 2002, for a discussion). We derived from the stellar kinematics by extrapolating the velocity dispersion radial profile to . This has been done by fitting the innermost data points with an empirical function (either an exponential, or a Gaussian or a constant). We did not apply any aperture correction to as discussed by Baes et al. (2003), and Pizzella et al. (2004b).
In order to complete our sample of disc galaxies we included all the spiral galaxies previously studied by Ferrarese (2002) and Baes et al. (2003), but which are in addition characterized by a flat rotation curve. We therefore applied to this latter galaxy sample the same flatness criterion applied to our sample .
In summary, we have galaxies ( HSB and LSB galaxies) from our preliminary sample, spiral galaxies (out of 38) from Ferrarese (2002), and spiral galaxies (out of 12) from Baes et al. (2003). It should be noted that the final sample of HSB galaxies includes early-type objects with Hubble type ranging from S0 to Sab. On the contrary, the sample by Baes et al. (2003) and Ferrarese (2002) was constituted only by late-type spirals with Hubble type Sb or later (except for the Sa NGC 2844).
Finally, we considered a sample of 24 elliptical galaxies with a flat rotation curve and for which both and are available from the literature. They include 19 objects studied by Kronawitter et al. (2000) who derived by dynamical modeling and 5 objects for which is directly derived from the flat portion of their H I rotation curves. The addition of these last 5 ellipticals is important as it allows to test against model-dependent biases in the relation.
The of NGC 4278 has been estimated from both the H I rotation curve (Lees, 1994, at a distance from the center of 3.3 ) and dynamical models (Kronawitter et al., 2000, at a distance from the center of 0.1 ). The values are in agreement within 2 error bars. For the further analysis we adopted the H I which has been obtained at a larger distance from the center.
The values of all the elliptical galaxies have been corrected to the equivalent of an aperture of radius following the prescriptions of Jorgensen et al. (1995). The effective radius is taken from de Vaucouleurs et al. (1991, hereafter RC3).
The basic properties of the complete sample of HSB disc galaxies, LSB spiral galaxies and elliptical galaxies are listed in Table 1 as well as their values of and .
3 Results and discussion
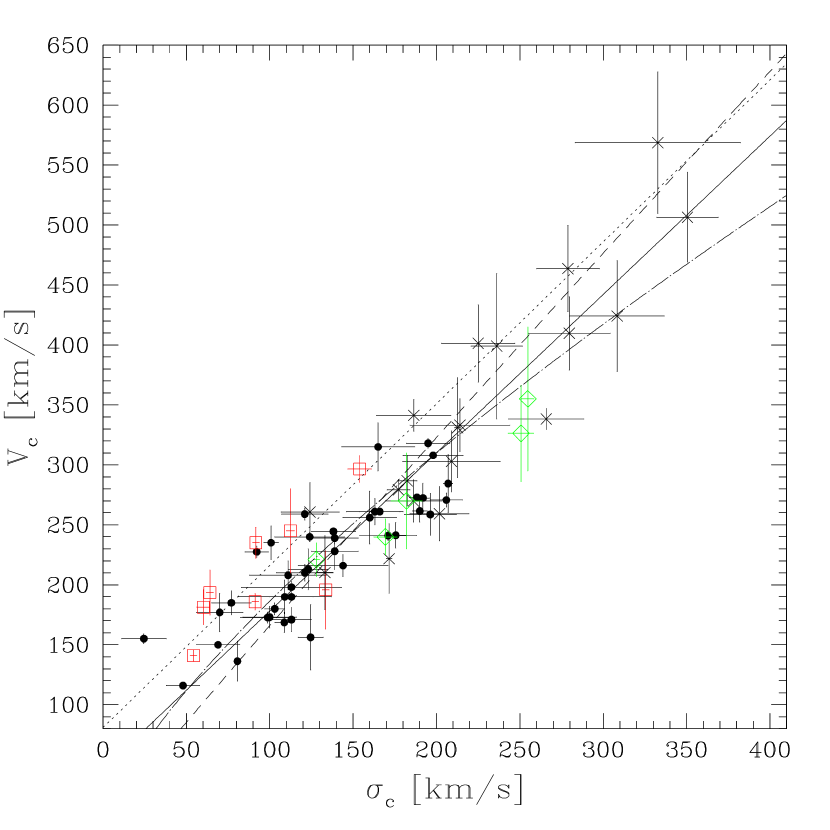
The and data points of the final sample of galaxies are plotted in Fig. 2. We applied a linear regression analysis to the data by adopting the method by Akritas & Bershady (1996) for bivariate correlated errors and intrinsic scatter (hereafter BCES) both in the – and – plane. We did not include LSB galaxies in the analysis because they appear to follow a different – relation as we will discuss later.
Following Ferrarese (2002) and Baes et al. (2003) we fit the function to the data in – plane. We find
| (1) |
with and expressed in . The resulting power law is plotted in Fig. 2. To perform a comparison with previous results we defined the reduced as in Press et al. (1992)
| (2) |
where and are the errors of the th data point, and are the observed and fitted velocity of the th data point, is the linear coefficient of the regression, and is the number of data points. We find .
The fitting power law has in agreement with Ferrarese (2002) and Baes et al. (2003). The power-law fit by Baes et al. (2003) is plotted in Fig. 2 for a comparison. However, Ferrarese (2002) and Baes et al. (2003) included in their fits only galaxies with and , respectively. In fact, they considered the few objects with as outliers. On the contrary, we found that points characterized by appear to be well represented by the fitting law as well as the ones characterized by higher values of .
Since it results , we decided to fit the function to the data in the – plane. We find
| (3) |
with and expressed in . The resulting straight line is plotted in Fig. 2. We find by defining the reduced as
| (4) |
where and are the errors of the th data point, and are the observed and fitted velocity for th data point, is the linear coefficient of the regression, and is the number of data points. .
To summarize, in previous works a power law was adopted to describe the correlation between and for galaxies with . We find that data are also consistent with a linear law out to velocity dispersions as low as . We considered the straight line given in Eq. 3 as reference fit.
Our reduced is significantly higher than those found by Ferrarese (2002, for a sample of 13 spiral galaxies with and 20 elliptical galaxies) and Baes et al. (2003, for a sample of 24 spiral galaxies with ). However, this comparison is affected by the different uncertainties which characterize the and measurements of the three datasets. In order to allow such a comparison we performed the analysis of the scatter of the data points. We defined the scatter as
| (5) |
with
| (6) |
and
| (7) |
where and are the distance between the th data point and the straight line of coefficients and given in Eq. 3 and its weight, respectively. If we consider only the HSB galaxies, the resulting scatter is , and for Ferrarese (2002), Baes et al. (2003) and our sample, respectively. The difference in the scatter of the datasets (e.g. [(this work)(Ferrarese)]) is therefore significantly smaller than the difference of the corresponding (e.g. (this work)(Ferrarese)). This means that the higher value of our is mostly due to the smaller error bars than to the larger intrinsic scatter of our HSB+E data points. It should be noticed that Ferrarese (2002) and Baes et al. (2003) considered only galaxies with a flat rotation curve extending at a distance larger than the optical radius . We relaxed this selection criterion to build our final sample and made sure instead that all rotation curves reached the flat outer parts. The residual plot of Fig. 4 shows that the scatter of the data points corresponding to our sample galaxies with measured at is comparable to that of the galaxies with measured . This confirms that this particular scale is not important once the asymptotic part of the rotation curve is reached by the observations. However, Fig. 4 indicates that the residuals are particularly large near and that the scatter becomes smaller at . In the latter case the flat portion of the rotation curve extends on a larger radial range and therefore is measured with a higher precision. In fact, for the scatter increases symmetrically with either and values and it indicates that the less extended velocity curves are not introducing any systematic effect. Indeed, the slope of the – relation that we find is consistent with the one proposed by Ferrarese (2002) and Baes et al. (2003) from a sample of more extended velocity curves.
The measured scatter of the complete sample is , which is larger than typical measurement errors for and (). For this reason, the measured scatter is dominated by the intrinsic scatter that we estimate to be .
We investigated the location of the elliptical galaxies with based on H I data and of LSB galaxies in the – plane. These types of galaxies were not considered by Ferrarese (2002) and Baes et al. (2003).
The data points corresponding to the 5 elliptical galaxies with based on H I data follow the same relation as the remaining disc and elliptical galaxies. For these H I rotation curves we relaxed the flatness criterion in favor of their large radial extension which is about 10 times larger than that of optical rotation curves. The inclusion of these data points does not change the fit based on the remaining disc and elliptical galaxies. They are mostly located on the upper end of the – relation derived for disc galaxies, in agreement with the findings of Bertola et al. (1993). They studied these elliptical galaxies and showed that their DM content and distribution are similar to those of spiral galaxies.
The LSB and HSB galaxies do not follow the same – relation. In fact, most of the LSB galaxies are characterized by a higher for a given (or a lower for a given ) with respect to HSB galaxies (Fig. 2). By applying to the LSB data points the same regression analysis which has been adopted for the HSB and elliptical galaxies of the final sample, we find
| (8) |
with and expressed in . The straight line corresponding to this fit, which is different from the one obtained for HSB and elliptical galaxies and happens to be parallel to it, is plotted in Fig. 2.
To address the significance of this result, which is based only on 8 data points, we compared the distribution of the normalized scatter of the LSB galaxies to that of the HSB and elliptical galaxies. We defined normalized scatter of the th data point as
| (9) |
where is the distance to the straight line of coefficient and given in Eq. 3 of the th data point, whose associated error is
| (10) |
We assumed when the data point lies above the straight line corresponding to the best fit. In Fig. 3 we plot the distributions of the normalized scatter of the LSB galaxies and of the HSB and elliptical galaxies. The two distributions appear to be different, as it is confirmed at a high confidence level () by a Kolmogorov-Smirnov test. The fact that these objects fall in a different region of the – plane confirms that LSB and HSB galaxies constitute two different classes of galaxies.
Both demographics of supermassive black holes (SMBH) and study of DM distribution in galactic nuclei benefit from the – relation. The recent finding that the mass of SMBHs correlates with different properties of the host spheroid supports the idea that formation and accretion of SMBHs are closely linked to the formation and evolution of their host galaxy. Such a mutual influence substantiates the notion of coevolution of galaxies and SMBHs (see Ho, 2004).
A task to be pursued is to obtain a firm description of all these relationships spanning a wide range of SMBH masses and address if they hold for all Hubble types. In fact, the current demography of SMBHs suffers of important biases, related to the limited sampling over the different basic properties of their host galaxies. The finding that the – relation holds for small values of points to the idea that SMBHs with masses smaller than about M⊙ may also exist and follow the M∙- relation.
Moreover, it has been suggested that the – relation is equivalent to one between the masses of SMBH and DM halo (Ferrarese & Merritt, 2000; Baes et al., 2003) because and are related to the masses of the central SMBH and DM halo, respectively. Yet, this claim is to be considered with caution, as the demography of SMBHs is still limited, in particular as far as spiral galaxies are concerned. Furthermore, the calculation of the virial mass of the DM halo from the measured depends on the assumptions made for the DM density profile and the resulting rotation curve (e.g., see the prescriptions by Bullock et al., 2001; Seljak, 2002). A better estimate of the virial velocity of the DM halo can be obtained by constraining the baryonic-to-dark matter fraction with detailed dynamical modeling of the sample galaxies. The resulting relation is expected to have a smaller scatter than the – relation. If the M∙- relation is to hold, the deviation of LSB galaxies with bulge from the – of HSB and elliptical galaxies suggests that for a given DM halo mass the LSB galaxies would host a SMBH with a smaller mass compared to HSB galaxies. On the other hand, if the fundamental correlation of SMBH mass is with the halo circular velocity, then LSBs should have larger black-hole masses for given bulge dispersion. The theoretical and numerical investigations of the processes leading to the formation of LSB galaxies this should be accounted for
The collapse of baryonic matter can induce a further concentration in the DM distribution (Rix et al., 1997), and a deepening of the overall gravitational well in the central regions. If this is the case, the finding that at a given DM mass (as traced by ) the central of LSB galaxies is smaller than in their HSB counterparts, would argue against the relevance of baryon collapse in the radial density profile of DM in LSB galaxies. Confirming that LSB galaxies follow a different – relation will highlight yet another aspect of their different formation history. Indeed, LSB galaxies appear to have a central potential well less steep than HSB spirals of the same DM halo mass. If the collapse of baryonic matter causes a compression of the DM halo as well, for LSB galaxies such process may have been less relevant than for HSB galaxies. Again LSB galaxies turn out to be the best tracers of the primordial density profile of DM haloes and therefore in pursuing the nature of dark matter itself.
References
- (1)
- Akritas & Bershady (1996) Akritas, M. G., & Bershady, M. A. 1996, ApJ, 470, 706
- Baes et al. (2003) Baes, M., Buyle, P., Hau, G. K. T., & Dejonghe, H. 2003, MNRAS, 341, L44
- Barth et al. (2002) Barth, A. J., Ho, L. C., & Sargent, W. L. W. 2002, AJ, 124, 2607
- Beijersbergen et al. (1999) Beijersbergen, M., de Blok, W. J. G., & van der Hulst, J. M. 1999, A&A, 351, 903
- Bertola et al. (1996) Bertola, F., Cinzano, P., Corsini, E. M., Pizzella, A., Persic, M., & Salucci, P. 1996, ApJ, 458, L67
- Bertola et al. (1993) Bertola, F., Pizzella, A., Persic, M., & Salucci, P. 1993, ApJ, 416, L45
- Beuing et al. (2002) Beuing, J., Bender, R., Mendes de Oliveira, C., Thomas, D., & Maraston, C. 2002, A&A, 395, 431
- Bullock et al. (2001) Bullock, J. S., Kolatt, T. S., Sigad, Y., Somerville, R. S., Kravtsov, A. V., Klypin, A. A., Primack, J. R., & Dekel, A. 2001, MNRAS, 321, 559
- Burstein & Rubin (1985) Burstein, D., & Rubin, V. C. 1985, ApJ, 297, 423
- Carollo et al. (1993) Carollo, C. M., Danziger, I. J., & Buson, L. 1993, MNRAS, 265, 553
- Corsini et al. (2003) Corsini, E. M., Pizzella, A., Coccato, L., & Bertola, F. 2003, A&A, 408, 873
- Corsini et al. (1999) Corsini, E. M., Pizzella, A., Sarzi, M., Cinzano, P., Vega Beltrán, J. C., Funes, J. G., Bertola, F., Persic, M., & Salucci, P. 1999, A&A, 342, 671
- Davies et al. (1987) Davies, R. L., Burstein, D., Dressler, A., Faber, S. M., Lynden-Bell, D., Terlevich, R. J., & Wegner, G. 1987, ApJS, 64, 581
- de Blok & McGaugh (1997) de Blok, W. J. G., & McGaugh, S. S. 1997, MNRAS, 290, 533
- Ferrarese (2002) Ferrarese, L. 2002, ApJ, 578, 90
- Ferrarese & Merritt (2000) Ferrarese, L., & Merritt, D. 2000, ApJ, 539, L9
- Franx et al. (1994) Franx, M., van Gorkom, J. H., & de Zeeuw, T. 1994, ApJ, 436, 642
- Gerhard et al. (2001) Gerhard, O., Kronawitter, A., Saglia, R. P., & Bender, R. 2001, AJ, 121, 1936
- Guthrie (1992) Guthrie, B. N. G. 1992, A&AS, 93, 255
- Ho (2004) Ho, L. C., ed. 2004, Coevolution of Black Holes and Galaxies
- Impey et al. (1996) Impey, C. D., Sprayberry, D., Irwin, M. J., & Bothun, G. D. 1996, ApJS, 105, 209
- Jorgensen et al. (1995) Jorgensen, I., Franx, M., & Kjaergaard, P. 1995, MNRAS, 276, 1341
- Kim et al. (1988) Kim, D.-W., Jura, M., Guhathakurta, P., Knapp, G. R., & van Gorkom, J. H. 1988, ApJ, 330, 684
- Kronawitter et al. (2000) Kronawitter, A., Saglia, R. P., Gerhard, O., & Bender, R. 2000, A&AS, 144, 53
- Lees (1994) Lees, J. F. 1994, in Mass-Transfer Induced Activity in Galaxies, proceedings of the Conference held at the University of Kentucky, Lexington, April 26-30, 1993. Edited by Isaac Shlosman. Cambridge: Cambridge University Press, 1994, 432
- McGaugh et al. (2001) McGaugh, S. S., Rubin, V. C., & de Blok, W. J. G. 2001, AJ, 122, 2381
- Morganti et al. (1997) Morganti, R., Sadler, E. M., Oosterloo, T., Pizzella, A., & Bertola, F. 1997, AJ, 113, 937
- Palunas & Williams (2000) Palunas, P., & Williams, T. B. 2000, AJ, 120, 2884
- Persic et al. (1996) Persic, M., Salucci, P., & Stel, F. 1996, MNRAS, 281, 27
- Pizzella et al. (2005) Pizzella, A., Corsini, E., Magorrian, J., Sarzi, M., & Bertola, F. 2005, in preparation
- Pizzella et al. (2004a) Pizzella, A., Corsini, E. M., Bertola, F., Coccato, L., Magorrian, J., Sarzi, M., & Funes, J. G. 2004a, in IAU Symposium, 337–338
- Pizzella et al. (2004b) Pizzella, A., Corsini, E. M., Vega Beltrán, J. C., & Bertola, F. 2004b, A&A, 424, 447
- Press et al. (1992) Press, W. H., Teukolsky, S. A., Vetterling, W. T., & Flannery, B. P. 1992, Numerical recipes in FORTRAN. The art of scientific computing (Cambridge: University Press, —c1992, 2nd ed.)
- Rix et al. (1997) Rix, H., de Zeeuw, P. T., Cretton, N., van der Marel, R. P., & Carollo, C. M. 1997, ApJ, 488, 702
- Rubin et al. (1985) Rubin, V. C., Burstein, D., Ford, W. K., & Thonnard, N. 1985, ApJ, 289, 81
- Sandage & Tammann (1981) Sandage, A., & Tammann, G. A. 1981, in Carnegie Inst. of Washington, Publ. 635; Vol. 0; Page 0, 0
- Schiminovich et al. (1995) Schiminovich, D., van Gorkom, J. H., van der Hulst, J. M., & Malin, D. F. 1995, ApJ, 444, L77
- Schombert et al. (1992) Schombert, J. M., Bothun, G. D., Schneider, S. E., & McGaugh, S. S. 1992, AJ, 103, 1107
- Seljak (2002) Seljak, U. 2002, MNRAS, 334, 797
- Vega Beltrán et al. (2001) Vega Beltrán, J. C., Pizzella, A., Corsini, E. M., Funes, J. G., Zeilinger, W. W., Beckman, J. E., & Bertola, F. 2001, A&A, 374, 394
- Whitmore & Kirshner (1981) Whitmore, B. C., & Kirshner, R. P. 1981, ApJ, 250, 43
- Whitmore et al. (1979) Whitmore, B. C., Schechter, P. L., & Kirshner, R. P. 1979, ApJ, 234, 68


| Name | Morp. Type | Ref. | ||||||
|---|---|---|---|---|---|---|---|---|
| [∘] | [Mpc] | [mag] | [km s-1] | [km s-1] | [] | |||
| (1) | (2) | (3) | (4) | (5) | (6) | (7) | (8) | (9) |
| HSB galaxies | ||||||||
| ESO 323-G25 | (R′)SBbc(s): | 55 | 59.8 | 139 14 | 228 15 | 1.2 | 1 | |
| ESO 382-G58 | SBbc(r): sp | 79 | 106.2 | 165 22 | 315 20 | 1.1 | 1 | |
| ESO 383-G02 | SABc(rs) | 60 | 85.4 | 109 28 | 190 14 | 1.0 | 1 | |
| ESO 383-G88 | SABbc(r)? | 67 | 59.5 | 70 14 | 177 16 | 1.0 | 1 | |
| ESO 445-G15 | Sbc | 66 | 60.3 | 113 13 | 190 21 | 1.1 | 1 | |
| ESO 446-G01 | SAbc(s): | 53 | 98.3 | 123 12 | 213 17 | 1.0 | 1 | |
| ESO 501-G68 | Sbc | 70 | 45.8 | 100 16 | 173.0 9.0 | 1.1 | 1 | |
| IC 342 | SABcd(rs) | 12 | 2.0 | 77 12 | 185 10 | 1.4 | 2 | |
| IC 724 | Sa | 55 | 78.0 | 207.0 2.8 | 284 24 | 0.8 | 3 | |
| NGC 753 | SABbc(rs) | 39 | 90.0 | 121 17 | 210.0 7.0 | 0.6 | 2 | |
| NGC 801 | Sc | 79 | 79.2 | 144 27 | 216.0 9.0 | 1.6 | 2 | |
| NGC 1160 | Scd: | 62 | 36.6 | 25 13 | 155.1 4.0 | 0.8 | 4 | |
| NGC 1357 | SAab(s) | 47 | 26.2 | 121 14 | 259.0 5.0 | 0.8 | 2 | |
| NGC 1620 | SABbc(rs) | 71 | 46.1 | 92.2 6.9 | 227.5 4.7 | 1.1 | 5 | |
| NGC 2179 | SA0/a(s) | 47 | 35.6 | 175.6 6.5 | 241 11 | 1.0 | 3 | |
| NGC 2590 | SAbc(s): | 72 | 63.4 | 196 16 | 259 18 | 1.0 | 5 | |
| NGC 2639 | (R)SAa(r)? | 53 | 66.5 | 195 13 | 318.0 4.0 | 0.7 | 2 | |
| NGC 2815 | SBb(r): | 72 | 40.0 | 205.9 9.8 | 270.7 5.8 | 0.9 | 5 | |
| NGC 2844 | SAa(r): | 61 | 26.4 | 113 12 | 171 10 | 1.0 | 2 | |
| NGC 2998 | SABc(rs) | 63 | 67.4 | 113 30 | 198.0 5.0 | 1.7 | 2 | |
| NGC 3054 | SABb(r) | 52 | 28.5 | 138 13 | 244.5 3.3 | 0.9 | 5 | |
| NGC 3038 | SAb(rs) | 58 | 41.4 | 160 16 | 256 22 | 1.3 | 1 | |
| NGC 3145 | SBbc(rs) | 60 | 61.0 | 166 12 | 261.0 3.0 | 0.8 | 2 | |
| NGC 3198 | SBc(rs) | 68 | 9.4 | 69 13 | 150.0 3.0 | 5.2 | 2 | |
| NGC 3200 | SABc(rs): | 73 | 43.4 | 191.9 3.9 | 272 12 | 0.9 | 5 | |
| NGC 3223 | SAb(s) | 53 | 46.5 | 163 17 | 261 11 | 0.8 | 2 | |
| NGC 3333 | SABbc pec sp | 82 | 59.4 | 111 23 | 208 12 | 1.0 | 1 | |
| NGC 3885 | SA0/a(s) | 67 | 22.3 | 124.5 7.5 | 156 27 | 0.6 | 6 | |
| NGC 4378 | (R)SAa(s) | 21 | 43.1 | 198 18 | 308.0 1.0 | 0.5 | 2 | |
| NGC 4419 | SBa(s) sp | 71 | 17.0 | 99 16 | 172.7 4.5 | 0.4 | 4 | |
| NGC 4845 | SAab(s) sp | 76 | 13.1 | 80.6 2.1 | 136 17 | 0.5 | 3 | |
| NGC 5055 | SAbc(rs) | 55 | 8.0 | 103.0 6.0 | 180.0 5.0 | 2.4 | 2 | |
| NGC 5064 | (R′)SAab: | 63 | 36.0 | 188.3 4.6 | 272.9 2.8 | 0.9 | 4 | |
| NGC 6503 | SAcd(s) | 71 | 5.9 | 48 10 | 116.0 2.0 | 1.9 | 2 | |
| NGC 6925 | SAbc(s) | 75 | 37.7 | 190.0 4.5 | 261.5 9.1 | 1.0 | 5 | |
| NGC 7083 | SAbc(s) | 53 | 39.7 | 100.8 4.4 | 235 14 | 0.9 | 5 | |
| NGC 7217 | (R)SAab(r) | 34 | 21.9 | 171 17 | 241.0 4.0 | 0.7 | 2 | |
| NGC 7331 | SAb(s) | 70 | 14.9 | 139 14 | 239.0 5.0 | 1.6 | 2 | |
| NGC 7531 | SABbc(r) | 67 | 20.9 | 108.7 5.6 | 168.6 8.4 | 0.7 | 5 | |
| NGC 7606 | SAb(s) | 67 | 42.1 | 124 21 | 240.0 4.0 | 0.9 | 2 | |
| Name | Morp. Type | Ref. | ||||||
| [∘] | [Mpc] | [mag] | [km s-1] | [km s-1] | [] | |||
| (1) | (2) | (3) | (4) | (5) | (6) | (7) | (8) | (9) |
| LSB galaxies | ||||||||
| ESO 186-G55 | Sab(r)? | 63 | 60.1 | 91.7 2.0 | 235 11 | 1.0 | 7 | |
| ESO 189-G07 | SABbc(rs) | 49 | 37.5 | 91.3 2.0 | 185.9 6.9 | 1.0 | 7 | |
| ESO 206-G14 | SABc(s) | 39 | 60.5 | 54.3 2.0 | 141.0 4.5 | 1.4 | 7 | |
| ESO 234-G13 | Sbc | 69 | 60.9 | 64.1 2.0 | 194 19 | 1.2 | 7 | |
| ESO 446-G17 | (R)SBb(s) | 54 | 58.9 | 133.6 2.0 | 196 33 | 1.2 | 7 | |
| ESO 450-G20 | SBbc(s): | 30 | 31.6 | 112.4 2.4 | 245 35 | 1.0 | 7 | |
| ESO 514-G10 | SABc(s): | 36 | 40.4 | 60.2 4.0 | 181 15 | 0.8 | 7 | |
| ESO 534-G20 | Sa: | 46 | 226.7 | 153.9 7.1 | 297 11 | 1.4 | 7 | |
| Ellipticals with from HI data | ||||||||
| IC 2006 | (R)SA0- | 31 | 16.7 | 128.0 1.7 | 221 14 | 2.4 | 8,9 | |
| NGC 2865 | E3-4 | 65 | 31.2 | 169.4 7.0 | 240 15 | 3.2 | 10,11 | |
| NGC 2974 | E4 | 55 | 24.0 | 254.8 3.8 | 355 60 | 1.8 | 12,8 | |
| NGC 4278 | E1-2 | 45 | 7.9 | 250.7 7.7 | 326 40 | 3.3 | 13,14 | |
| NGC 5266 | SA0-: | 63 | 37.1 | 182.1 9.3 | 270 40 | 7.6 | 15,16 | |
| Ellipticals with from dynamical models | ||||||||
| NGC 315 | E+: | 69.3 | 333 50 | 569 59 | 0.8 | 17,18 | ||
| NGC 1399 | E1 pec | 18.1 | 308 28 | 424 46 | 0.5 | 17,18 | ||
| NGC 2434 | E0-1 | 14.9 | 212.6 1.7 | 331 42 | 0.8 | 17,18 | ||
| NGC 3193 | E2 | 17.3 | 209 29 | 303 25 | 0.4 | 17,18 | ||
| NGC 3379 | E1 | 10.1 | 202 18 | 259 23 | 0.6 | 17,18 | ||
| NGC 3640 | E3 | 15.2 | 177.2 6.8 | 279.2 8.7 | 0.2 | 17,18 | ||
| NGC 4168 | E2 | 28.9 | 182.4 5.8 | 287 21 | 0.4 | 17,18 | ||
| NGC 4278 | E1-2 | 7.9 | 250.7 7.7 | 416 13 | 0.1 | 13,18 | ||
| NGC 4374 | E1 | 12.2 | 280 25 | 410 31 | 0.3 | 17,18 | ||
| NGC 4472 | E2 | 11.3 | 279 19 | 464 36 | 0.2 | 17,18 | ||
| NGC 4486 | E+0-1 pec | 15.5 | 351 19 | 507 38 | 0.2 | 17,18 | ||
| NGC 4494 | E1-2 | 17.0 | 124 17 | 261 25 | 0.2 | 17,18 | ||
| NGC 4589 | E2 | 28.9 | 214 30 | 333 22 | 0.3 | 17,18 | ||
| NGC 4636 | E0-1 | 10.3 | 186 22 | 341 13 | 0.2 | 17,18 | ||
| NGC 5846 | E0-1 | 21.8 | 266 23 | 338.3 8.8 | 0.8 | 17,18 | ||
| NGC 6703 | SA0- | 34.7 | 171.6 1.6 | 222 29 | 1.0 | 17,18 | ||
| NGC 7145 | E0 | 24.5 | 133.1 4.8 | 210 31 | 0.8 | 17,18 | ||
| NGC 7192 | E+: | 36.8 | 186 17 | 270 18 | 0.4 | 17,18 | ||
| NGC 7507 | E0 | 21.6 | 236 15 | 399 61 | 0.6 | 17,18 | ||
| NGC 7626 | E pec: | 48.6 | 225 22 | 401 32 | 1.0 | 17,18 | ||