Discovery of a Large 200 kpc Gaseous Nebula at with the Spitzer Space Telescope
Abstract
We report the discovery of a very large, spatially extended Ly-emitting nebula at associated with a luminous mid-infrared source. The bright mid-infrared source ( mJy) was first detected in observations made using the Spitzer Space Telescope. Existing broad-band imaging data from the NOAO Deep Wide-Field Survey revealed the mid-infrared source to be associated with a diffuse, spatially extended, optical counterpart in the band. Spectroscopy and further imaging of this target reveals that the optical source is an almost purely line-emitting nebula with little, if any, detectable diffuse continuum emission. The Ly nebula has a luminosity of and an extent of at least 20″ (160 kpc). Its central shows an ordered, monotonic velocity profile; interpreted as rotation, this region encloses a mass . Several sources lie within the nebula. The central region of the nebula shows narrow () emission lines of C IV and He II. The mid-infrared source is a compact object lying within the nebula, but offset from the center by a projected distance of (20 kpc), and likely to be an enshrouded AGN. A young star-forming galaxy lies near the northern end of the nebula. We suggest that the nebula is a site of recent multiple galaxy and AGN formation, with the spatial distribution of galaxies within the nebula perhaps tracking the formation history of the system.
1 Introduction
How do the most massive galaxies form? This is a question whose answer may provide one of the central tests of hierarchical galaxy formation theories. Our current theoretical paradigm suggests that the most massive galaxies form, like the rest of the galaxy population, by the hierarchical merging of smaller units and that this process occurs through the history of the universe. In seeming contrast, however, three lines of evidence suggest that at least some of the most massive galaxies may have had more dramatic origins. First, observations of the most massive galaxies at redshifts out to suggest that the bulk of the stars in these objects formed at much higher redshifts in a brief time period characterized by very high star-formation rates () (e.g., McCarthy et al. 2004). Second, the host galaxies of powerful radio sources, which appear to be dynamically relaxed massive ellipticals at redshifts out to one (e.g., Zirm et al. 2003), at higher redshifts () are surrounded by large (100200 kpc), luminous () Ly nebulae and small, embedded, star-forming objects (e.g., Reuland et al. 2003). This suggests that these host galaxies are formed in a rather spectacular gravitational collapse event rather than by the slow build-up of many merging events over time (Reuland et al. 2003). The discovery of large, diffuse Ly haloes in several surveys and their association with large galaxy overdensities adds further support to the idea that these haloes mark the formation sites of massive galaxies (e.g., Keel et al. 1999; Steidel et al. 2000; Francis et al. 2001; Palunas et al. 2004; Matsuda et al. 2004). Third, the recent discoveries that dust-enshrouded galaxies selected in sub-mm surveys have very large star-formation rates, large correlation length and high median redshift suggest that this population may represent the formation epoch of massive galaxies (e.g., Blain et al. 2004; Chapman et al. 2004). Taken together, the empirical picture that emerges for massive galaxy formation is one of a violent, perhaps brief epoch of dust-enshrouded star-formation followed by a more gradual unveiling of the galaxy by the dissipation of its dusty, gaseous envelope.
It is clearly of great interest, therefore, to find and characterize the formation sites of massive galaxies. Thus far we have been limited to studying the (100 kpc) Ly halos and environments of luminous radio galaxies, which may be affected in peculiar ways by the presence of the active galactic nucleus and its ejecta, and to the similarly large Ly nebulae in two regions: four associated with a massive structure at Francis et al. (2001); Palunas et al. (2004) and two others associated with a structure at (Steidel et al. 2000; Matsuda et al. 2004). It is worth noting that the only narrow-band emission line surveys that have yielded discoveries of these spectacular Ly haloes have been targeted at large mass overdensities, so their mutual association may be misleading. Ground-based sub-mm surveys provide a less biased approach in principle, but so far have been limited by technology: the current suite of bolometer arrays provide poor positional accuracy and limited fields of view which are not suited to wide-field surveys.
In this paper, we present observations that suggest that mid-IR surveys with Spitzer Space Telescope may provide an alternate approach: we report on observations of a luminous, very spatially extended Ly nebula at discovered by virtue of its associated 24µm emission. We present the description of our observations of this nebula in §2 and our results and measurements in §3. In §4, we discuss the implications of this discovery on future studies of massive galaxy formation.
Throughout this paper we use , , . At a redshift the luminosity distance is Gpc and 1 ″ corresponds to a physical size of 7.96 kpc.
2 Observations
The optical photometry of this source is derived primarily from the images obtained by the NOAO Deep Wide-Field Survey (NDWFS111See also http://www.noao.edu/noaodeep/; Jannuzi & Dey 1999; Jannuzi et al. 2005; Dey et al. 2005). The NDWFS is a deep, ground-based, optical and near-infrared imaging survey of two 9.3 square degree fields, one in Boötes and one in Cetus, conducted using the 4m and 2.1m telescopes of the National Optical Astronomy Observatory. The survey is designed to study the evolution and clustering of galaxies over a wide range in redshift, and reaches median 5 point-source depths in the and bands of 27.1, 26.1, 25.4 and 19.0 mag (Vega) respectively. The data products for the NDWFS will be described elsewhere (Dey et al. 2005; Jannuzi et al. 2005, in preparation). The specific optical image stacks used in this paper have , , and band exposure times of 2.67, 2.67 and 3.33 hours and reach 5 point-source depths of 27.31, 26.23 and 25.47 mag respectively. Stars in all three image stacks have FWHM1″. The source is undetected in the near-infrared data of the NDWFS. The NDWFS astrometry is tied to the reference frame defined by stars from the USNO A-2 catalog (Monet et al. 1998).
The NDWFS Boötes field was mapped at 24, 70 and 160µm using the Multiband Imaging Photometer for Spitzer (MIPS; Rieke et al. 2004) in late January 2004 to 1 rms depths of 51Jy, 5mJy and 18mJy respectively. The data were reduced by the MIPS GTO team. Details of the survey, including the mapping strategy, data reduction and the resulting catalog, will be discussed elsewhere (LeFloc’h et al. 2005, in preparation). The entire Boötes field was also mapped at 3.6, 4.5, 5.6 and 8.0µm using the Infrared Array Camera (IRAC; Fazio et al. 2004) on Spitzer; details of the IRAC observations may be found in Eisenhardt et al. (2004). Both the MIPS and IRAC data are astrometrically calibrated to the 2MASS astrometric frame.
Initial optical identifications of the MIPS sources with 24m flux densities brighter than 0.75mJy were done using the image catalogs from the NDWFS. The MIPS 24µm sources are all unresolved at the 6″ angular resolution of the Spitzer Space Telescope. The images of all MIPS sources with optical associations fainter than =23 mag were visually inspected. A 24µm source SST24 J1434110+331733 with a flux density of 0.86mJy was found to lie within a faint, diffuse, spatially extended optical source with blue optical colors, which suggested that the colors may be the result of strong line emission in the band.
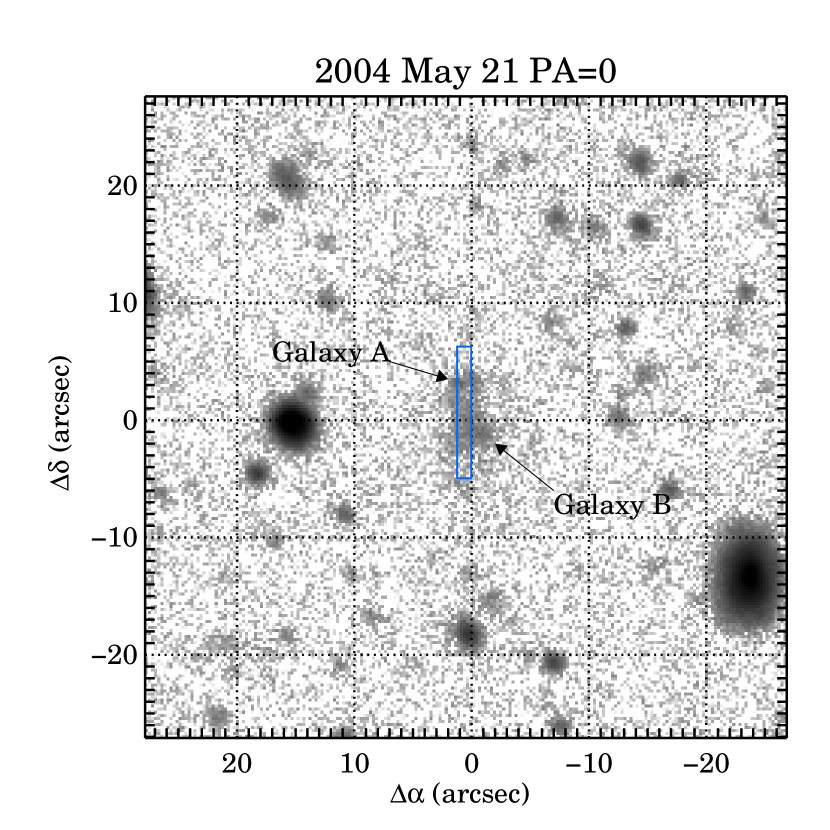
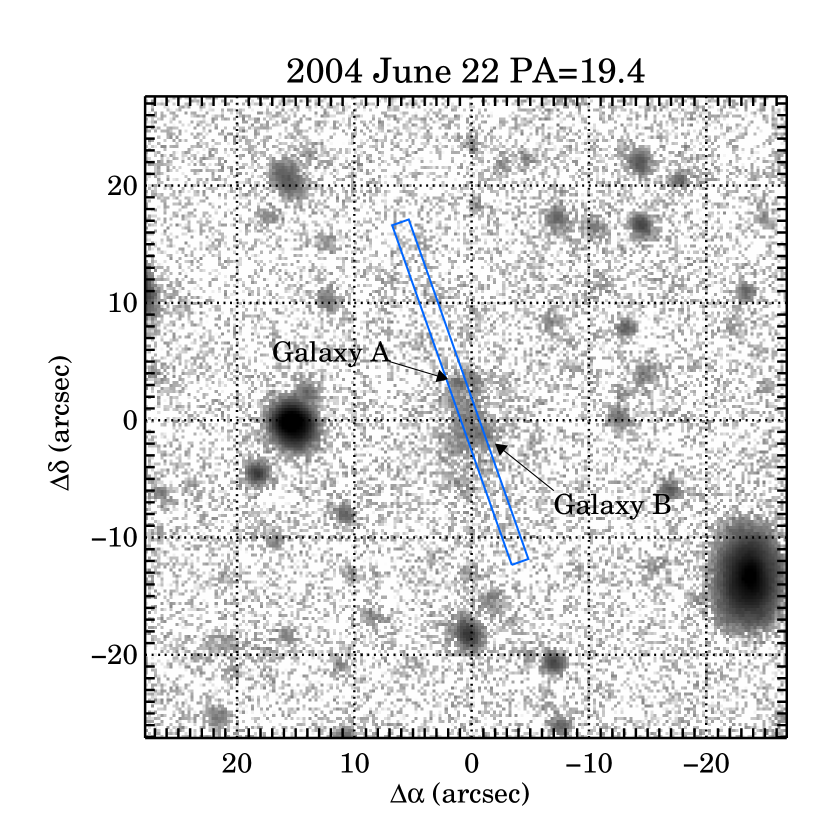
Spectroscopic observations of the MIPS 24µm candidate SST24 J1434110+331733 were obtained using the Low Resolution Imaging Spectrometer (LRIS; Oke et al. 1995) on the Keck I telescope on U.T. 2004 May 21 and 2004 June 22. The first set of observations, four 30 min exposures, were obtained in 0.8″ seeing through a 1.0″ wide and 11″ long slitlet oriented at PA=. LRIS was configured with the 5600Å dichroic, the 400l/mm (=3400Å, 1.09Å pix-1) grism on the blue side and the 400l/mm (=8500Å, 1.86Å pix-1) grating on the red side. A second set of five 30 min observations were obtained in 1″ seeing through a 1.5″ wide and 30″ long slitlet oriented at PA=, with the 6800Å dichroic, 300l/mm (=5000Å, 1.43Å pix-1) grism, and the same red grating. In each observation set, the telescope was offset by a few arcsec between individual 30 min exposures. Relative spectrophotometric calibrations were performed using observations of Wolf 1346 (Oke 1990; Massey et al. 1988; Massey & Gronwall 1990). Figure 1 shows the location and orientation of the LRIS slitlets on the image of the source.
Additional optical observations of the field were obtained using the MiniMOSAIC camera (“MiniMo”) on the WIYN 3.5-m telescope of the Kitt Peak National Observatory on the nights of U.T. 2004 June 14 – 17. A total of six 1200 s images were obtained through the 62Å-wide narrow-band filter centered at 4448Å (hereinafter NB4448, also called “W20” in the WIYN filter set; centered on the redshifted Ly line) and three 900 s images were obtained through a Gunn filter. The seeing varied from night to night, but point sources in the final NB4448 and G-band image stacks have an effective FWHM of 07 and 08 respectively. The data were calibrated using observations of the spectrophotometric standard Feige 110 (Oke 1990; Stone 1977) through the NB4448 filter and Landolt field SA112 (Landolt 1992) through the Gunn filter on photometric nights.
All the WIYN optical imaging data were astrometrically calibrated using the USNO A-2 catalog and tied to the same astrometric frame as the NDWFS imaging data. There is a small astrometric offset between the IRAC and MIPS 2MASS frame and the NDWFS/USNO A-2 frame of roughly 05 which we corrected before comparing the Spitzer and ground-based data. All positions quoted here are on the NDWFS/USNO A-2 reference frame.
3 Results
3.1 Morphology and Astrometry
Image cutouts of the , , and images are shown in figure 2, with the contour map from the NB4448 image overlaid on the -band image222Larger finding charts of the field and astrometry of offset stars may be determined from image cutouts of the NDWFS available from the NOAO Science Archive (http://www.archive.noao.edu/ndwfs/).. The system is diffuse and relatively bright in the band, which is largely dominated by the Ly line emission; there is a fairly compact galaxy at its northern extent which is labelled ‘A’ in figure 2. In contrast to the image, the , and band cutouts show only little (if any) diffuse emission, but do show some light associated with the regions ‘A’ and ‘B’. The Ly emission appears to avoid ‘A’. The center of the Ly emission lies near ‘B’, but slightly to its east; the spectrum of this central region is therefore contaminated by continuum emission from ‘B’.
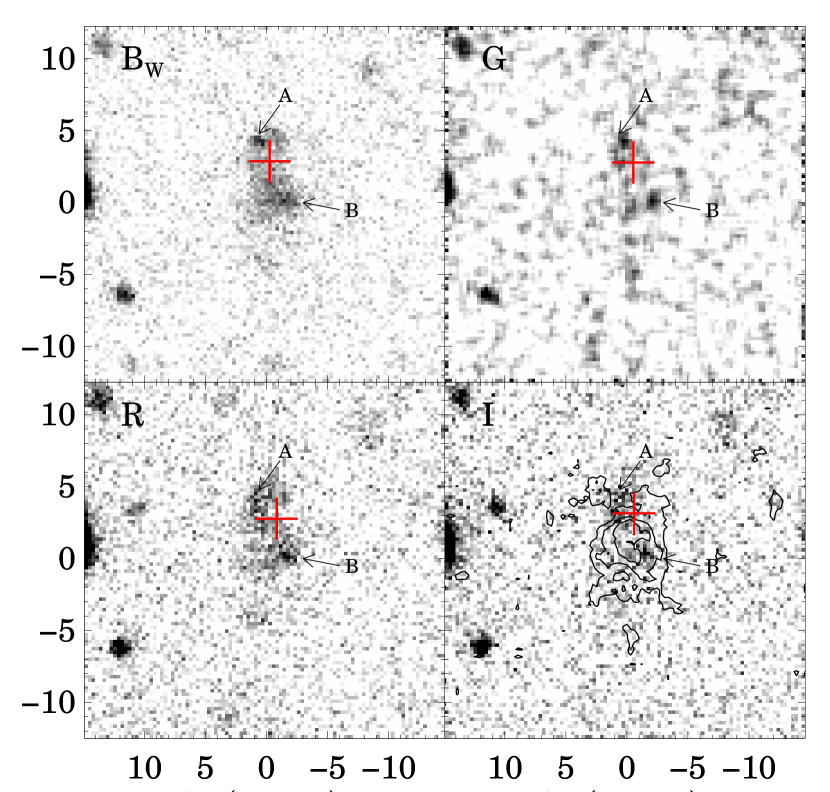
The NDWFS astrometry is tied to a frame defined by moderately bright (1217 mag) stars in the USNO A-2 catalog, whereas the MIPS astrometry is calibrated using 2MASS. Roughly 98% of the bright ( mJy) MIPS sources have well determined optical counterparts in the NDWFS data, and comparisons of the relative astrometry between these MIPS and NDWFS matches show a small, but significant relative offset of and between the two frames. The offset arises because of a small magnitude-dependent astrometric error internal to the USNO A-2 catalog (Monet et al. 2003). The MIPS source is located at in the J2000 2MASS reference frame. In the optical reference frame of the NDWFS, the source position is (J2000). Taking this offset into account, the MIPS source is found to lie on the northern end of the diffuse emission observed in the NDWFS and NB4448 images, just to the southwest of galaxy A (fig 2). The location of the MIPS source is marked by a cross, and is believed to be accurate to . It lies west and south of galaxy A and east and 26 north of galaxy B. The Ly emission is centered roughly 25, or 20 kpc (projected), away from the MIPS source.
The position of the IRAC source detected in the 3.6µm, 4.5µm, and 8µm bands agree with the MIPS 24µm source position to 05, and confirm the relative (non-central) location of the mid-infrared source within the Ly nebula.
3.2 Photometry
Table 1 presents our photometric data on SST24 J1434110+331733. The optical photometry was measured in a large aperture of radius 10″ centered on the centroid of the Ly halo. The flux in the band is dominated by the Ly emission, and the optical measurement aperture for all bands includes galaxies A and B. These optical measurements should therefore be strictly treated as upper limits to the continuum emission from the region. Higher spatial resolution imaging and spectroscopy along PA90∘ will be necessary to disentangle the contribution of galaxy B and determine the true continuum contribution from sources within the nebula.
| Band | Wavelength | Width | Aperture Center | Aperture | Magnitude | |
|---|---|---|---|---|---|---|
| (µm) | (µm) | (J2000) | Radius | (Vega) | () | |
| NDWFS | 0.422 | 0.112 | 10″ | |||
| Gunn | 0.492 | 0.067 | ” | 10″ | ||
| NDWFS | 0.659 | 0.183 | ” | 10″ | ||
| NDWFS | 0.808 | 0.172 | ” | 10″ | ||
| NDWFS | 2.167 | 0.295 | ” | 6″ | aaThe upper limit is 2 in a 6″ radius aperture. | aaThe upper limit is 2 in a 6″ radius aperture. |
| IRAC 3.6µm | 3.56 | 0.75 | 6″ | |||
| IRAC 4.5µm | 4.52 | 1.01 | ” | 6″ | ||
| IRAC 5.8µm | 5.73 | 1.42 | ” | 6″ | ||
| IRAC 8µm | 7.91 | 2.93 | ” | 6″ | ||
| MIPS 24µm | 24.0 | 5.3 | bbThe MIPS photometry was determined using PSF-fitting techniques. | |||
| MIPS 70µm | 70.0 | 19.0 | ||||
| MIPS 160µm | 160.0 | 34.5 | ||||
| WSRT 1400MHzccWSRT measurement is from the deep 1400MHz survey of de Vries et al. (2002). The source is unresolved in the 13″27″ beam. | 20cm |
3.3 Redshifts of the Nebula and Coincident Sources
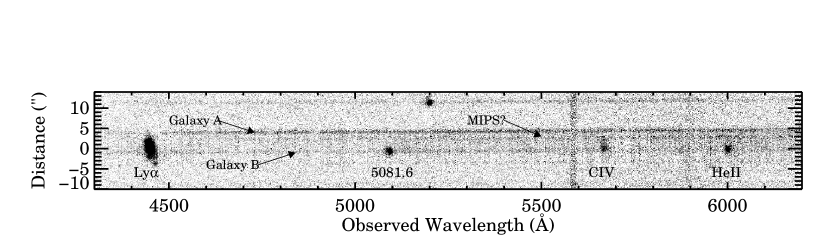
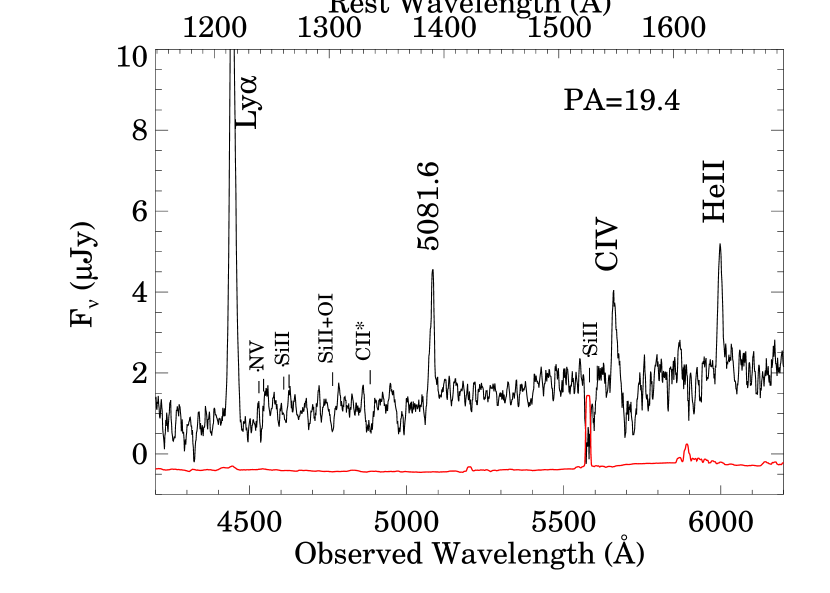
The spectroscopic observations reveal a very complex system within the extent of the nebula, comprised of several continuum sources. Figure 3 shows the two-dimensional spectrum recorded on the blue side of LRIS in PA=19.4∘, and figure 4 shows the extracted one-dimensional spectrum of the system obtained through a (wide) 10915 aperture from these data. Emission line measurements are presented in table 2. The redshift of the system is well established at through the detection of Ly, C IV, He II and weak C III].
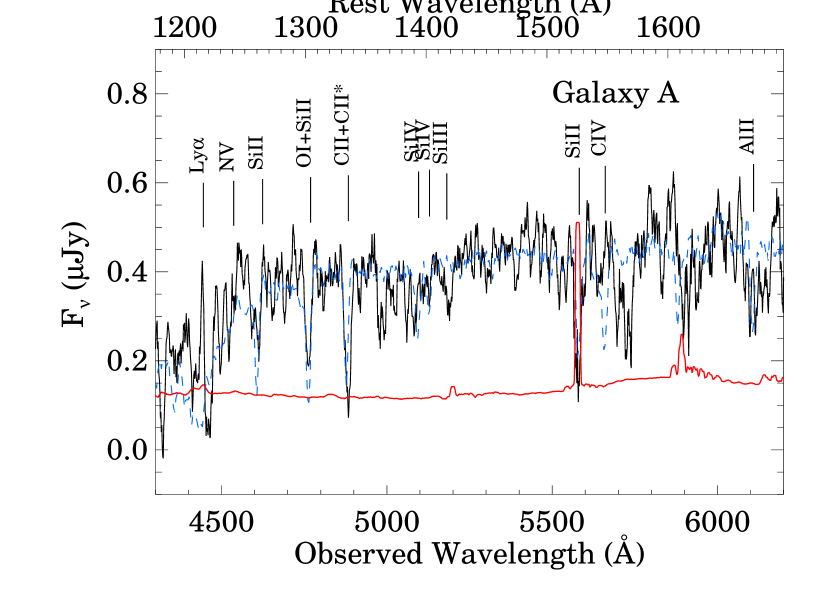
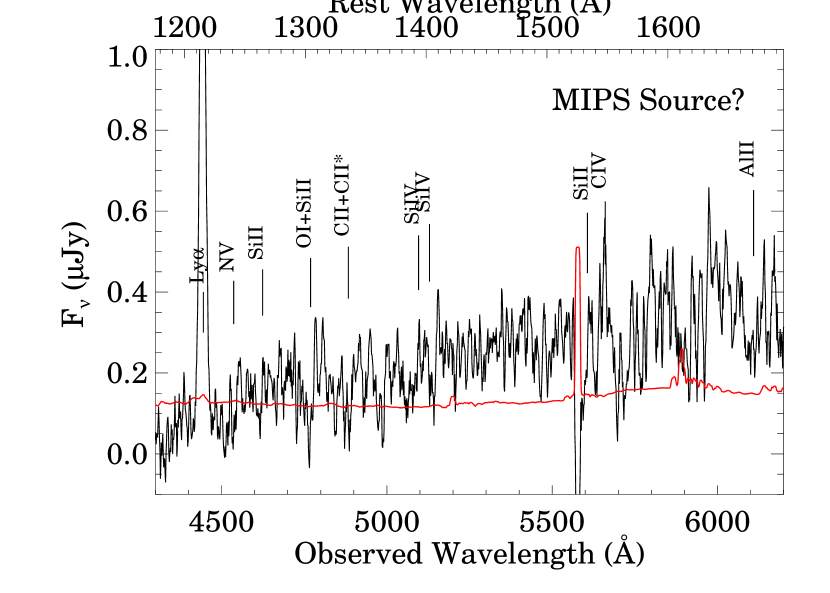
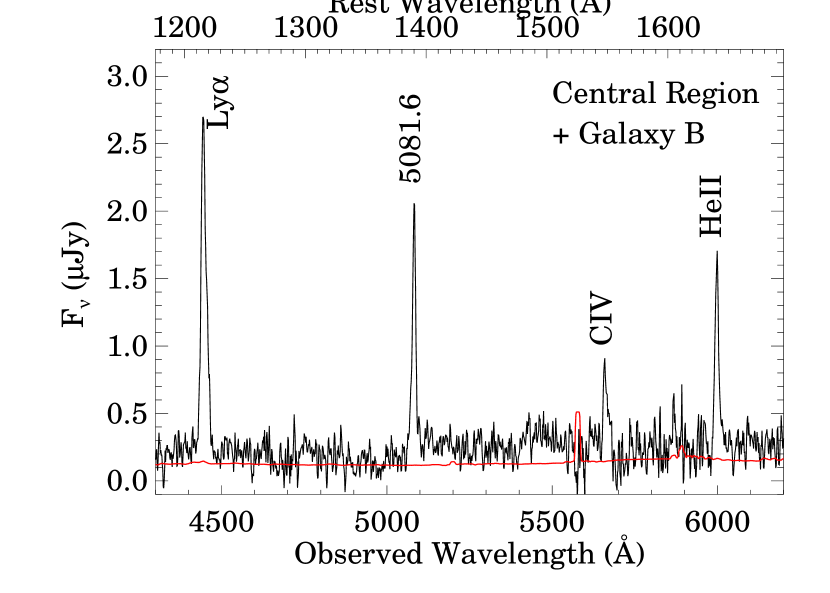
There are three main continuum contributors to this large-aperture spectrum: (i) galaxy A (figure 5), (ii) a source 16 southwest of galaxy A along the PA=19.4∘ slitlet which may be associated with the MIPS source (figure 6), and (iii) a source 47 southwest of A, and close to the location of galaxy B (figure 7). We discuss each of these in turn.
The spectrum of galaxy A (figure 5) reveals a “Lyman-break galaxy” at a redshift of , characterized by a flat continuum, interstellar absorption lines and no detectable Ly emission. The interstellar absorption lines observed in typical Lyman-break galaxies can be blue shifted due to winds, and the redshift estimate based on these is therefore only good to . The absorption line spectrum seen in figure 4 is almost entirely due to the continuum contribution from galaxy A to the large aperture extraction.
The spectrum of the second continuum source (figure 6) is quite red and shows weak C IV and C III] emission at , i.e., the redshift of the nebula. Its proximity to the MIPS 24µm location suggests that it may be a star-forming galaxy reddened by dust. There are some possible continuum features visible in the spectrum of this source, that are consistent with a young, reddened star-forming object. No obvious emission lines uniquely due to an AGN are detected in this source.
The spectra of galaxy A and the MIPS source both show a fairly broad absorption feature at 5720Å. The signal-to-noise ratio in this region is low, and sky subtraction using traditional fitting techniques on very extended faint objects can sometimes result in such features. If this feature is real, it is most likely to be due to a foreground absorption system, perhaps arising from either MgII2800 at or an FeII 2600Å absorption complex at .”
The third continuum source (figure 7) is the most intriguing: it lies near the center of the Ly nebula and apparently shows strong associated C IV and He II emission at the redshift of the nebula. This continuum source also shows an emission feature at 5081.6Å, the identification of which is uncertain. This feature is unlikely to be an emission line at the redshift of the Ly nebula, since it does not match any strong features normally observed in high-redshift galaxies or AGN: at a rest wavelength of 1389.9Å, it could only be associated with blue-shifted SiIV1393.8,1402.8 emission, and would be the only feature with such a blue shift relative to the He II redshift, which seems very improbable. This spectral line also does not appear in the PA=0∘ spectrum, strongly suggesting that it is associated with galaxy B. Since the 5081.6Å line does not correspond to any normal species at the redshift of the Ly nebula, we therefore suspect that galaxy B is an interloping system that does not lie at the redshift of the nebula. Given the asymmetry of the 5081.6Å emission line and the break in the continuum across the line, we suggest that galaxy B is a background source at a redshift of 3.180. Galaxy B is located too far away from the centroid of the MIPS 24µm emission and is therefore also not the source of the infrared emission. The spatial coincidence of the 5081.6Å feature and the He II and C IV emisson lines in our spectrum must therefore be due to the unfortunate circumstance of the two contributing sources, the emission line source at and the background galaxy at , being located approximately along the short-axis of our slit, parallel to the dispersion direction. It is also likely that the continuum emission that we observe at this location is primarily due to galaxy B, and unrelated to the nebula.
The source near the top of the slit in figure 3 shows an asymmetric emission line at 5188.5Å and a break across the line; this emission line is consistent with Ly at a redshift of 3.268, and this galaxy is also a background source.
We are left, therefore, with the interpretation that two unrelated background sources are present in this 1530″ slitlet, both at redshifts above three. We are confident the emission line detections associated with these objects are not instrumental effects, since they repeat on all the individual exposures and move in concert with their associated continuum when the targets were offset along the slit. It is not exceptional to find a serendipitous source with during LRIS spectroscopy; our experience is that one such source appears in about 15% of the masks used. Given the surface density of Lyman break galaxies (1.2 per sq. arcmin for mag; Steidel et al. (2003)), the Poisson probability of finding 2 in a single mask is 1.8%, and in a single slitlet is 0.01%. Note that these are lower limits to the probabilities since Lyman break galaxies are clustered. The redshift separation between the two background galaxies suggests a minimum comoving relative distance of 80 Mpc. Further spectroscopy of this region is clearly of interest in order to understand the field galaxy redshift distribution.
| Line | Obs. Wavelength | Aperture | Flux | FWHM | Obs. EW | Luminositybb Luminosities are calculated for a cosmology with . |
|---|---|---|---|---|---|---|
| (Å) | (″) | () | (Å) | (Å) | () | |
| Ly | 4448 | 10.0 radiusccMeasured from the narrow-band image after subtracting the continuum flux estimated from the G-band image | - | - | ||
| Ly | 4444.7 | 10.91.5 | 13.0 | 316 | ||
| Ly | 4445.0 | 4.51.5 | 12.8 | 396 | ||
| NV | - | 4.51.5 | ddUpper limits quoted are 3 and assume lines of the same width as the He II feature. | - | 7.3 | |
| C IV | 5662.0 | 4.51.5 | 15.2eeC IV width is measured by modelling the doublet as a single feature. | 85 | ||
| He II | 5997.9 | 4.51.5 | 7.3 | 60 | ||
| C III] | 6974.6 | 4.51.5 | 13 | |||
| - | 5081.6 | 4.51.5 | 4 | 87 |
3.4 Spatial Extent of the Ly Nebula
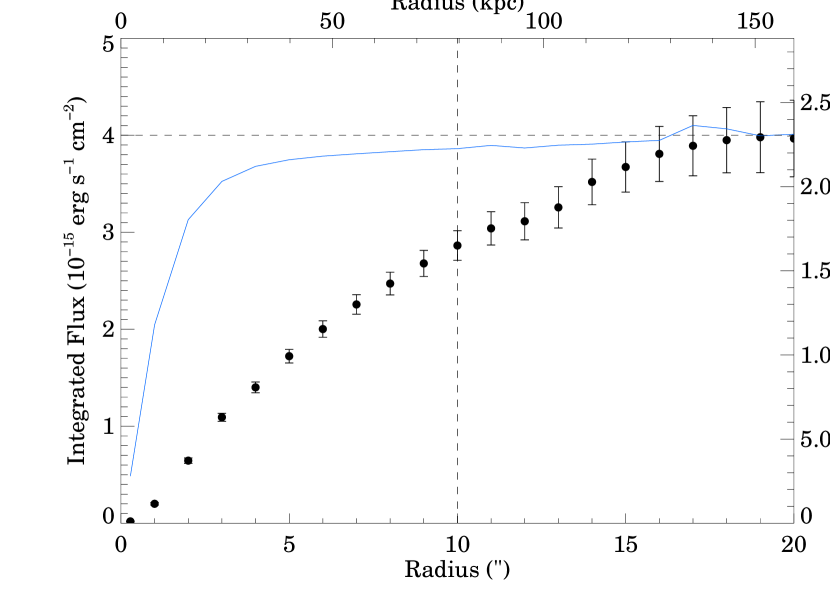
A visual examination of the NB4448 image at a hard stretch shows that the high surface brightness portion of the Ly nebula is at least 10″ in size, but that there is faint diffuse emission extending over larger scales. In order to explore the full spatial extent of the nebula, we compared its radial profile with that of stars measured in the same image. Figure 8 shows the integrated radial profile of the nebula compared with the median profile determined from 10 stars in the NB4448 image, normalized to the same total flux. It is clear that the nebula is spatially extended to a radius of at least 15″ (nearly 120 kpc)! There are hints that the nebula may be even more extended, but deeper narrow-band imaging observations are necessary to confirm this.
The emission seen in the narrow-band filter is not significantly affected by continuum emission. The Gunn filter only spans the wavelength range 12401460Å in the rest frame of the system, and therefore excludes the redshifted Ly, C IV and He II line emission from the nebula. This band provides a good measurement of the line-free flux from the region which we can use to estimate (and subtract) the continuum contribution in the NB4448 filter. In an aperture of 10″ radius, the continuum contribution is only in the NB4448 filter, i.e., only 7% of the total flux. This estimate assumes that the continuum components are due to interlopers and contribute across the entire wavelength region of the narrow-band filter. If we instead assume that the continuum arises from sources at the redshift of the nebula, then the continuum contribution within the narrow-band filter would be reduced due to Ly forest absorption in the intergalactic medium. Using the Madau (1995) approximation for the total continuum absorption, we estimate that the continuum contribution would be about 13% smaller under this assumption, and the total derived Ly flux imperceptibly larger.
3.5 Velocity Structure in the Nebula
Our spectroscopic observations are not sufficiently deep to detect the nebula across its full extent, and we restrict our discussion here to the central 8″ region.
Ly is a resonance line, and its profile is generally dominated by radiative transfer effects, being affected by resonant scattering and absorption by gas and dust. It is therefore generally a poor tracer of the gravitational potential or the physical properties of the gas. However, at present, this is the only real tracer we have of this system; we therefore use it to provide some indication of the kinematic properties of the system with these caveats in mind.
We extracted spectra in 04 (3-pixel) apertures from each of our spectroscopic observations and fit the Ly profile with a Gaussian model. The fits are fairly good approximations to the emission line profile; the profiles are only very slightly asymmetric across most of the nebula. We also performed similar fits on the [OI]5577 night sky emission line, and found that the tilt this line varied by across the portion of the slitlets covering the Ly nebula.
Figure 9 shows the velocity structure in the Ly line as determined by these fits. The seeing for both observations was typically twice the aperture, and neighboring points in the figure are therefore correlated. The nebula exhibits a monotonic change across the central 4″ in both the central velocity and the velocity dispersion, with deviations from this trend only near the extrema where the signal-to-noise ratio is low.
The remarkable aspect of the measured profile is that its velocity varies so uniformly across the central region. Fitting a straight line to the data from the two observations using a robust least absolute deviation algorithm results in a velocity profile across this central region of in PA=0∘ and in PA=19.4∘, where is the angular separation in arcseconds. This smooth variation is unlikely to be due to a smooth change in the absorption by neutral hydrogen, since the line profile does not show strong evidence for this. If it is due to the gas kinematics, then the variation could be due to infall, outflow or rotation, and it is not easy to discriminate between these options with the present data.

3.6 Spectral Energy Distribution
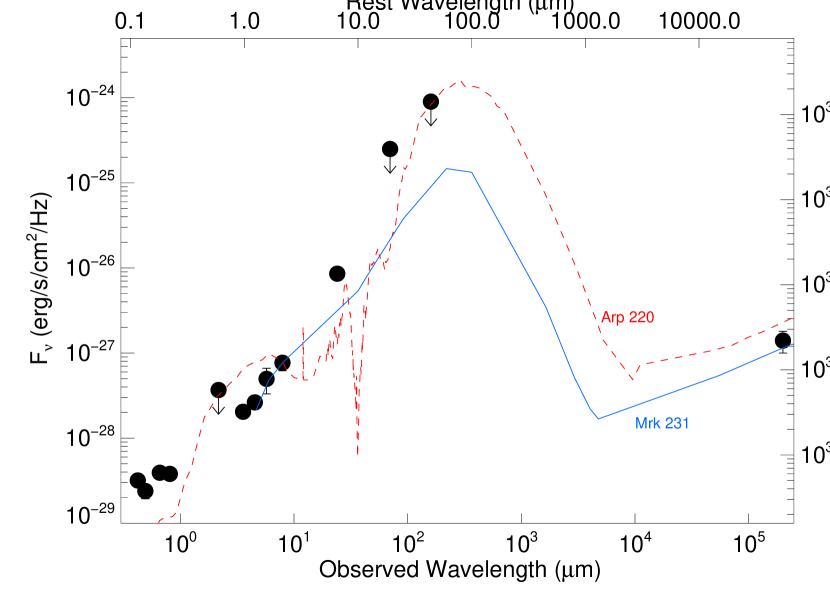
Figure 10 shows the spectral energy distribution (hereinafter SED) of SST24 J1434110+331733. The optical data points should be regarded as upper limits, since they include continuum contributions from galaxies A and B.
A model for the SED of Arp 220 (constructed from the models of Silva et al. (1998) and Spoon et al. (2004)) placed at and scaled by a factor of 26 is shown for comparison in figure 10. The scaling factor was chosen to match the observed IRAC 8µm flux density of SST24 J1434110+331733. The SED of Arp 220 differs from that of SST24 J1434110+331733 in two ways. First, the rest-frame UV emission observed in SST24 J1434110+331733 is much larger than that from Arp 220. This is not surprising: as mentioned before, the UV points are contaminated by other sources (and the bluest point by the strong Ly line emission). Second, the 5.8µm and 8.0µm IRAC points lie significantly above the prediction of the Arp 220 template. This region of the spectrum is of interest because it is where the SED of Arp 220 tranisitions from being dominated by starlight at shorter wavelengths to being dominated by dust emission at longer wavelengths. The SED of SST24 J1434110+331733 shows no evidence for such a transition, suggesting that perhaps there is little or no significant contribution from starlight in this portion of the spectrum. Indeed, the mid-infrared continuum measurements from Spitzer () are well-modeled by a simple quadratic power-law, , also suggesting that the Spitzer bands are not strongly affected by emission from polycyclic aromatic hydrocarbons (PAHs), of which the strongest features are redshifted out of the IRAC bandpasses.
The mid-infrared color of SST24 J1434110+331733 lies in the region of parameter space more generally occupied by quasars than by normal star-forming galaxies (e.g., Stern et al. 2005; Lacy et al. 2004). Figure 10 also shows the SED of the Seyfert 1 galaxy Mrk 231 (e.g., Ivison et al. 2004) placed at the redshift of SST24 J1434110+331733 and scaled by a factor of 2. The SED of Mrk 231 is a better fit to the observed 3.6µm to 24µm photometry of SST24 J1434110+331733, and suggests that this source is an enshrouded AGN. The observed excess in the MIPS 24µm band over the Mrk 231 SED may be due to 7.7µm PAH emission.
The most likely emission mechanism responsible for the mid-infrared luminosity is dust emission. Emission at these wavelengths would require dust at warm temperatures ( K), higher than those typically seen in normal or ultraluminous star-forming galaxies. However, a power-law spectrum of can also be produced by synchrotron radiation from power-law distribution of electrons, with . At longer wavelengths, synchrotron self-absorption sets in and the spectrum should take on a shape. We can use the faint radio detection of 0.14 mJy and estimate the turnover frequency to be Hz (2.5mm). This is not a very useful constraint, especially since a synchrotron spectrum of this sort has never been observed in an extragalactic source. If the slope of the radio spectrum is similar to that of Mrk 231 and its extrapolation to the mid-infrared significantly undershoots the observed mid-infrared flux densities, then the emission mechanism for the mid-infrared is thermal emission from dust grains. Observations in the sub-mm to radio wavelengths will be necessary to better constrain the radiation mechanism for the IR portion of the SED.
If SST24 J1434110+331733 has a similar SED to that of Arp 220 (Mrk 231), the comparison suggests that it has a total far-infrared luminosity of ()! We emphasize, however, that these estimates are very uncertain at present, since the bulk of the luminosity emerges at wavelengths at which the flux density of SST24 J1434110+331733 is currently unknown and require a large bolometric correction. Measurements at sub-mm wavelengths are clearly crucial to establishing the shape of the SED near its peak and providing a better measure of the bolometric luminosity. If the SED is similar to that of Arp 220 (Mrk 231), we would expect 450µm and 850µm flux densities of 120 mJy (8 mJy) and 40 mJy (2 mJy) respectively. Clearly, these predictions are all within the reach of the current sub-mm observations.
We note that the mid-infrared-to-radio flux density ratio observed in SST24 J1434110+331733, , shows remarkable similarity to that of starburst galaxies, which typically have (Appleton et al. 2004). Mrk 231 also falls on this relation, although it is an obscured Seyfert 1; this is because its mid-infrared and radio emission are dominated by flux from the circumnuclear starburst rather than the active nucleus.
4 Discussion
In the previous section, we presented our various observations of SST24 J1434110+331733. Here, we discuss the implications of our observations for understanding the physical nature of this remarkable system.
Large Ly nebulae such as SST24 J1434110+331733 are rare. Thus far, most known large Ly nebulae are associated with powerful radio galaxies (e.g., McCarthy et al. 1990; van Ojik et al. 1997; Pentericci et al. 1997; Dey et al. 1997; Dey 1999; Villar-Martín et al. 2002, 2003; Reuland et al. 2003). Among radio quiet sources, there are two similarly large nebulae at (Ly “blobs” LAB1 and LAB2; Steidel et al. 2000) and one at (21424420 B1; Francis et al. 1996). These latter systems are associated with large galaxy overdensities, and follow-up deeper Ly imaging of these regions has resulted in the discovery of numerous other smaller Ly-emitting nebulae (e.g., Palunas et al. 2004; Matsuda et al. 2004). Similar overdensities have also been found associated with some of the Ly nebulae associated with radio sources (e.g., Keel et al. 1999; Pentericci et al. 2000).
The rarity of these 100 kpc Ly clouds, their association with powerful AGN and galaxy overdensities, and their energetics, all suggest that these regions are the formation sites of the most massive galaxies. If so, understanding the physical conditions and energetics of these systems can provide important insights into the massive galaxy formation process.
At present, it is still not clear what powers the nebulae. Is the Ly emission cooling radiation of infalling, shocked, pristine gas (Haiman et al. 2000)? Or is it photoionized by hot stars or AGN (e.g., Haiman & Rees 2001)? Or is it the cooling of outflowing shocked gas (cf. the “superwind model” of Taniguchi & Shioya 2000; Francis et al. 2001)? Much of the recent literature on the extended Ly nebulae has focussed on the radio-quiet systems (LAB1, LAB2 and the sources at ), perhaps because the absence of an obvious radio source suggested an absence of AGN (and their associated complexity) in these systems. However, more recent observations of the LAB1 system now find that it may also contain buried AGN (Chapman et al. 2004). Moreover, there are many similarities between the outer, kinematically quieter regions of the Ly halos surrounding the powerful radio sources and the radio quiet “blobs”. All this suggests that AGN may exist in all these nebulae: after all, if all massive bulges host massive black holes, then perhaps the formation of the active nucleus accompanies the formation of the galaxy.
It is then perhaps not surprising that the known large Ly nebulae reveal such complexity: compact obscured regions, formed galaxies, revealed AGN, all within their extent. If these are the largest protogalactic regions, one might expect that both star- and AGN-formation could proceed within the cloud.
4.1 Mass of the Nebula
The total mass of the nebula can be estimated dynamically (from the velocity profile of the Ly line), under the relatively poor assumptions that the line profile is not significantly affected by absorption and scattering. The smooth variation of the central wavelength of the line, the relatively constant velocity dispersion, and the overall symmetry of the line all provide some justification to these assumptions. If the velocity profile observed in the inner regions is primarily the result of rotation, then the mass internal to a radius () is , where the large range is due to the range in the velocity profile fits measured from the two different spectroscopic observations. The velocity profile is not well measured at radii larger than kpc.
Interpreting the line width is also fraught with uncertainty. Absorption by neutral hydrogen would result in the measured width being an underestimate of the true width; whereas resonant scattering would likely broaden the line. The velocity dispersion of is too large to be due to the thermal motions of the gas. If it is, instead, due to the random motions of clouds within the nebula, then we can estimate the dynamical mass of the nebula to be . These dynamical mass estimates derived from the line centroid and width are very large. However, they are surprisingly similar to the estimates derived for the large Ly halos around high-redshift radio galaxies, where dynamical mass estimates range from (Reuland et al. 2003; Villar-Martín et al. 2003; van Ojik et al. 1997). We note that in general such dynamical estimates are more sensitive to larger masses, since lower mass systems will have gradients that are not resolved by typical faint-object spectroscopic observations.
A separate estimate of the ionized gas mass may be derived by estimating the electron density from the net luminosity of the Ly emission line (cf. McCarthy et al. 1990), . The filling factor is unconstrained by the present data, but observations of line-emitting regions in cluster cooling flows suggest filling factors of order to (e.g., Heckman et al. 1989), which would suggest ionized gas masses of . If and , then a comparison with the dynamical mass estimates suggest ionization fractions of , and a rough upper limit to the filling factor of . The ionized gas fraction is low for a typical hot plasma, suggesting that a significant fraction of the mass might be contained in colder (neutral), collapsed objects, e.g., the galaxies that are forming within the cloud. Although this argument is only speculative at present, better measures of the gas density, temperature and filling factor, perhaps from deep rest-frame optical spectroscopy, can help constrain the relative fractions of hot and cold gas.
4.2 Physical State of the Gas and the Nature of the Ionizing Source
It is difficult to place firm constraints on the temperature of the gas cloud since at present Ly is the only emission line that we detect across the spatial extent of the nebula; He II1640, C IV1550 and C III]1909 are only detected in a localized region near the center of the nebula, and in addition, C IV and C III] are observed in a red, optically visible continuum source which may be associated with the mid-infrared source. There is also weak evidence that C IV may be spatially extended between the central region and the MIPS source.
The line ratios of the gas in the central region are not representative of shock ionization: the shock models of Dopita & Sutherland (1996) typically produce much higher C IV1550/He II1640 ratios (e.g., for shock velocities ) as compared to the observed value of C IV/He II and tend to overproduce NV1240 relative to what is observed in this source. Higher shock velocities (), where better matches might be produced, are unlikely given the low velocity widths observed for the C IV and He II emission lines. We cannot yet, however, rule out shock ionization in other regions of the nebula where Ly is the only detected emission line.
The He II1640 emission line is unusually strong in the central region. Its strength may be indicative of low metallicity (and therefore high temperatures) in the ionized gas in this region. However, models of star-forming galaxies typically only show He II with rest-frame equivalent widths of Å at very low metallicities () and at very young ages Myr (Schaerer 2003). Although it is possible we are witnessing this object at such an unusual and early epoch, it would be very improbable; it is therefore unlikely that the strong He II is due to low metallicity gas.
Harder ionizing continua, such as those generated by AGN, can also produce strong He II; indeed, comparable strengths of C IV and He II are commonly observed in radio galaxy spectra and “type 2 quasars” and are generally attributed to photoionization by a power-law continuum. The one oddity is the relative weakness of the observed C III] emission: most radio galaxy spectra show C III]/C IV 1, whereas we observe a ratio in this system of . The observed ratio can however be produced by a power-law ionizing spectrum and is characteristic of a large ionization parameter for a continuum (Ferland 1981) in this central region.
A crude constraint on the slope of the ionizing spectrum can be derived from the ratio of the number of He+ ionizing photons () relative to the number of H ionizing photons (): (for a K gas) (e.g., Schaerer 2002). If we relate this ratio to the number of photons at 54 eV relative to that at 13.6 eV, this ratio suggests a spectral shape of . It is intriguing that this slope is even steeper than the spectrum derived by extrapolation of the mid-infrared SED. We have not accounted for Ly absorption in this estimate, which would suggest that the ionizing spectrum is even steeper, i.e., . Note that here we have compared the full 10″ radius aperture measurement of Ly with the spectroscopic measurement of He II1640. If we compare just the measurements in the same spectroscopic apertures, we derive a ratio of for K, which would suggest an extremely hard ionizing spectrum of . This latter estimate is unlikely to be realistic, since the H+ ionization zone is likely to extend over a much larger scale than the He++ zone, but we can take it to be a very firm upper limit for the slope of the ionizing continuum.
If we assume normal HII region electron temperatures of K in the central region, then we can estimate the electron density using the strength of the Ly emission in the same aperture used to measure the high ionization lines (see Table 2). The Ly luminosity is given as , where is the volume of the emitting region, and are the electron and proton number densities, is the filling factor of the ionized gas, and is the effective recombination coefficient for H (Storey & Hummer 1995). In the central region, we find ; combined with the ionization parameter estimate, this implies a hydrogen ionizing photon flux in the central region of photons s-1. We have no direct measure of the electron density, and therefore no firm constraints on the volume filling factor of the ionized gas. However, if we use the rough upper limit to the filling factor from the previous subsection, then photons s-1.
Using a similar analysis for the total Ly luminosity measured in a 10″ radius aperture, we find for the average density in the nebula as a whole. For values of the filling factor , the average electron density in the line-emitting regions is in the range .
4.3 Energetics
The Ly luminosity of the nebula within a 10″ radius aperture is . This is comparable to the luminosities of the other well-known Ly nebulosities, LAB1 (Steidel et al. 2000, ) and 21424420 B1 (Francis et al. 2001; Palunas et al. 2004, ). If it is due to young, hot stars distributed over the face of the nebula in a very extended star-forming region, then the luminosity implies a net star-formation rate (Kennicutt 1983).
It is not clear what source(s) power the Ly emission. No obvious single compact source with high UV luminosity is visible within the extent of the nebula. The two galaxies A and B do not appear to be plausible candidates for the sources of the photoionizing radiation: galaxy B is at the wrong redshift, and galaxy A does not show any strong Ly emission associated with it and its UV luminosity at Å only corresponds to a modest star-formation rate of (e.g., Madau et al. 1998).
It is also not clear if the MIPS source is the source of the photoionizing radiation: it is faint at rest-frame UV wavelengths and its mid-infrared emission suggests that the source, although very luminous, is almost completely obscured from view by dust. It is therefore unlikely that short wavelength ionizing photons could escape from the nebula - clearly, little or no Ly emission does. Nevertheless, it is intriguing that the estimated far-infrared luminosity of the MIPS source is roughly two and a half orders of magnitude larger than the Ly luminosity of the entire nebula, and it is possible that some ionizing radiation could leak out in directions other than our direct line of sight. We discuss this further below.
It therefore appears that the Ly emission is powered by sources hidden from direct view, perhaps partly by the mid-infrared source, perhaps partly by another obscured or mis-directed source lying near the center of the nebula where we also observe the C IV and He II emission lines, or by distributed, faint, ionizing sources, or by shocks associated with the infall of gas into the region. The dynamical timescale of the nebula is given by . This is much smaller than the age of the Universe at (2.4 Gyr in our adopted cosmology), and suggests that we are witnessing the nebula in a young phase. The temperature of the nebular gas is unknown, but if we assume a temperature of K, then the cooling timescale is (Padmanabhan 2002; Sutherland & Dopita 1993). For gas between , log() can vary from to depending on the exact temperature and metallicity, suggesting cooling times which are very short (), implying that some source of energy (shocks? ionizing photons?) is required to maintain the nebula and render it visible. Taken at face value, the large ratio of would imply rapid collapse of the cloud into star-forming clumps.
4.4 The Mid-Infrared Source
The source SST24 J1434110+331733 detected in the Spitzer IRAC and MIPS bands lies within the extent of the Ly nebula, roughly 25 (20 kpc) away from the center. The optical spectra show a faint continuum source within the MIPS error circle, just to the southeast of the MIPS position. The spectrum of this source appears to be significantly redder than galaxy A ( for the MIPS source in the observed optical regime, versus for Galaxy A), but it does show weak associated C III] emission and possibly some C IV emission certifying its association with the Ly nebula. The optical spectrum shows no obvious signs of AGN activity (e.g., broad emission lines or strong high-ionization lines), but instead shows possible absorption lines similar to those observed in young, star-forming Lyman-break galaxies.
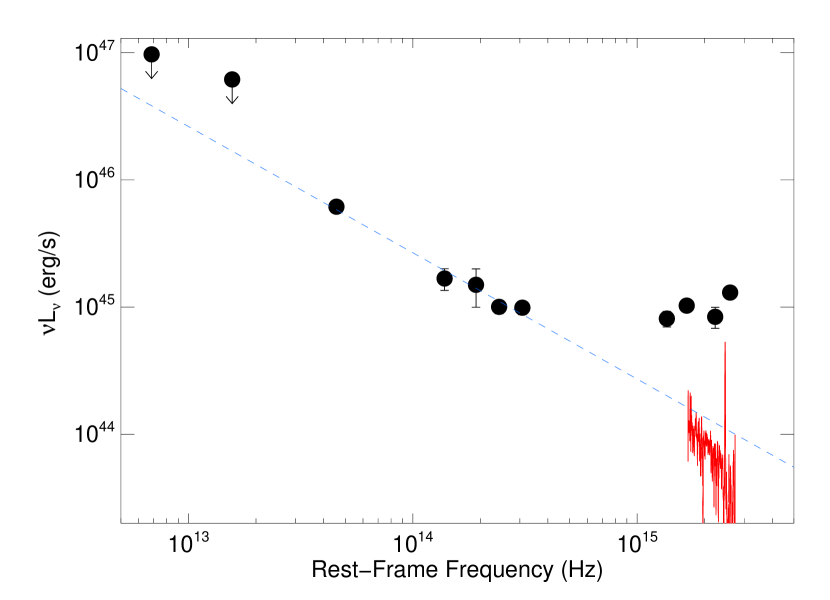
A fit to the SED in the Spitzer bands suggests a power-law spectrum of the form (figure 11). Rather surprisingly, extrapolating this power-law to rest-frame UV wavelengths 13001800Å is consistent with the observed spectrum of the faint optical source believed to be associated with the MIPS source, only overshooting the observed spectrum by a factor of 1.31.7 (figure 11). This offset is perhaps not surprising, given that we are comparing the large aperture total flux densities of the Spitzer data with the small aperture (1.5″1.0″) spectral extraction.
The mid-infrared source has poorly constrained flux densities at long wavelengths ( µm) where much of its luminosity likely emerges. As discussed in section § 3.6, if the SED is similar to that of known ULIRGs, the far-infrared luminosity of the source is likely to be in the range . If this object is a starburst, this luminoisty corresponds to a star-formation rate . If its luminosity-to-mass ratio is comparable to ULIRGs (i.e., ), the prodigious luminosity implies a total mass in dust of about if . These estimates are very coarse, but it is clear that these large bolometric luminosities imply very large masses of dust, and that a substantial mass of baryons has already been cycled through stars to produce this mass of dust.
Although the mid-infrared source is extremely energetic and lies within the nebula, it is not clear whether it is responsible for photoionizing the nebula. If we assume that the power-law represents the intrinsic spectrum of the mid-infrared source, and if it can be extrapolated to shorter wavelengths, then we can investigate whether the ionizing photons emitted by this source are sufficient to photoionize the nebula and produce the observed Ly radiation. Extrapolating the power-law would result in ionizing photons between 200Å and 912Å. The luminosity of the Ly nebula requires ionizing photons. The MIPS source can therefore be responsible for at most 18% of the Ly luminosity. This is likely a very strong upper limit, since in reality the rest-frame UV spectrum is observed to be redder than the extrapolation, and our estimate here does not account for any absorption by dust. It is possible, of course, that although the extinction to the source is severe along our line of sight, it may still have low optical depth toward the nebula (say, a mis-directed quasar). Although plausible, the geometry of the source, taken at face value, does not favor such an explanation: the MIPS source is not located at the center of the nebula and instead lies 20 kpc away from the peak of the Ly emission. The symmetry of the Ly emission around this peak, the presence of a possible ionizing source near this peak as witnessed by the presence of He II, C IV and C III] emission, and the lack of strong Ly emission cospatial with the location of the MIPS source all suggest that it is not primarily responsible for the nebula. Further spectroscopy and high spatial resolution imaging of the cloud are necessary to carefully account for all the possible ionizing sources within the cloud.
The power-law SED in the optical and mid-infrared bands exhibited by SST24 J1434110+331733 and its extreme luminosity are more typical of active galaxies and quasars than of star-forming galaxies (Pier & Krolik 1992; Nenkova et al. 2002, e.g.,). It is therefore likely that the infrared luminosity of this source is dominated by an enshrouded AGN, rather than a vigorous starburst; starlight from young stars only begins to dominate the flux at rest-frame UV wavelengths. In this respect, SST24 J1434110+331733 may be very similar to the dust enshrouded systems with extreme 24µm-to-optical colors discovered by Houck et al. (2005). Spitzer IRS spectroscopy of these extreme systems has established that they are obscured, dust-enshrouded AGN at with far-infrared luminosities in the range (Houck et al. 2005). We speculate that these objects are all extremely massive galaxies caught in an early phase of their formation. Since the AGN is currently dominating the SED, it is tempting to speculate that the supermassive black hole in these extremely massive systems form contemporaneously with the assembly of the galaxy, rather than grow slowly by subsequent accretion.
4.5 Galaxy and AGN Formation in the Cloud
In a seminal work, Elmegreen & Lada (1977) proposed that star formation in molecular clouds in our Galaxy proceeds through the sequential formation of OB subgroups, with each new subgroup driving ionization and shock fronts deeper into the parent molecular cloud, stimulating further star formation. Their model was inspired by observations of a few Galactic star-forming regions (e.g., W3, M 17 and M 42), where this sequence of events can be observed directly: an expanding HII region associated with an OB association located at the edge of a molecular cloud. A host of infrared-luminous cores and maser sources lying within the molecular cloud and near this edge bear witness to active, ongoing star-formation occurring near the location of the shock front, and suggest that the star-formation “front” is slowly eating into the cloud.
It is rather remarkable that the system reported here shows many analogous features: a Lyman break star-forming galaxy, which lies just north of a dust-enshrouded active region, which lies just north of a large region characterized by Ly cooling radiation. By analogy to the M 17 region, we postulate that this is a time sequence, with the Lyman break galaxy representing the ‘old’, revealed objects, the mid-infrared source representing the site of current star- and AGN-formation, and the central source and Ly nebula representing the region where galaxy formation is just beginning. In such an evolutionary scenario, a gas cloud, observed by its cooling radiation, would undergo collapse leading to an initial burst of star-formation and AGN activity. This immediately enshrouds the active region (through the production of dust in the ejecta of first generation supernovae), and then finally leads to a stage when the formed, star-forming galaxy is unveiled. Although highly speculative, this scenario would certainly have many merits. It might explain the low stellar masses observed in the Ly-bright regions found in the narrow-band surveys (these are the youngest objects that have just started forming stars), the very high star-formation rates observed in the SCUBA galaxies (these represent the peak star-formation phase), the relatively low star-formation rates seen in the Lyman-break galaxies (the early post-starburst phase), and no obvious evidence of systems with intermediate metallicities (they are rapidly enshrouded).
In this case, however, it is very unlikely that the formation events could be triggered by an ionization front: over the several kpc scales in question, the only relevant force is gravity, and the hypothesis presented here is simply that we may be able to estimate the time for the collapse of such a large cloud into its star-forming sub-units by age-dating the various sub-units. If, for example, galaxy A is typical of most Lyman-break galaxies at , then we can assume a minimum age of Myr since its last major epoch of star-formation (e.g., Papovich et al. 2001). Since its distance from the center of the Ly emission is kpc, a naive estimate of the rate at which galaxy formation is proceeding through the region is . Better constraints may be derived by detailed age-dating of the galaxies in the nebula. Our present data preclude such an analysis, but future spectroscopic and multiwavelength imaging observations may allow us to date the various components more reliably.
One timescale of relevance here is the formation time of the AGN associated with the mid-infrared source. Under the assumption that the bulk of the far-IR luminosity is produced by accretion onto a super-massive black hole (SMBH) at the Eddington rate, we estimate a central black hole mass of and an accretion rate of , where is the radiative efficiency of the SMBH. If the black hole grows at a constant efficiency, then a SMBH can be created by steady accretion from a small seed black hole in about years, i.e., a seed formation redshift of . Our estimates are upper limits for and the total growth time. For more massive seeds or merging of multiple seeds during the formation process, the formation time could be significantly shorter (cf. Haiman 2004; Yoo & Miralda-Escudé 2004; Shapiro 2005).
5 Conclusions
We have discovered a very large Ly-emitting nebula at a redshift of . This is the first such object discovered by its associated 24µm emission. The luminosity of the nebula ( within a 10″ radius aperture), its large spatial extent (), the detection of a star-forming “Lyman-break” galaxy and a source of intense mid-infrared emission within the nebula all suggest that it is the site of massive galaxy formation. In many of these respects, SST24 J1434110+331733 is similar to the Ly “blob” LAB1 discovered by Steidel et al. (2000). By analogy to the other large Ly “blobs” known, it is probable that this one sits within a large (several Mpc - scale) structure; further deep, wide-field Ly imaging of the region should prove fruitful.
Spectroscopy of the Ly emission reveals that the cloud is kinematically ‘quiet’ at least in its inner regions, showing a slowly and monotonically varying velocity centroid with position and roughly uniform velocity dispersion across its face. If interpreted as rotation, the implied dynamical mass contained within the central 8″ is . The velocity dispersion of the Ly emission line is large ().
The source of the ionization for the nebula is ambiguous. The geometry of the emitting region and the shape of the SED suggest that the mid-infrared source SST24 J1434110+331733 is unlikely to be responsible for more than 20% of the Ly luminosity, and it is likely that the ionization and line radiation are the result of shocks and / or multiple, distributed ionizing sources. If the Ly emission is primarily powered by hot, young stars, the total star formation rate of the system is . The detection of localized, weak, narrow C IV and He II emission near the center of the nebula suggests that at least portions of the nebula may be ionized by a power-law ionizing source or perhaps contain low metallicity gas; however, there is clearly 24µm emission from other parts of the system that most likely is due to emission from dust, suggesting that the nebula is very inhomogeneous in its properties. It is likely that multiple sources of ionization exist within the nebula.
The mid-infrared source in the nebula is very luminous; if the SED is similar to Arp 220, the implied far-infrared luminosity is . The mid-infrared SED is well modelled as a power-law , and bears more resemblance to the SEDs of active galaxies and quasars than to star-forming galaxies. We suggest that the MIPS source is a forming, enshrouded, AGN, perhaps similar to the extremely luminous dust-enshrouded AGN recently discovered through Spitzer IRS spectroscopy (Houck et al. 2005). Spectroscopy with Spitzer IRS will be necessary to determine the relative contributions of a hot dust continuum component and PAH emission to the total mid-IR flux, and will help us better constrain the relative roles of young stars and AGN in heating the dust.
Since the large Ly nebula encompasses a revealed ‘Lyman Break galaxy’ and an enhrouded active region, we suggest a scenario in which the two objects represent sites of past and present galaxy formation and the Ly emission traces the region of current infall. In a manner similar to that observed in nearby HII regions, the galaxy formation “front” in this system is moving gradually to the south (perhaps at a rate of ).
We speculate that Ly nebulae such as this one may be found through their associated far-infrared emission. Although this may appear contradictory, it is quite plausible that both strong 24µm emisison from dust (powered by enshrouded star-formation and/or accretion activity) and strong Ly emission (powered by the cooling of gas in the deep potential well and perhaps by photoionizing radiation escaping from the enshrouded regions) are joint signposts for the spectacular events associated with the formation of the most massive galaxies.
References
- Appleton et al. (2004) Appleton, P. N., Fadda, D. T., Marleau, F. R., Frayer, D. T., Helou, G., Condon, J. J., Choi, P. I., Yan, L., Lacy, M., Wilson, G., Armus, L., Chapman, S. C., Fang, F., Heinrichson, I., Im, M., Jannuzi, B. T., Storrie-Lombardi, L. J., Shupe, D., Soifer, B. T., Squires, G., & Teplitz, H. I. 2004, ApJS, 154, 147
- Blain et al. (2004) Blain, A. W., Chapman, S. C., Smail, I., & Ivison, R. 2004, ApJ, 611, 725
- Chapman et al. (2004) Chapman, S. C., Scott, D., Windhorst, R. A., Frayer, D. T., Borys, C., Lewis, G. F., & Ivison, R. J. 2004, ApJ, 606, 85
- de Vries et al. (2002) de Vries, W. H., Morganti, R., Röttgering, H. J. A., Vermeulen, R., van Breugel, W., Rengelink, R., & Jarvis, M. J. 2002, AJ, 123, 1784
- Dey (1999) Dey, A. 1999, in The Most Distant Radio Galaxies, 19–32
- Dey et al. (2005) Dey, A., Jannuzi, B. T., & et al. 2005, ApJS, in prep
- Dey et al. (1997) Dey, A., van Breugel, W., Vacca, W. D., & Antonucci, R. 1997, ApJ, 490, 698
- Dopita & Sutherland (1996) Dopita, M. A., & Sutherland, R. S. 1996, ApJS, 102, 161
- Eisenhardt et al. (2004) Eisenhardt, P. R., Stern, D., Brodwin, M., Fazio, G. G., Rieke, G. H., Rieke, M. J., Werner, M. W., Wright, E. L., Allen, L. E., Arendt, R. G., Ashby, M. L. N., Barmby, P., Forrest, W. J., Hora, J. L., Huang, J.-S., Huchra, J., Pahre, M. A., Pipher, J. L., Reach, W. T., Smith, H. A., Stauffer, J. R., Wang, Z., Willner, S. P., Brown, M. J. I., Dey, A., Jannuzi, B. T., & Tiede, G. P. 2004, ApJS, 154, 48
- Elmegreen & Lada (1977) Elmegreen, B. G., & Lada, C. J. 1977, ApJ, 214, 725
- Fazio et al. (2004) Fazio, G. G., Hora, J. L., Allen, L. E., Ashby, M. L. N., Barmby, P., Deutsch, L. K., Huang, J.-S., Kleiner, S., Marengo, M., Megeath, S. T., Melnick, G. J., Pahre, M. A., Patten, B. M., Polizotti, J., Smith, H. A., Taylor, R. S., Wang, Z., Willner, S. P., Hoffmann, W. F., Pipher, J. L., Forrest, W. J., McMurty, C. W., McCreight, C. R., McKelvey, M. E., McMurray, R. E., Koch, D. G., Moseley, S. H., Arendt, R. G., Mentzell, J. E., Marx, C. T., Losch, P., Mayman, P., Eichhorn, W., Krebs, D., Jhabvala, M., Gezari, D. Y., Fixsen, D. J., Flores, J., Shakoorzadeh, K., Jungo, R., Hakun, C., Workman, L., Karpati, G., Kichak, R., Whitley, R., Mann, S., Tollestrup, E. V., Eisenhardt, P., Stern, D., Gorjian, V., Bhattacharya, B., Carey, S., Nelson, B. O., Glaccum, W. J., Lacy, M., Lowrance, P. J., Laine, S., Reach, W. T., Stauffer, J. A., Surace, J. A., Wilson, G., Wright, E. L., Hoffman, A., Domingo, G., & Cohen, M. 2004, ApJS, 154, 10
- Ferland (1981) Ferland, G. J. 1981, ApJ, 249, 17
- Francis et al. (2001) Francis, P. J., Williger, G. M., Collins, N. R., Palunas, P., Malumuth, E. M., Woodgate, B. E., Teplitz, H. I., Smette, A., Sutherland, R. S., Danks, A. C., Hill, R. S., Lindler, D., Kimble, R. A., Heap, S. R., & Hutchings, J. B. 2001, ApJ, 554, 1001
- Francis et al. (1996) Francis, P. J., Woodgate, B. E., Warren, S. J., Moller, P., Mazzolini, M., Bunker, A. J., Lowenthal, J. D., Williams, T. B., Minezaki, T., Kobayashi, Y., & Yoshii, Y. 1996, ApJ, 457, 490
- Haiman (2004) Haiman, Z. 2004, ApJ, 613, 36
- Haiman & Rees (2001) Haiman, Z., & Rees, M. J. 2001, ApJ, 556, 87
- Haiman et al. (2000) Haiman, Z., Spaans, M., & Quataert, E. 2000, ApJ, 537, L5
- Heckman et al. (1989) Heckman, T. M., Baum, S. A., van Breugel, W. J. M., & McCarthy, P. 1989, ApJ, 338, 48
- Houck et al. (2005) Houck, J. R., Soifer, B. T., Weedman, D., Higdon, S. J. U., Higdon, J. L., Brown, M. J. I., Dey, A., Jannuzi, B. T., Le Floc’H, E., Rieke, M., Armus, L., Charmandaris, V., Brandl, B. R., & Teplitz, H. I. 2005, ApJ, in press
- Ivison et al. (2004) Ivison, R. J., Greve, T. R., Serjeant, S., Bertoldi, F., Egami, E., Mortier, A. M. J., Alonso-Herrero, A., Barmby, P., Bei, L., Dole, H., Engelbracht, C. W., Fazio, G. G., Frayer, D. T., Gordon, K. D., Hines, D. C., Huang, J.-S., Le Floc’h, E., Misselt, K. A., Miyazaki, S., Morrison, J. E., Papovich, C., Pérez-González, P. G., Rieke, M. J., Rieke, G. H., Rigby, J., Rigopoulou, D., Smail, I., Wilson, G., & Willner, S. P. 2004, ApJS, 154, 124
- Jannuzi & Dey (1999) Jannuzi, B. T., & Dey, A. 1999, in ASP Conf. Ser. 191: Photometric Redshifts and the Detection of High Redshift Galaxies, 111
- Jannuzi et al. (2005) Jannuzi, B. T., Dey, A., & et al. 2005, ApJS, in prep
- Keel et al. (1999) Keel, W. C., Cohen, S. H., Windhorst, R. A., & Waddington, I. 1999, AJ, 118, 2547
- Kennicutt (1983) Kennicutt, R. C. 1983, ApJ, 272, 54
- Lacy et al. (2004) Lacy, M., Storrie-Lombardi, L. J., Sajina, A., Appleton, P. N., Armus, L., Chapman, S. C., Choi, P. I., Fadda, D., Fang, F., Frayer, D. T., Heinrichsen, I., Helou, G., Im, M., Marleau, F. R., Masci, F., Shupe, D. L., Soifer, B. T., Surace, J., Teplitz, H. I., Wilson, G., & Yan, L. 2004, ApJS, 154, 166
- Landolt (1992) Landolt, A. U. 1992, AJ, 104, 340
- Madau et al. (1998) Madau, P., Pozzetti, L., & Dickinson, M. 1998, ApJ, 498, 106
- Massey & Gronwall (1990) Massey, P., & Gronwall, C. 1990, ApJ, 358, 344
- Massey et al. (1988) Massey, P., Strobel, K., Barnes, J. V., & Anderson, E. 1988, ApJ, 328, 315
- Matsuda et al. (2004) Matsuda, Y., Yamada, T., Hayashino, T., Tamura, H., Yamauchi, R., Ajiki, M., Fujita, S. S., Murayama, T., Nagao, T., Ohta, K., Okamura, S., Ouchi, M., Shimasaku, K., Shioya, Y., & Taniguchi, Y. 2004, AJ, 128, 569
- McCarthy et al. (2004) McCarthy, P. J., Le Borgne, D., Crampton, D., Chen, H., Abraham, R. G., Glazebrook, K., Savaglio, S., Carlberg, R. G., Marzke, R. O., Roth, K., Jørgensen, I., Hook, I., Murowinski, R., & Juneau, S. 2004, ApJ, 614, L9
- McCarthy et al. (1990) McCarthy, P. J., Spinrad, H., Dickinson, M., van Breugel, W., Liebert, J., Djorgovski, S., & Eisenhardt, P. 1990, ApJ, 365, 487
- Monet et al. (1998) Monet, D. B. A., Canzian, B., Dahn, C., Guetter, H., Harris, H., Henden, A., Levine, S., Luginbuhl, C., Monet, A. K. B., Rhodes, A., Riepe, B., Sell, S., Stone, R., Vrba, F., & Walker, R. 1998, VizieR Online Data Catalog, 1252, 0
- Monet et al. (2003) Monet, D. G., Levine, S. E., Canzian, B., Ables, H. D., Bird, A. R., Dahn, C. C., Guetter, H. H., Harris, H. C., Henden, A. A., Leggett, S. K., Levison, H. F., Luginbuhl, C. B., Martini, J., Monet, A. K. B., Munn, J. A., Pier, J. R., Rhodes, A. R., Riepe, B., Sell, S., Stone, R. C., Vrba, F. J., Walker, R. L., Westerhout, G., Brucato, R. J., Reid, I. N., Schoening, W., Hartley, M., Read, M. A., & Tritton, S. B. 2003, AJ, 125, 984
- Nenkova et al. (2002) Nenkova, M., Ivezić, Ž., & Elitzur, M. 2002, ApJ, 570, L9
- Oke (1990) Oke, J. B. 1990, AJ, 99, 1621
- Oke et al. (1995) Oke, J. B., Cohen, J. G., Carr, M., Cromer, J., Dingizian, A., Harris, F. H., Labrecque, S., Lucinio, R., Schaal, W., Epps, H., & Miller, J. 1995, PASP, 107, 375
- Padmanabhan (2002) Padmanabhan, T. 2002, Theoretical Astrophysics, Volume III: Galaxies and Cosmology (Theoretical Astrophysics, Volume III: Galaxies and Cosmology, by T. Padmanabhan. Theoretical Astrophysics, 2002, 638 pp.)
- Palunas et al. (2004) Palunas, P., Teplitz, H. I., Francis, P. J., Williger, G. M., & Woodgate, B. E. 2004, ApJ, 602, 545
- Papovich et al. (2001) Papovich, C., Dickinson, M., & Ferguson, H. C. 2001, ApJ, 559, 620
- Pentericci et al. (2000) Pentericci, L., Kurk, J. D., Röttgering, H. J. A., Miley, G. K., van Breugel, W., Carilli, C. L., Ford, H., Heckman, T., McCarthy, P., & Moorwood, A. 2000, A&A, 361, L25
- Pentericci et al. (1997) Pentericci, L., Röttgering, H. J. A., Miley, G. K., Carilli, C. L., & McCarthy, P. 1997, A&A, 326, 580
- Pier & Krolik (1992) Pier, E. A., & Krolik, J. H. 1992, ApJ, 401, 99
- Reuland et al. (2003) Reuland, M., van Breugel, W., Röttgering, H., de Vries, W., Stanford, S. A., Dey, A., Lacy, M., Bland-Hawthorn, J., Dopita, M., & Miley, G. 2003, ApJ, 592, 755
- Rieke et al. (2004) Rieke, G. H., Young, E. T., Engelbracht, C. W., Kelly, D. M., Low, F. J., Haller, E. E., Beeman, J. W., Gordon, K. D., Stansberry, J. A., Misselt, K. A., Cadien, J., Morrison, J. E., Rivlis, G., Latter, W. B., Noriega-Crespo, A., Padgett, D. L., Stapelfeldt, K. R., Hines, D. C., Egami, E., Muzerolle, J., Alonso-Herrero, A., Blaylock, M., Dole, H., Hinz, J. L., Le Floc’h, E., Papovich, C., Pérez-González, P. G., Smith, P. S., Su, K. Y. L., Bennett, L., Frayer, D. T., Henderson, D., Lu, N., Masci, F., Pesenson, M., Rebull, L., Rho, J., Keene, J., Stolovy, S., Wachter, S., Wheaton, W., Werner, M. W., & Richards, P. L. 2004, ApJS, 154, 25
- Schaerer (2002) Schaerer, D. 2002, A&A, 382, 28
- Schaerer (2003) —. 2003, A&A, 397, 527
- Shapiro (2005) Shapiro, S. L. 2005, ApJ, 620, 59
- Shapley et al. (2003) Shapley, A. E., Steidel, C. C., Pettini, M., & Adelberger, K. L. 2003, ApJ, 588, 65
- Silva et al. (1998) Silva, L., Granato, G. L., Bressan, A., & Danese, L. 1998, ApJ, 509, 103
- Spoon et al. (2004) Spoon, H. W. W., Moorwood, A. F. M., Lutz, D., Tielens, A. G. G. M., Siebenmorgen, R., & Keane, J. V. 2004, A&A, 414, 873
- Steidel et al. (2000) Steidel, C. C., Adelberger, K. L., Shapley, A. E., Pettini, M., Dickinson, M., & Giavalisco, M. 2000, ApJ, 532, 170
- Steidel et al. (2003) —. 2003, ApJ, 592, 728
- Stern et al. (2005) Stern, D., Eisenhardt, P., Gorjian, V., Kochanek, C. S., Eisenstein, D., Brodwin, M., I., B. M. J., Caldwell, N., Cool, R., Dey, A., Green, P., Jannuzi, B. T., Murray, S. S., Pahre, M. A., & Willner, S. P. 2005, ApJ, XXX
- Stone (1977) Stone, R. P. S. 1977, ApJ, 218, 767
- Storey & Hummer (1995) Storey, P. J., & Hummer, D. G. 1995, MNRAS, 272, 41
- Sutherland & Dopita (1993) Sutherland, R. S., & Dopita, M. A. 1993, ApJS, 88, 253
- Taniguchi & Shioya (2000) Taniguchi, Y., & Shioya, Y. 2000, ApJ, 532, L13
- van Ojik et al. (1997) van Ojik, R., Röttgering, H. J. A., Miley, G. K., & Hunstead, R. W. 1997, A&A, 317, 358
- Villar-Martín et al. (2003) Villar-Martín, M., Vernet, J., di Serego Alighieri, S., Fosbury, R., Humphrey, A., & Pentericci, L. 2003, MNRAS, 346, 273
- Villar-Martín et al. (2002) Villar-Martín, M., Vernet, J., di Serego Alighieri, S., Fosbury, R., Pentericci, L., Cohen, M., Goodrich, R., & Humphrey, A. 2002, MNRAS, 336, 436
- Yoo & Miralda-Escudé (2004) Yoo, J., & Miralda-Escudé, J. 2004, ApJ, 614, L25
- Zirm et al. (2003) Zirm, A. W., Dickinson, M., & Dey, A. 2003, ApJ, 585, 90