Oxygen and neon abundances of planetary nebulae in the elliptical galaxy NGC 4697111 Part of the data presented herein were obtained at the European Southern observatory, Chile, Program ESO 69.B-0124. Part of the data presented herein were obtained at the W.M. Keck Observatory, which is operated as a scientific partnership among the California Institute of Technology, the University of California and the National Aeronautics and Space Administration. The Observatory was made possible by the generous financial support of the W.M. Keck Foundation.
Abstract
This paper presents deep spectra of 14 planetary nebulae (PNs) at a variety of angular distances from the center of the flattened elliptical galaxy NGC 4697, which is located at 11 Mpc from us. Both near the center and among the most outlying PNs we have found several examples of very strong [O III] 5007, about 20 times brighter than H. This, together with strong [Ne III] lines, implies a lower limit for O and Ne abundances near solar at the center and also at more than two effective radii from the center of NGC 4697. Thus we have found, for the first time from individual stars, direct evidence of the existence of a metal-rich population in elliptical galaxies, confirming metallicities derived from absorption-line indices and extending the information to angular distances where the stellar surface brightness is too low for absorption-line studies. A comparison with abundances obtained closer to the center of NGC 4697 from integrated absorption-line spectra indicates that the metallicity gradient, which is quite steep within one effective radius, becomes much less pronounced beyond one effective radius. The only alternative to this interpretation would be the presence of a very metal-poor PN population with below , which we cannot rule out but would require an extremely bimodal metallicity distribution with almost no intermediate metallicities.
1 Introduction
How were elliptical galaxies formed, and when did that happen, are matters of intense contemporary discussion. The dominant idea is the hierarchical merging of small galaxies into larger ones, frequently pictured as a long process extending down to small redshifts (White & Rees 1978).
In this context, metallicity gradients in elliptical galaxies are important diagnostics. A monolithic dissipative collapse produces steep gradients (Carlberg 1984), and mergers dilute them (White 1980). Observations show that metallicity gradients are present in early-type galaxies (Davies, Sadler & Peletier 1993; Carollo & Danziger 1994; Fisher, Franx, & Illingworth 1995; Saglia et al. 2000; Mehlert et al. 2003; Wu et al. 2004), but they appear somewhat flatter than predicted by the pure dissipational collapse (Carlberg 1984), which suggests that both dissipative processes and mergers play a role. Kobayashi (2004) gives a recent review on the subject, concluding that the observed variety of metallicity gradients requires different individual merging histories, with steeper gradients for galaxies that have not undergone major mergers. Simulations of monolithic collapse models taking into account different escape velocities at different galactocentric radii produce results that are consistent with observed absorption line index gradients inside effective radius (Martinelli et al. 1998, Angeletti & Giannone 2003). But they predict a significant steepening beyond that limit, which still needs to be checked observationally.
On the other hand, how reliable are the observed metallicity gradients? They are based on colors and absorption-line strengths (Mg, Fe, H) measured on long-slit, integrated-light spectra of the galaxies. Their interpretation in terms of metallicity is affected by the well-known age-metallicity degeneracy. The introduction of Balmer lines to break the degeneracy does not necessarily solve the problem, because strong Balmer lines can be produced not only by young stars, but also by blue horizontal-branch stars (de Freitas Pacheco & Barbuy 1995; Maraston & Thomas 2000; Lee, Yoon, & Lee 2000). There is also the complication introduced by possible variations in the /Fe abundance ratio, which may affect the derived gradients (Trager et al. 2000a; Proctor & Sansom 2002; Thomas, Maraston & Bender 2003). All these obstacles introduce uncertainties in the derived ages, metallicities and metallicity gradients. It would be desirable to determine metallicities of individual stars in elliptical galaxies. Single stars, however, are too faint and cannot be resolved with current technology, with the only exception of the nearby NGC 5128 (e.g. Harris & Harris 2002).
Planetary nebulae (PNs) in elliptical galaxies offer a possible way to obtain alternative information: we can detect them individually because of their characteristic emission-line spectra. By measuring the fluxes of adequate diagnostic emission lines, it would be possible to derive at least O and Ne abundances of PNs at different projected radii to directly study the metallicity gradient. In this way we would be able to circumvent the problem of the age-metallicity degeneracy. Forestini & Charbonnel (1997) explain that no significant change in surface O, Ne abundances is expected from Asymptotic Giant Branch nucleosynthesis. An additional important advantage of measuring PN element abundances is the ability to cover a considerably larger range in projected radii. Because of the dramatic drop in surface brightness with increasing radius, the derivation of metallicities from the diffuse light extends to at most 1.5 effective radii , whereas PNs can be easily detected out to .
There is one problem, however: the best diagnostic lines, like [O III] 4363 or [S II] 6717, 6731, are very faint. One pioneering attempt to study a few PNs in NGC 5128 with the ESO 3.6m telescope was not fully successful, in the sense that no accurate estimates of electron temperatures and electron densities could be obtained (Walsh et al. 1999). In addition, the fact that NGC 5128 has suffered a recent merger with a low-metallicity galaxy complicated the interpretation of the few PN abundance estimates obtained by those authors.
This kind of project clearly requires the light-collecting power of (at least) 8-10m telescopes. Having decided to explore the PN approach to abundances in ellipticals, we chose to avoid the very tempting NGC 5128 and selected instead NGC 4697, a flattened elliptical at a distance of about 11 Mpc. Closer to us than the Virgo or Fornax ellipticals, with , NGC 4697 is of intermediate size and luminosity. It belongs to a loose group of 18 galaxies (García 1993). It shows a relaxed structure but has a small dust ring near the core that may be evidence of a past merger (Pinkney et al. 2003). Earlier metallicity determinations (Kobayashi & Arimoto 1999; Trager et al. 2000b; Thomas et al. 2005) indicate a central [/H] slightly above solar, and a relatively steep negative gradient.
Our choice of NGC 4697 was strongly influenced by the fact that we had already found more than 500 PNs in this galaxy (Méndez et al. 2001). Knowing the fluxes of the brightest PNs in [O III] 5007 we could estimate that we had a realistic chance of detecting [O III] 4363, which is a factor 100 weaker than 5007 for PN electron temperatures of about 12,000 K.
This paper is organized in the following way: in Section 2 we present new observations of absorption-line strengths from long-slit spectra of NGC 4697, analyzed with modern techniques to try to refine our knowledge of the metallicity gradient determined in the classical way. Then we introduce the PN observations. Section 3 describes the PN selection in NGC 4697 from our previous work, and the VLT FORS observations and reductions of PN spectra. Section 4 describes in a similar way the complementary Keck I LRIS-B spectra of the same PNs. Section 5 describes the resulting line intensities and section 6 the analysis technique. It turns out that we could not detect [O III] 4363 in the individual PN spectra, but somewhat accidentally we can infer interesting limits on the O and Ne abundances in PNs at different angular distances from the center of NGC 4697. Section 7 presents a discussion of the results and what constraints can be derived from them. Section 8 provides a summary of the conclusions and some perspectives for future work.
2 Absorption-line studies: long-slit spectroscopy
2.1 Observations
We obtained long-slit spectroscopy along the major and minor axes of NGC 4697 using the second Focal Reducer and Spectrograph (FORS2) at the Cassegrain focus of Unit Telescope 2 (UT2) of the ESO Very Large Telescope, Cerro Paranal, Chile, on the nights of 2001 February 27/28 and Feb 28 / March 1, under cloudy sky conditions, with 1-1.5 arcsec seeing.
FORS2 with the standard collimator gives a field of 6.86.8 arc min on a 20802048 CCD (pixel size 2424 m). The image scale is 0.2 arc sec pix-1. The observing mode was long-slit spectroscopy using grism 1400V+18. This grism gives a spectral resolution of 2.5 Å, equivalent to km s-1, for slits 1 arcsec wide (see the FORS Manual, version 2.0). The spectral coverage was from 4770 to 5700 Å. We integrated a total of 7228 sec along the major axis and 3600 sec along the minor axis of NGC 4697. In addition, we acquired spectra of the star HR 3428 at several positions along the slit to be used as kinematic templates.
The data reduction was made using MIDAS and followed the usual steps: after bias subtraction and flatfielding with dome flats, cosmic rays were eliminated using median filtering. The wavelenght calibration was based on HeArHgCd lamps and gave 0.2 Å rms residuals. After rebinning on a natural logarithmic wavelength scale, the sky measured at the ends of the slit was subtracted and the galaxy spectra were rebinned along the spatial direction to obtain nearly constant signal-to-noise ratio with radius.
We postpone a discussion of the kinematics to a future paper, where we plan to combine the long-slit spectral information with the PN kinematics.
2.2 Absorption line indices
We have measured the Lick absorption line indices , , Fe5270, and Fe5335 following the definitions of Worthey et al. (1994). The spectra have been smoothed to Lick spectral resolution (Å FWHM). Corrections for the velocity dispersion broadening have been applied, as described in Mehlert et al. (2000). Errors were derived from Monte Carlo simulations, taking into account the Poisson noise and the errors in the kinematics. Within the central aperture of 1/8 of the effective radius our measurements agree very well with the measurements of González (1993). Our measurements and derived quantities are listed in Tables 1 and 2 (major and minor axes, respectively).
Fig. 1 shows the strengths of the line indices , , and , as a function of distance from the center of NGC 4697, along the major and minor axes.
We detect weak [O III] emission at several radii (particularly at to arcsec along the major axis, where H Å), but we do not attempt any correction. In the central region, where a kinematically distinct disk is dominant, there is a sharp decrease of H, together with a sharp increase of and .
Fig. 2 shows the absorption line index measurements in a different way. We introduce . The index , a slight modification of [MgFe] defined by González (1993), is a good tracer of total metallicity (still degenerate with age, of course), as it is almost completely independent of ratio variations (Thomas, Maraston, & Bender 2003, hereafter TMB03). We have plotted vs. (left panel) and vs. (right panel). Overplotted are the stellar population models of TMB03 for various ages, metallicities, and ratios as indicated by the labels in the diagrams. Since also is almost insensitive to (TMB03), the left panel of Fig. 2 is well suited to reading off ages and total metallicities independent of abundance ratio effects. The right panel of Fig. 2 provides rough estimates for the ratios. The different symbols in Fig. 2 correspond to quantities along the major and minor axes. The position of the galaxy’s center is indicated by the arrow. Measurement errors do not exceed the symbol sizes. The - plot shows that the average (-luminosity weighted) ages of the stellar populations in NGC 4697 scatter about Gyr with no significant dependence on galaxy radius, while metallicities clearly vary between about 2 and 1/2 solar. The ratios are about 1.5 solar with a slight tendency to higher values in the outer parts of the galaxy. The two radial directions are consistent. The apparently older ages above Gyr at large positive radii (diamonds) are most likely not real, and probably an artifact caused by emission-line filling of the absorption line.
2.3 Stellar population parameters
The explicit gradients are shown in Fig. 3, in which the stellar population parameters age, total metallicity, and ratio are plotted as functions of galactic radius (see also Table 1). The former are derived from the indices of Fig. 2 in a twofold iterative procedure. First, we arbitrarily fix the ratio, and determine ages and metallicities for the index pairs (,) and (,), by starting with arbitrary age-metallicity pairs, which we modify iteratively until both index pairs are reproduced. The two metallicities obtained from and , respectively, are used to adjust the ratio, and to start a new iteration. These steps are repeated until the age-metallicity pairs derived from (,) and (,) at a given ratio are consistent within 1 per cent accuracy. For ages and metallicities between the grid points quoted above, we interpolate linearly.
Fig. 3 shows only a very small radial gradient in age, with ages around Gyr in the center (in good agreement with Kobayashi & Arimoto 1999 and Trager et al. 2000a, 2000b), and Gyr at larger radii. Also the ratio does not vary significantly with galactic radius, hence NGC 4697 appears globally enhanced by about a factor 1.6. This lack of significant gradients in both age and ratio agrees very well with a recent study by Mehlert et al. (2003), in which on average no age and no ratio gradients have been found for a sample of 35 early-type galaxies in the Coma cluster. This lack of age gradients in early-type galaxies gets further support from Wu et al. (2004), who obtained the same result analyzing color gradients of 36 early-type galaxies drawn from the Sloan Digital Sky Survey.
More interesting for the aim of this paper is the metallicity gradient. We obtain central metallicities of about 1.5 solar () at and a relatively steep gradient. As a consequence, the average metallicity of the stellar light in NGC 4697 around the effective radius () at about 100 arcseconds distance from the center is about 2/3 solar (). Extrapolating the average gradient to 2.5 effective radii we would predict or . But the data hint of a saturation at about one effective radius, and extrapolation to higher radii is certainly risky. We conclude that the average stellar metallicity beyond one effective radius, derived from the integrated absorption-line spectra, is at least a factor 1.5 below solar. In the following sections we investigate to what extent these predictions are confirmed by the PN abundances.
3 VLT observations and reductions of PNs in NGC 4697
Reliable PN abundance determinations require detection of rather weak diagnostic lines like [O III] 4363. In our attempt to detect such faint emission lines, we selected the brightest of the several hundred PNs in NGC 4697 (Méndez et al. 2001) that could be found at different angular distances from the core of the galaxy along a narrow band in the sky so as to ensure adequate spectral coverage for all the targets in multi-slit spectroscopy.
Table 3 provides the coordinates of the 14 selected bright PNs, the angular distance of each PN from the core of the galaxy, as defined by the center of light, and the [O III] 5007 fluxes expressed in magnitudes (5007), as measured by Méndez et al. (2001). Finding charts for the 14 PNs are given in the Appendix. Fig. 4 shows schematically the positions of the 14 PNs relative to the core of NGC 4697. The size and orientation of Fig. 4 imitate Fig. 7 in Méndez et al. (2001). The effective radius of NGC 4697 is 95 arc seconds (Binney, Davies & Illingworth 1990).
The VLT observations were made with the first Focal Reducer and low-dispersion Spectrograph (FORS1) at the Cassegrain focus of Unit Telescope 3 (Melipal) of the ESO Very Large Telescope, Cerro Paranal, Chile, on the nights of 2002 April 15/16, 16/17 and 17/18. FORS1, with the standard collimator, gives a field of 6.86.8 arc min on a 20802048 CCD (pixel size 2424 m). The image scale is 0.2 arc sec pix-1. The observing mode was multi-object spectroscopy (MOS) using grism 300V and filter gg375. This grism gives a spectral resolution of about 10 Å at 5000 Å, for slits 1 arc sec wide.
The slit positions for the selected PNs were determined from direct inspection of the discovery image, a combination of narrow-band exposures taken with FORS1. This spectrograph allows to define 19 slits per exposure; 14 slits were given to our PN targets, and the rest were assigned to faint foreground stars to check the slit positioning (which was done by taking short exposures without grism through the slits) and to help locate the dispersion lines as a function of position across the field (which is important in the case of spectra consisting of isolated emission lines).
All three nights were of photometric quality, with seeing of about 1.1 arc sec on the first night, 0.6 and 0.8 arc sec on the second and third. We were able to complete 23 MOS exposures, each with an exposure time of 3000 seconds, all of them at air masses smaller than 1.6. Two additional exposures during the third night were stopped at exposure times of about 1500 seconds (tracking problems), and 1800 seconds (near the end of the night, because the air mass was becoming ). We also took many spectra of the spectrophotometric standard stars LTT 3218, LTT 7379, CD-32 9927 (Hamuy et al. 1992), with typical exposure times between 10 and 30 seconds.
Note that this spectrograph is used in combination with an atmospheric dispersion compensator in front of the Cassegrain focus.
The reductions were made using IRAF222IRAF is distributed by the National Optical Astronomical Observatories, operated by the Association of Universities for Research in Astronomy, Inc., under contract to the National Science Foundation standard tasks. After bias subtraction we carefully built a normalized flat field (IRAF tasks “response”, “illum” applied separately to each of the 19 individual slits), where all pixels without a useful lamp signal were set equal to 1. All the science exposures were divided by this normalized flat field.
Given the mechanical stability of FORS1 we decided to register (IRAF task “imshift”) the science exposures, using the strong [O III] 4959, 5007 emissions, visible in all individual exposures, as our reference points. The images were then combined, assigning weights proportional to the strength of [O III] 5007. The image combination helped to eliminate cosmic ray events, and the increased signal allowed an easier control of the spectrum extractions.
In spectroscopy of extremely faint emission-line objects the most delicate step is the background modeling and subtraction. Especially in our case, because the galaxy stellar light contributes a non-uniform background. Fortunately NGC 4697 shows a rather smooth surface brightness distribution, which makes background modeling easier. The only complication was the occasional foreground star falling partly or completely on the slit. Even in such cases the rather long slits provided by FORS1 (20 arc seconds) made it possible to model the continuum and subtract it using the IRAF task “apall”. In some particularly difficult cases, close to the galaxy core, we tried to use the long-slit task “background” for an alternative background subtraction, but the results were not significantly different from what is produced by “apall”.
The wavelength calibration was done using He-Ar-Hg comparison spectra. Standard star spectra were used for the flux calibration. Since we had combined all the science exposures, we used the following procedure: first, we took an individual MOS science exposure, taken in very good seeing at the same air mass as a standard spectrum, and compared the flux of the standard star with the flux of the control stars in some of the 19 FORS1 slits, used to check the slit positioning. This flux calibration, being performed at the same air mass, needs no atmospheric extinction correction.
Second, we compared the flux of the “control stars” in the individual science exposure with the corresponding flux in the combined science exposure; this comparison provides a correction factor as a function of wavelength, which takes care of atmospheric extinction and also of possible wavelength-dependent slit losses. The correction factors derived from control stars in different slits across the CCD (specifically slits 5, 14 and 16) were similar, and therefore we averaged them, to obtain a final correction factor which we applied to all the PN slits. Having obtained the flux calibrated spectra, the emission lines were shifted to the rest wavelengths and the final fluxes in erg cm-2 s-1 were obtained by integrating the emission lines over wavelength.
Initial inspection of the final reduced spectra showed many PNs with [O III] 5007 almost 20 times as strong as H. This is rather unusual in nearby galaxies with lower-than-solar metallicities like the LMC and SMC; see e.g. the histogram in Fig. 3 of Méndez & Soffner (1997). The only similar case with high frequency of very strong 5007 appears to be the sample observed by Richer, Stasinska & McCall (1999) in the metal-rich bulge of M 31.
We did not get any convincing detection of [O III] 4363 on individual spectra. The UV response of FORS1 was not enough for reliable measurements of [Ne III]3868, 3967. And of course we could not detect [O II] 3727. For all these reasons we judged convenient to complement the FORS1 spectra with spectra taken with the new blue camera of LRIS, the Keck low-resolution imaging spectrometer. These spectra are described in next sectiom.
4 Keck observations and reductions of PNs in NGC 4697
Knowing the coordinates of the PNs, we used the software “autoslit3” to produce files for the LRIS slitmask mill machine and the slitmask alignment program. The slit mask allowed to reobserve the same PNs observed with FORS1. Some slits were assigned to control stars, like we did with FORS1. The Keck I, LRIS-B observations were made on the night of 2003 April 2/3. LRIS-B gives an 8 arc min field on a mosaic of two 2k4k CCDs (pixel size 1515 m). The image scale is 0.135 arcsec pix-1. The observing mode was multi-object spectroscopy (MOS) using dichroic filter D680 and grism 400/3400. This grism gives a spectral resolution of about 2 Å at 5000 Å, for slits 1 arc sec wide.
The night was clear and of photometric quality, with seeing from 1 to 0.8 arcsec. We completed 11 MOS exposures, each with an exposure time of 1800 seconds, all of them at air masses smaller than 1.6 except the last one, with an air mass near 2. We also took spectra of the spectrophotometric standard star G193-74 (Oke 1990), with exposure times of 150 and 300 seconds.
The LRIS-B spectrograph does not have an atmospheric dispersion compensator. In this case we took the standard star spectra through the same mask used for the PN spectra and at a low air mass. By comparing to a science exposure also taken at a similarly low air mass, the effect of atmospheric dispersion is minimized. Other science exposures, taken mostly at higher air masses, were corrected using the control stars, as described in the previous section.
The spectra were reduced in a similar way as already described for FORS1. The only difference is that we made individual extractions for each exposure. We did this extra work because LRIS suffers mechanical deformations that result in image shifts of several pixels as the telescope moves away from the meridian; there was no easy way of registering the science exposures for combination. This also forced us to spend some time carefully eliminating cosmic ray events from the individual frames. After extraction, wavelength calibration, extinction correction, flux calibration and reduction to rest wavelengths, all spectra for each slit were combined, assigning weights proportional to the strength of [O III] 5007. The final fluxes in erg cm-2 s-1 were obtained by integrating the emission lines over wavelength. For comparison with the FORS1 spectra, the higher-resolution LRIS-B spectra were smoothed with a boxcar=7.
5 Results
It was reassuring to find that, for each PN, the FORS1 and LRIS-B spectra are in good agreement in the wavelength range where they can be compared. The visible emission lines in that range are H, [O III] 4959, 5007, and H. Figs. 5 to 7 show the comparison of FORS1 vs. LRIS-B spectra. PN1 was not seen by FORS1; it fell outside the end of the first slit. Some LRIS-B spectra did not reach H because of the PN positions in the field (our fault). The LRIS-B spectra confirm that many PNs in our sample have very strong 5007/H ratios, and provide clear detection of [Ne III] in most PNs, as shown in Fig. 8; [O II] 3727 is not visible, except very probably in PN 5.
Tables 4 and 5 show the measured relative intensities, in the scale H=1, calculated in the following way: first calculate the intensity relative to 5007, which is the strongest and most reliable line; then average if two measurements are available; then multiply by the ratio 5007/H. No correction for reddening has been applied.
We consider first the ratio H/H. In most cases it is consistent with zero or small reddening. The foreground reddening produced by our Galaxy is (see Méndez et al. 2001) and NGC 4697 shows no evidence of interstellar reddening, except for the dust disk very close to the center. This leads us to expect a H intensity of about 0.47, marginally detectable in individual PN spectra. In order to improve the signal we averaged all the PN spectra taken with both spectrographs from 4200 to 5100 Å. Fig. 9 shows the resulting composite spectrum, where H is indeed visible with the expected intensity. Also, at the limit of detection lies a weak [O III] 4363. If we take its intensity as an upper limit for 4363, its relation to 4959 and 5007 permits to establish an upper limit for the nebular electron temperature. We measure a ratio (4959+5007)/4363 of the order of 120; from the Osterbrock (1989) textbook we obtain K. We cannot apply this result to any individual nebula, but we can argue that no PN in our sample has a very high , because 4363 is not visible in any individual spectrum, and that for any PN with slightly higher than 12000 K there must be a few with fainter 4363 and therefore with lower than 12000 K.
In Fig. 9 we also measure the average ratio 5007/H, which turns out to be 16. This is a very large value, if we compare with what is observed throughout the Local Group. The only case we know with a similarly high average ratio is the M 31 bulge sample of Richer, Stasinska & McCall (1999). Let us discuss our result more carefully. Is it possible that we are being misled by a faint H absorption component in the background light, which would induce a fainter H emission? We do not think so, for two reasons: first, the effect would be even stronger for H; although we admit that one could imagine high internal reddening in some PNs. But second, and most important, many PNs with very strong 5007 are in the outskirts of the galaxy, where there is no significant background. In fact Tables 4 and 5 show that the strong 5007 is more frequent outside than inside, which is contrary to what we would expect if such a background contamination were playing a role.
Note also that the largest source of uncertainty in our measurements is the determination of the zero intensity level. Given the increase in signal to noise provided by the addition of all the spectra, to find such a large average ratio of 5007/H confirms that for some PNs the individual ratio must be larger than the average, because we see in Tables 4 and 5 some cases of ratios below the average (those are easier to believe because H is stronger and therefore more reliably measured). For all these reasons we believe the existence of these high ratios of 5007/H is well established and we must try to explain it.
Fig. 10 shows the average of all the LRIS-B spectra between 3700 and 4200 Å. It shows prominently [Ne III] 3868, 3967, with the expected relative intensities, as well as a weak H, also with the expected intensity. But [O II] 3727 is not clearly present. In fact most of the signal at 3727 is provided by only one of our sources, namely PN 5 (see Fig. 8). Note in Table 4 that PN 5 has the lowest intensity of 5007, which makes sense; a stronger 3727 and weaker 5007 clearly indicate a lower excitation class.
6 Analysis
Since we cannot detect [O III] 4363 in the individual spectra, and we also lack electron density diagnostics, we cannot make nebular abundance determinations in the normal way. However, we have found many examples of very high ratios 5007/H, and we will derive lower limits for the abundances of those PNs. That this is possible can be seen e.g. in Fig. 3 of Dopita, Jacoby & Vassiliadis (1992), which shows the ratio 5007/H as a function of abundance and stellar effective temperature. Any PN with 5007/H 18 must have a metallicity near solar. We can illustrate this conclusion in more detail using the CLOUDY code (Ferland et al. 1998). The use of CLOUDY for PN abundance determinations has been very well described by Jacoby & Ciardullo (1999). Here we will simply outline the essential steps in our procedure. In Fig. 11 we show our own version of Dopita et al.’s Fig. 3. From our Fig. 11, built using CLOUDY, it is obvious that given low 5007 intensities we cannot say much about the O abundance. We will start our analysis with the “very strong 5007” PNs in our sample, namely PNs 1, 3, 7, 9, 10, 11, 13, 14.
In our spectra we can set upper limits on the intensities of several important lines relative to H: [O II] 3727 0.4; [O III]4363 0.3; He II 4686 0.2.
These upper limits for faint lines are based on the detectability of stronger lines like H and [Ne III] 3967. For example, H 4340 is barely seen in most PN spectra, at an average intensity of 0.47, while 4363 is not seen in any of them. The average intensity of 4363 on the composite PN spectrum (Fig. 9) is at most 0.18. Therefore we estimate that the upper limit for 4363 cannot be higher than 0.3. In a similar way we estimate upper limits for 4686, 3727 (using in this last case the detectability of [Ne III] 3967 in most PN spectra at 0.6, always relative to H).
Our purpose is to obtain a lower limit to the O and Ne abundances by adjusting several nebular and stellar parameters (nebular density and radius, stellar luminosity and temperature) until we obtain a CLOUDY run whose line intensities reproduce the observed O and Ne lines and do not violate any of the intensity limits we have determined for the weaker lines.
After a few dozen CLOUDY runs we converged to the following solution: a small nebular radius, 0.017 pc, and high electron density, 4 cm-3, both needed to keep 3727 at low intensity; a central star luminosity of at least 7000 (it will be higher if the nebula leaks some H-ionizing photons), required to reproduce the nebular H luminosity, erg s-1, which we know from the distance to NGC 4697 and the 5007 flux (Méndez et al. 2001) plus the 5007/H ratio measured in our spectra; and a stellar temperature not higher than 105 K, in order to keep He II 4686 at low intensity. With these parameters, and assuming that these PNs have typical dust grain contents, CLOUDY confirms that in order to produce 5007 and 3868 intensities of 19 and 1.9, respectively, we need O and Ne abundances of 8.60 and 7.88, in the usual logarithmic scale where H=12. Lowering the central star temperature or the nebular density (if we allow for a stronger 3727) would require to increase the abundances. A hotter star, apart from producing a too strong 4686, would also require higher abundances. Therefore we are confident that the O and Ne abundances we derived are lower limits. We show this in Table 6, where we list a selection of CLOUDY runs illustrating the effects of departing from the chosen values of central star surface temperature, nebular density and nebular radius (the last two parameters have no significant influence on the abundances).
The objects PN1 and PN3 have a 5007/H ratio of 22; in this case the lower limit to the O abundance is 8.75.
Now we consider O abundances in PNs 2, 4, 5, 6, 8, 12. A weak 5007 is not inconsistent with metallicities higher than solar (see e.g. our Fig. 11, or Fig. 3 in Dopita, Jacoby & Vassiliadis 1992). Therefore we cannot set any upper limit. On the other hand, we know that none of these PNs has a very high , because we could not detect [O III] 4363 in individual spectra. This rules out very low O abundances, but we cannot exclude values around 8.2. So we set that number as a lower limit for the six PNs with weaker 5007. These six PNs will not provide stronger constraints until we can detect, in their individual spectra, the diagnostic lines required for accurate abundance determinations.
7 Interpretation of the O and Ne abundances from PNs
7.1 Comparison with the absorption-line data
Fig. 12 shows the abundance limits derived from the PNs, together with the absorption-line information presented previously in Fig. 3. The absorption-line abundance gradient is derived in total metallicity, which is dominated by the “alpha” elements. More specifically, the contribution of iron-peak elements to the total metallicity is about 10-15%, while alpha-elements, including oxygen, contribute more than 70%. In our modelling, is a well-defined quantity and it means real total metallicity, i.e. all elements heavier than helium. Please refer to Thomas, Maraston, & Bender (2003) for more details.
Therefore our nebular O/H should be compared to the in Fig. 3. In addition, we need to specify what is the solar abundance of oxygen. From Lodders (2003) we adopt a solar O abundance 8.7 (logarithmic, in the scale where H=12). Then for example our O abundance 8.6 becomes .
In Fig. 12 we find that at least PNs 1, 3, 7, 9, 10, 11, 13, 14 have higher metallicities than expected from the integrated absorption-line spectra. This is direct evidence of a metal-rich population, both within and beyond one effective radius from the center of NGC 4697. Then we have the six PNs with very low lower limits. If their real abundances were all close to the lower limits, then the distribution would be markedly bimodal. We find this implausible, and we rather expect most of their abundances to lie much closer to the upper PN group in Fig. 12 (which are, please note, also lower limits), perhaps producing an average abundance not very different from what the absorption-line data indicate for . This would require the rather steep metallicity gradient near the core of NGC 4697 to become much less pronounced beyond one effective radius.
However, before declaring the PNs to be representative of the stellar population, we need to discuss if the rather high average PN metallicities can be attributed to a selection effect.
7.2 On selection effects and metallicity distributions
Concerning PNs there is an obvious selection effect: we have restricted our sample to objects populating the high-luminosity end of the PN 5007 luminosity function. Are their O abundances higher than those of fainter PNs? This has been discussed e.g. by Richer (1993), Stasinska, Richer & McCall (1998), Jacoby & Ciardullo (1999), and Magrini et al. (2004).
In theory we expect high O abundance to produce a stronger 5007 emission line. On the other hand, more metallicity could imply more AGB mass loss (e.g. Greggio & Renzini 1990) and a lower central star luminosity, which would then cancel the O abundance effect mentioned earlier. Since our theoretical knowledge of the influence of metallicity on AGB and post-AGB evolution is far from ideal (mostly because we lack a good theory of AGB mass loss processes) it looks safer to rely on the available empirical information: a direct comparison of the average PN abundances in progressively weaker bins along the luminosity function. This can be done only for nearby galaxies, like the Magellanic Clouds or M 31.
The main argument favoring an almost solar metallicity population in the outskirts of NGC 4697 is the fact that we found so many PNs (80% of those beyond one effective radius) with very strong 5007/H. As mentioned before, this happens in only one other place throughout our Local Group: the bulge of M 31 (Richer, Stasinska & McCall 1999). Combining the information given in their Tables 5 and 9 (oxygen abundances and line intensities, respectively, in the bulge of M 31) with the apparent 5007 magnitudes from the discovery paper (Ciardullo et al. 1989) we find for the 16 brightest M 31 bulge PNs that 9 of them, or 56%, have 5007/H 18, and we find that the average oxygen abundance of these 16 PNs is at least 8.70 (there are 4 lower limits).
We can test how important it is to be restricted to the most luminous PNs; taking the total sample of 28 PNs we get an average O abundance of at least 8.64, with 14 lower limits. There does not seem to be a very significant difference. But what happens if we consider even fainter PNs? We turn to Jacoby & Ciardullo’s (1999) analysis of the M 31 PNs. First, their Fig. 6 shows that across one order of magnitude in oxygen abundance, from 8.1 to 9.1, the upper envelope is flat; i.e. a metal-poor PN can be as bright as a metal-rich PN. This is an essential point: if there is a population with LMC or SMC metallicity in NGC 4697, it will produce bright PNs and we will find them (very probably we did, in fact, but we cannot be sure because a low 5007/H admits many possible abundance interpretations).
On the other hand, Jacoby & Ciardullo remark that their fainter M 31 PNs have lower average metallicity. However, they do not conclude that the brighter PNs must overestimate the metallicity; in their Section 4.4.1 they comment that the tendency for fainter PNs to be drawn from a lower-metallicity population may be an artifact of a selection effect or an analysis bias, because there is no physical rationale why metal-rich PNs should not be faint as well as bright.
This interpretation is supported by the fact that the average ”brightest PN” abundance (from the data in Richer, Stasinska & McCall 1999) agrees with another set of data: absorption-line indices yield super-solar metallicities for the integrated stellar population of the M31 bulge (Trager et al. 2000a, 2000b; Thomas et al. 2005). If we expected the brightest PNs to overestimate the M31 bulge metallicity, then we would expect the M 31 integrated light to indicate a lower average metallicity. Since that does not happen, Jacoby and Ciardullo feel that they need to explain why their sample has so few metal-rich objects, coming from a metal-rich population. The brighter Richer et al. sample does not have that problem.
Coming back to NGC 4697, we still have to discuss another possibility, involving now a very low metallicity. Consider the study by Richer (1993) of the LMC and SMC PNs. In his Fig. 2 we find that the more metal-rich objects are brighter; not by much initially, but the difference becomes important when we reach oxygen abundances below 8.0. Then, if there were many very-metal-poor PNs in the outskirts of NGC 4697, they would be fainter and not detectable in our flux-limited sample. But then we would be talking about a peak in below , and therefore about an extremely bimodal metallicity distribution. A gaussian metallicity distribution (or even a moderately bimodal one, as sometimes observed in globular cluster systems, e.g. Zepf & Ashman 1993; Gebhardt & Kissler-Patig 1999) extending that far down in metallicity would require a lot of LMC- and SMC-like PNs, which we would detect, as argued above, so that the frequency of very strong 5007/H values would not be as high as we observe.
Since the observational evidence is not overwhelming, we do not rule out that our bright PNs could have higher by about 0.2 than the stellar population they represent. This would bring the average metallicity, as derived from the PNs, in even better agreement with the long-slit results inside one effective radius. We emphasize, however, that right now there is no compelling theoretical reason nor any evidence in M 31 (the only testing ground we have) indicating that such a systematic difference between PNs and stars must necessarily exist.
But even assuming such a difference, our basic conclusion remains valid: a similar metallicity both inside and outside of one effective radius requires the abundance gradient to become less steep outside. Alternatively, the conceivable existence of a very metal-poor population with below , which we cannot exclude, would require an extremely bimodal metallicity distribution. Let us remark, in closing this discussion, that the metal-rich population represented by our PNs is quite real, while the very metal-poor population must remain hypothetical until confirmed by future observations. The sad fact is that based only on our PN lower limits we cannot estimate how large is the dispersion in abundances. Abundance determinations for fainter PNs in NGC 4697 are probably beyond the reach of currently available instrumentation and may require a 30m telescope.
7.3 Other galaxies
The PNs in NGC 5128 seem to have significantly lower metallicities, well below solar (Walsh et al. 1999). This is consistent with the metallicity distribution in the halo of NGC 5128 derived by Harris & Harris (2002), which indeed does not have a prominent tail of stars with super-solar metallicities. On the other hand the information about PN metallicities in NGC 5128 is still very limited and uncertain; it seems prudent to postpone any further discussion until more and better PN abundances are measured in NGC 5128.
Consider now PNs in the bulge of the Milky Way. Ratag et al. (1992, 1997) derive an oxygen abundance distribution for PNs in our Galactic bulge which, allowing for the lower oxygen solar abundance we favor today, seems consistent with the metallicity distribution of field stars (Zoccali et al. 2002), which peaks near solar metallicity.
Unfortunately it is difficult to build a flux-limited PN sample in the Milky Way bulge, because of the strong reddening and the depth of the bulge. We note that in the Milky Way bulge there are few examples of very high ratios 5007/H (see Ratag 1991), but we will refrain from interpreting this fact.
NGC 4697 does not belong among the most luminous and redder ellipticals. It now becomes interesting to investigate if other elliptical galaxies, particularly the redder ones, show a high frequency of “very strong 5007” PNs. In fact, it would be prudent also to verify what happens on the other side of NGC 4697. This kind of work, requiring only the detection of H, is not so demanding, in terms of big telescope time, as an accurate abundance determination.
8 Summary and perspectives
This paper is a first attempt to use PNs for the determination of individual stellar abundances in elliptical galaxies. For the first time we have taken deep spectra of a relatively large sample of 14 PNs at a variety of angular distances from the center of a typical elliptical galaxy, NGC 4697, located at about 11 Mpc from us. The most important result is the high frequency of PN spectra with very strong 5007/H ratios 20. We argue that such ratios require O abundances near solar, or may be even above solar. The Ne abundances are similarly high. The high O and Ne abundances are direct evidence of the existence of a metal-rich stellar population, confirming in individual stars the high metallicities derived in many cores of elliptical galaxies from absorption-line indices measured on integrated-light, long-slit spectra (e.g. Trager et al. 2000a, 2000b; Thomas et al. 2005). This result also validates the derivation of metallicities in early-type galaxies from the direct comparison with Galactic globular clusters (Maraston et al. 2003).
Perhaps more surprising is the existence of a metal-rich population extending as far as more than two effective radii from the center of NGC 4697. This forces us to conclude that the abundance gradient, which is rather steep within one effective radius, must become much less pronounced outside. The only alternative to this interpretation would be the presence of a very metal-poor PN population with below , which we cannot rule out but would require an extremely bimodal metallicity distribution with almost no intermediate metallicities.
It would now be interesting to verify what is the situation on the other side of NGC 4697, as well as in other elliptical galaxies.
High metallicities in elliptical galaxies imply not very high electron temperatures, and therefore very weak [O III] 4363 intensities, making abundance determinations in the normal way very costly in terms of 10m-class telescope time. However, we have found that the ratio 5007/H can provide important constraints on the abundances and is worth exploring systematically in the many elliptical galaxies where PNs have already been discovered.
We thank the anonymous referee for several useful comments.
Appendix A APPENDIX: finding charts
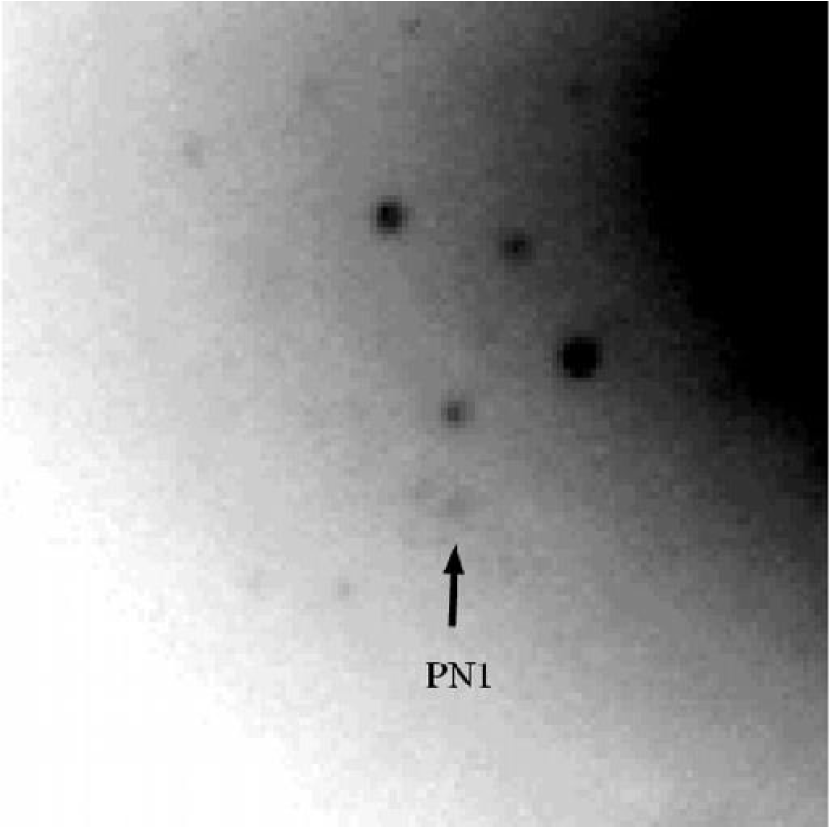
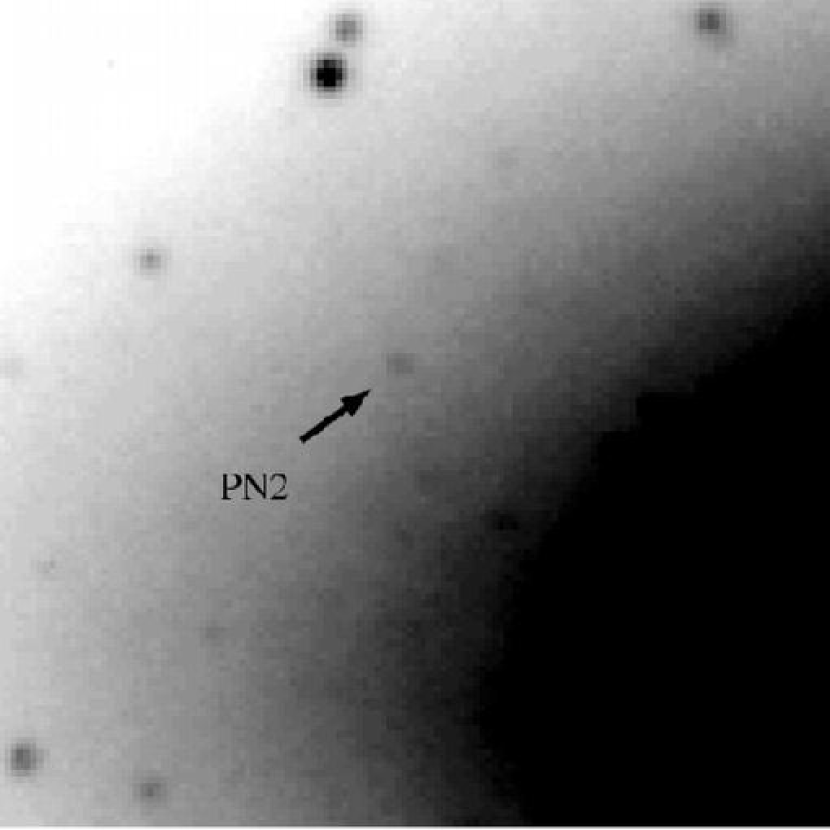
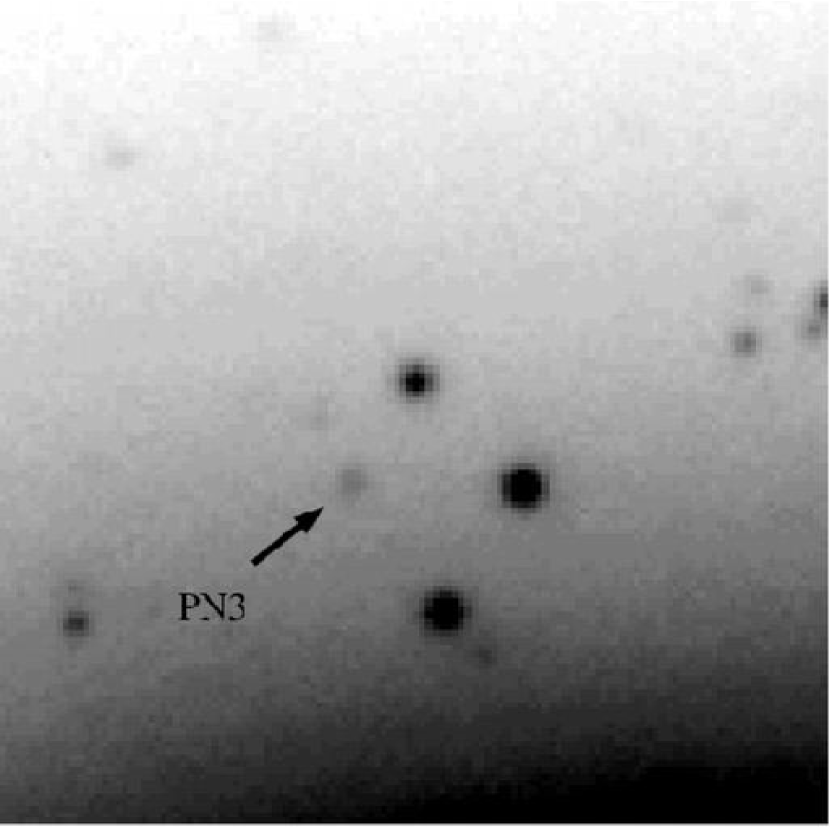
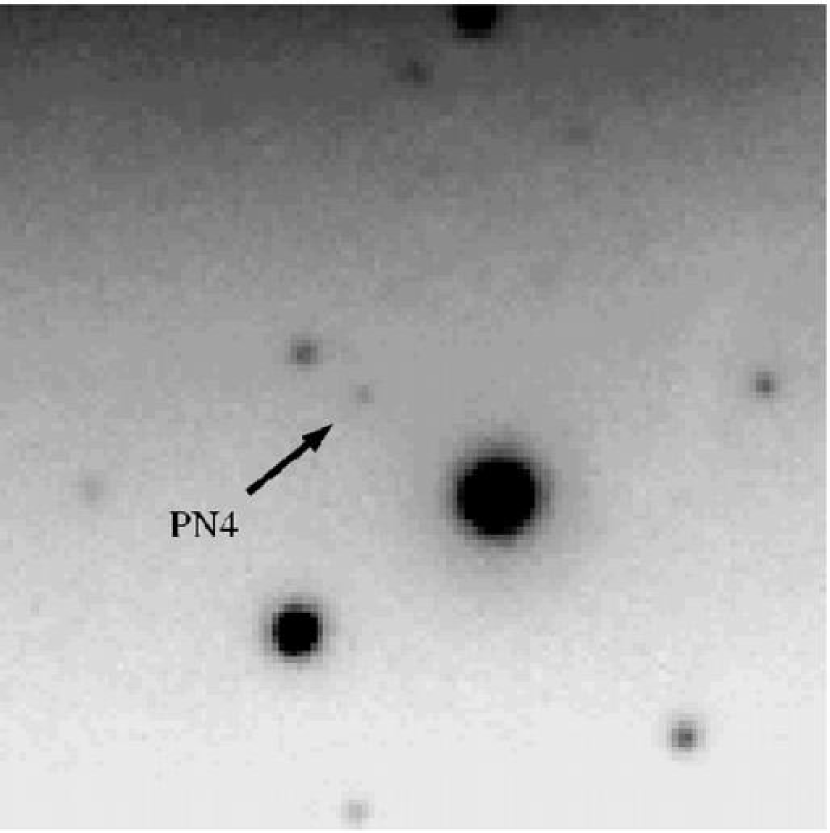
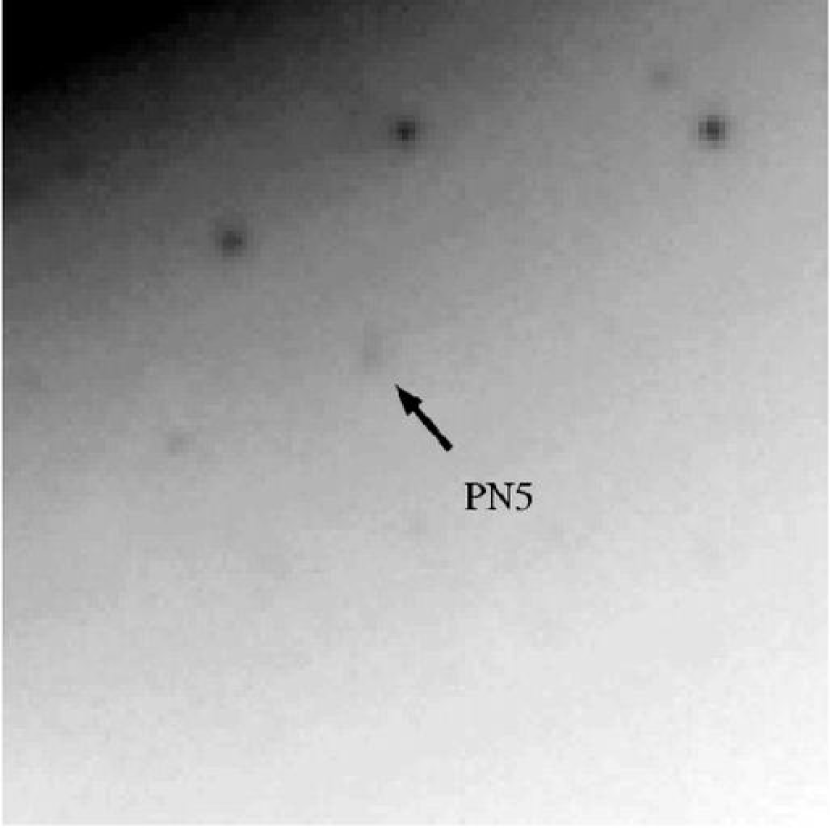
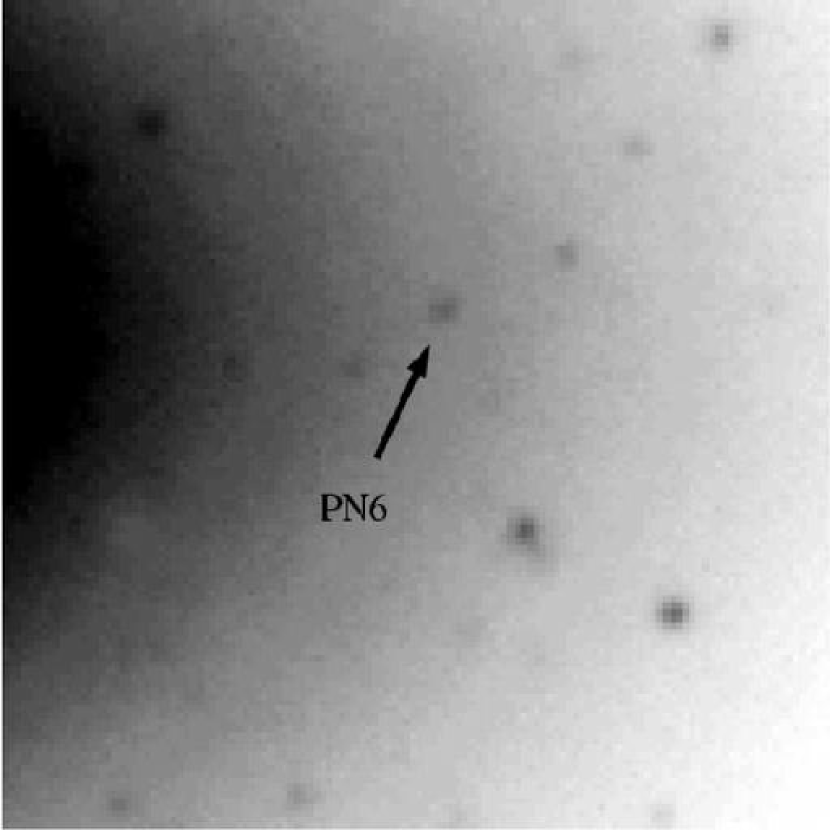
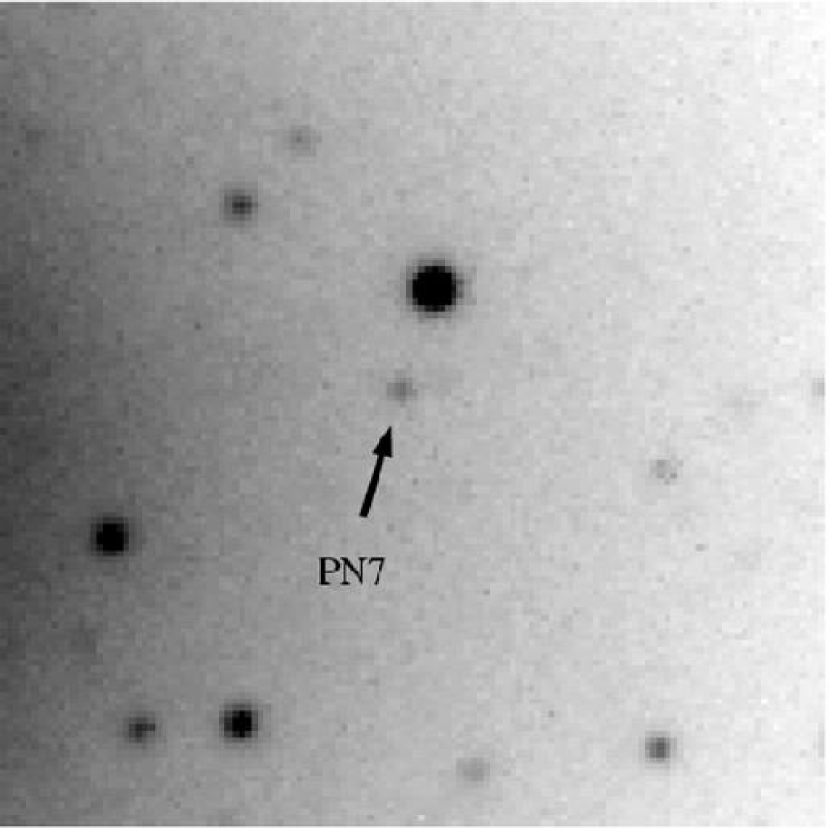
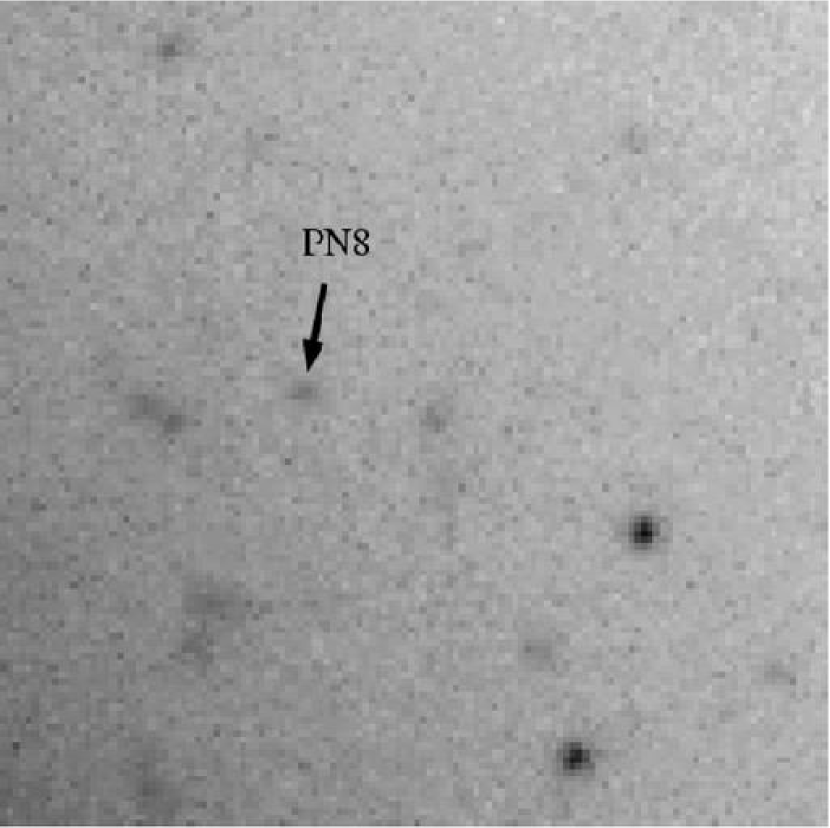
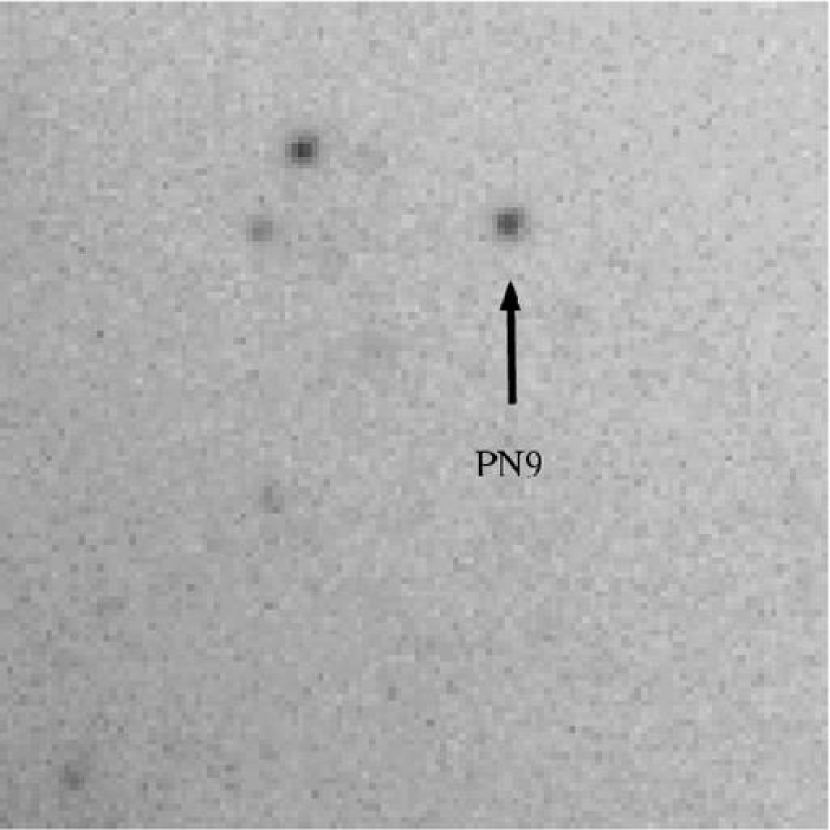
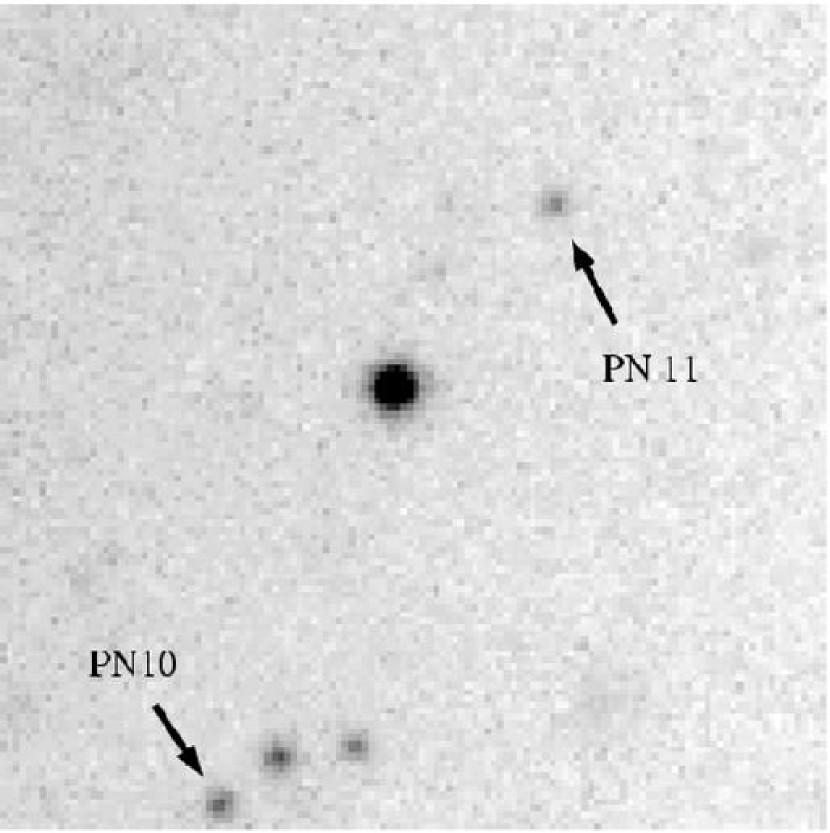
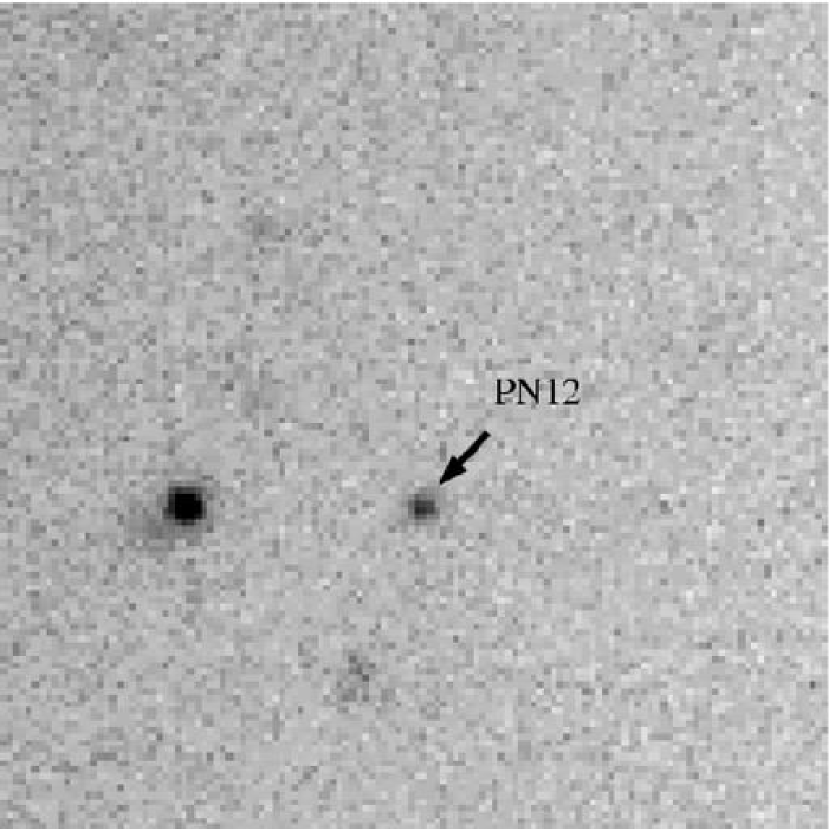
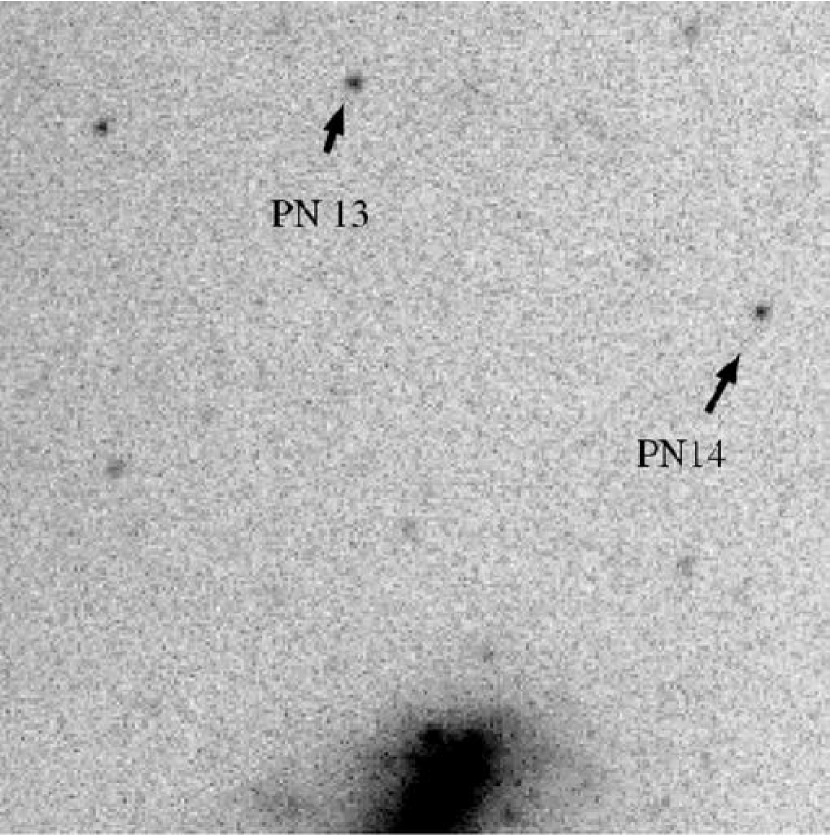
In Figs. 13 and 14 we provide finding charts for the 14 PNs studied in this work, taken from the discovery on-band combined image in Méndez et al. (2001). Each chart is approximately 25 25 arc seconds, with only one exception: the last one, showing PN13 and PN 14, which is 50 50 arc seconds. In all cases the orientation is the same as in Méndez et al. (2001). The North direction is obtained by rotating 24 degrees counterclockwise from the vertical direction.
References
- (1) Angeletti, L., & Giannone, P. 2003, A&A, 403, 449
- (2) Binney, J.J., Davies, R.L., & Illingworth, G.D. 1990, ApJ, 361, 78
- (3) Carlberg, R.G. 1984, ApJ, 286, 416
- (4) Carollo, C.M., & Danziger, I.J. 1994, MNRAS, 270, 523
- (5) Ciardullo, R., Jacoby, G.H., Ford, H.C., & Neill, J.D. 1989, ApJ, 339, 53
- (6) Davies, R.L., Sadler, E.M., & Peletier, R.F. 1993, MNRAS, 262, 650
- (7) de Freitas Pacheco, J.A., & Barbuy, B. 1995, A&A, 302, 718
- (8) Dopita, M.A., Jacoby, G.H., & Vassiliadis, E. 1992, ApJ, 389, 27
- (9) Ferland, G.J., Korista, K.T., Verner, D.A., et al. 1998, PASP, 110, 761
- (10) Fisher, D., Franx, M., & Illingworth, G. 1995, ApJ, 448, 119
- (11) Forestini, M., & Charbonnel, C. 1997, A&AS, 123, 241
- (12) García, A.M. 1993, A&AS, 100, 47
- (13) Gebhardt, K., & Kissler-Patig, M. 1999, AJ, 118, 1526
- (14) González, J.J. 1993, Ph.D. Thesis, Univ. California, Santa Cruz
- (15) Greggio, L., & Renzini, A. 1990, ApJ, 364, 35
- (16) Hamuy, M., Walker, A.R., Suntzeff, N.B. et al. 1992, PASP, 104, 533
- (17) Harris, W.E., & Harris, G.L.H. 2002, AJ, 123, 3108
- (18) Jacoby, G.H., & Ciardullo, R. 1999, ApJ, 515, 169
- (19) Kobayashi, C., & Arimoto, N. 1999, ApJ, 527, 573
- (20) Kobayashi, C. 2004, MNRAS, 347, 740
- (21) Lee, H.C., Yoon, S.J., & Lee, Y.W. 2000, AJ, 120, 998
- (22) Lodders, K. 2003, ApJ, 591, 1220
- (23) Magrini, L., Corradi, R.L.M., Leisy, P. et al. 2004, in “Asymmetric Planetary Nebulae III”, ASP Conf. Series, 313, 42
- (24) Maraston, C., Greggio, L., Renzini, A., et al. 2003, A&A, 400, 823
- (25) Maraston, C., & Thomas, D. 2000, ApJ, 541, 126
- (26) Martinelli, A., Matteucci, F., & Colafrancesco, S. 1998, MNRAS, 298, 42
- (27) Mehlert, D., Saglia, R.P., Bender, R., & Wegner, G. 2000, A&AS, 141, 449
- (28) Mehlert, D., Thomas, D., Saglia, R.P., Bender, R., & Wegner, G. 2003, A&A, 407, 423
- (29) Méndez, R.H., Riffeser, A., Kudritzki, R.P., et al. 2001, ApJ, 563, 135
- (30) Méndez, R.H., & Soffner, T. 1997, A&A, 321, 898
- (31) Oke, J.B. 1990, AJ, 99, 1621
- (32) Osterbrock, D.E. 1989, in “Astrophysics of Gaseous Nebulae and Active Galactic Nuclei”, University Science Books, Mill Valley, California, p. 120
- (33) Pinkney, J., Gebhardt, K., Bender, R. et al. 2003, ApJ, 596, 903
- (34) Proctor, R.N., & Sansom, A.E. 2002, MNRAS, 333, 517
- (35) Ratag, M.A. 1991, Ph.D. Thesis, Univ. of Groningen
- (36) Ratag, M.A., Pottasch, S.R., Dennefeld, M., & Menzies, J.W. 1992, A&A, 255, 255
- (37) Ratag, M.A., Pottasch, S.R., Dennefeld, M., & Menzies, J. 1997, A&AS, 126, 297
- (38) Richer, M.G. 1993, ApJ, 415, 240
- (39) Richer, M.G., Stasinska, G., & McCall, M.L. 1999, A&AS, 135, 203
- (40) Saglia, R.P., Maraston, C., Greggio, L., Bender, R., & Ziegler, B. 2000, A&A, 360, 911
- (41) Stasinska, G., Richer, M.G., & McCall, M.L. 1998, A&A, 336, 667
- (42) Thomas, D., Maraston, C., & Bender, R. 2003, MNRAS, 339, 897
- (43) Thomas, D., Maraston, C., Bender, R. & Mendes de Oliveira, C. 2005, ApJ, 621, 673
- (44) Trager, S.C., Faber, S.M., Worthey, G., & González, J.J. 2000a, AJ, 119, 1645
- (45) Trager, S.C., Faber, S.M., Worthey, G., & González, J.J. 2000b, AJ, 120, 165
- (46) Walsh, J.R., Walton, N.A., Jacoby, G.H., & Peletier, R.F. 1999, A&A, 346, 753
- (47) White, S.D.M. 1980, MNRAS, 191, 1p
- (48) White, S.D.M., & Rees, M.J. 1978, MNRAS, 183, 341
- (49) Worthey, G., Faber, S.M., González, J.J., & Burstein, D. 1994, ApJS, 94, 687
- (50) Wu, H., Shao, Z., Mo, H.J., Xia, X., & Deng, Z. 2004, astro-ph/0404226
- (51) Zepf, S.E., & Ashman, K.M. 1993, MNRAS, 264, 611
- (52) Zoccali, M., Renzini, A., Ortolani, S., et al. 2003, A&A, 399, 931
The strengths of the line indices , and , as a function of the distance in arcsec from the center of the galaxy, along the major (left) and the minor (right) axes of NGC 4697. Filled circles are positive radii; the positive sense is defined towards NE along the major axis, and towards NW along the minor axis.
Lick absorption line indices vs. (left panel) and vs. (right panel). Overplotted are the TMB03 stellar population models for various ages, metallicities, and ratios as indicated by the labels in the diagrams. In the left panel, is solar, while in the right panel the age is fixed to Gyr. Open diamonds and filled squares are along the major and minor axes, respectively.
Stellar population parameters derived from Fig. 2 as functions of galactic radius. The effective radius is at arcsec. Diamonds and plus signs are positive and negative radial directions, respectively, along the major axis.
Positions of the 14 bright PNs relative to the core of NGC 4697. The area and orientation of this figure are as in Fig. 7 of Méndez et al. (2001). The ellipse is a schematic representation of NGC 4697. The origin of coordinates is located at the light center of the galaxy. The effective radius of NGC 4697 is 95 arc seconds.
Comparison of individual PN spectra taken with FORS1 (full lines) and LRIS-B (dotted lines). The PNs are designated with the numbers shown in Fig. 4. The fluxes are expressed in units of 10-18 erg cm-2 s-1 Å-1. The levels of zero intensity are separated by 10 flux units for easier comparison. The higher-resolution LRIS-B spectra have been smoothed with a boxcar=7. PN 1 could not be observed with FORS1.
Comparison of individual PN spectra taken with FORS1 (full lines) and LRIS-B (dotted lines). The PNs are designated with the numbers shown in Fig. 4. The fluxes are expressed in units of 10-18 erg cm-2 s-1 Å-1. The levels of zero intensity are separated by 10 flux units for easier comparison. The higher-resolution LRIS-B spectra have been smoothed with a boxcar=7.
Comparison of individual PN spectra taken with FORS1 (full lines) and LRIS-B (dotted lines). The PNs are designated with the numbers shown in Fig. 4. The fluxes are expressed in units of 10-18 erg cm-2 s-1 Å-1. The levels of zero intensity are separated by 5 flux units for easier comparison. The higher-resolution LRIS-B spectra have been smoothed with a boxcar=7. The feature longward of H 6563 is not [N II] 6584; it is due to residual sky emission. The sky emissions are blueshifted because the PN emission lines have been shifted to their rest values.
Individual LRIS-B PN spectra from 3700 to 4000 Å. The fluxes are expressed in units of 10-18 erg cm-2 s-1 Å-1. The levels of zero intensity are separated by 5 flux units for easier comparison. The visible features are [Ne III] 3868 and (marginally) [Ne III] 3967. PN 5 may show some [O II] 3727.
Average of all spectra of the 14 PNs in NGC 4697. Visible features are H 4340, [O III] 4363, possibly a very weak He II 4686, H 4861, [O III] 4959, 5007.
Average of all LRIS-B spectra of the 14 PNs in NGC 4697. Visible features are [Ne III] 3868, 3967, H 4101.
This is our imitation of Dopita et al.’s Fig. 3 (see text). Our grid was calculated using CLOUDY. The contours give the 5007/ ratio as a function of stellar effective temperature (we assume blackbody energy distributions) and oxygen abundance (logarithmic, in the scale where H=12).
The combined information about metallicity from absorption-line data (diamonds and plus signs as in Fig. 3) and from the PNs (triangles pointing upward indicate lower limits to the abundances) plotted as a function of projected distance to the center of NGC 4697. One effective radius is at .
Finding charts for the PNs studied in this work.
Finding charts for the PNs studied in this work.


| Radius (arcsec) | d | d | d | Age (Gyr) | dAge | [] | d[] | [] | d[] | |||
|---|---|---|---|---|---|---|---|---|---|---|---|---|
| -51.380 | 1.689 | 0.095 | 3.661 | 0.107 | 2.295 | 0.142 | 12.0 | 2.0 | -0.138 | 0.044 | 0.275 | 0.064 |
| -40.370 | 1.688 | 0.065 | 3.691 | 0.073 | 2.221 | 0.099 | 12.3 | 1.4 | -0.153 | 0.034 | 0.319 | 0.052 |
| -32.900 | 1.682 | 0.059 | 3.642 | 0.067 | 2.416 | 0.092 | 11.7 | 1.2 | -0.111 | 0.032 | 0.209 | 0.037 |
| -27.250 | 1.775 | 0.062 | 3.506 | 0.071 | 2.284 | 0.089 | 10.4 | 1.0 | -0.139 | 0.031 | 0.247 | 0.046 |
| -22.770 | 1.739 | 0.053 | 3.810 | 0.060 | 2.336 | 0.076 | 10.7 | 1.0 | -0.080 | 0.029 | 0.272 | 0.040 |
| -19.080 | 1.676 | 0.039 | 3.682 | 0.043 | 2.404 | 0.061 | 11.8 | 1.1 | -0.109 | 0.029 | 0.222 | 0.033 |
| -15.990 | 1.696 | 0.029 | 3.752 | 0.032 | 2.439 | 0.045 | 11.2 | 0.6 | -0.078 | 0.017 | 0.214 | 0.022 |
| -13.510 | 1.726 | 0.028 | 3.902 | 0.031 | 2.398 | 0.044 | 10.7 | 0.5 | -0.051 | 0.017 | 0.253 | 0.023 |
| -11.510 | 1.770 | 0.025 | 3.936 | 0.028 | 2.487 | 0.040 | 9.5 | 0.6 | -0.002 | 0.023 | 0.213 | 0.018 |
| -9.817 | 1.697 | 0.019 | 3.933 | 0.021 | 2.658 | 0.030 | 10.3 | 0.4 | 0.024 | 0.015 | 0.143 | 0.011 |
| -8.321 | 1.651 | 0.021 | 3.946 | 0.024 | 2.655 | 0.034 | 11.2 | 0.4 | 0.002 | 0.017 | 0.144 | 0.013 |
| -7.023 | 1.718 | 0.016 | 4.084 | 0.018 | 2.615 | 0.026 | 9.9 | 0.3 | 0.059 | 0.015 | 0.195 | 0.009 |
| -5.928 | 1.753 | 0.013 | 4.123 | 0.015 | 2.694 | 0.021 | 8.5 | 0.3 | 0.130 | 0.014 | 0.188 | 0.008 |
| -5.032 | 1.757 | 0.016 | 4.140 | 0.018 | 2.759 | 0.026 | 8.1 | 0.4 | 0.164 | 0.015 | 0.173 | 0.009 |
| -4.231 | 1.714 | 0.014 | 4.264 | 0.016 | 2.846 | 0.023 | 8.5 | 0.3 | 0.212 | 0.014 | 0.169 | 0.008 |
| -3.536 | 1.706 | 0.019 | 4.256 | 0.021 | 2.792 | 0.030 | 8.9 | 0.5 | 0.182 | 0.019 | 0.181 | 0.008 |
| -2.936 | 1.599 | 0.015 | 4.355 | 0.017 | 2.841 | 0.025 | 11.0 | 0.4 | 0.160 | 0.016 | 0.173 | 0.009 |
| -2.334 | 1.620 | 0.012 | 4.439 | 0.013 | 2.929 | 0.020 | 10.1 | 0.3 | 0.236 | 0.014 | 0.167 | 0.008 |
| -1.838 | 1.673 | 0.014 | 4.564 | 0.017 | 3.035 | 0.023 | 7.9 | 0.4 | 0.351 | 0.012 | 0.175 | 0.007 |
| -1.437 | 1.702 | 0.012 | 4.569 | 0.014 | 2.949 | 0.019 | 7.7 | 0.3 | 0.334 | 0.012 | 0.204 | 0.006 |
| -1.037 | 1.649 | 0.012 | 4.626 | 0.014 | 2.995 | 0.019 | 8.8 | 0.4 | 0.338 | 0.012 | 0.194 | 0.007 |
| -0.636 | 1.601 | 0.013 | 4.809 | 0.014 | 3.000 | 0.016 | 9.6 | 0.3 | 0.357 | 0.009 | 0.222 | 0.005 |
| -0.341 | 1.550 | 0.015 | 4.850 | 0.015 | 3.025 | 0.018 | 10.6 | 0.4 | 0.345 | 0.013 | 0.216 | 0.006 |
| -0.141 | 1.581 | 0.017 | 4.929 | 0.022 | 3.088 | 0.024 | 9.2 | 0.5 | 0.406 | 0.014 | 0.220 | 0.006 |
| 0.059 | 1.577 | 0.016 | 4.917 | 0.020 | 3.080 | 0.022 | 9.4 | 0.4 | 0.398 | 0.014 | 0.219 | 0.007 |
| 0.259 | 1.561 | 0.014 | 4.954 | 0.016 | 3.080 | 0.018 | 9.7 | 0.4 | 0.396 | 0.011 | 0.224 | 0.006 |
| 0.554 | 1.501 | 0.018 | 4.870 | 0.015 | 3.049 | 0.018 | 11.6 | 0.5 | 0.328 | 0.017 | 0.209 | 0.006 |
| 0.954 | 1.600 | 0.018 | 4.734 | 0.015 | 3.012 | 0.018 | 9.7 | 0.4 | 0.343 | 0.014 | 0.203 | 0.007 |
| 1.355 | 1.505 | 0.016 | 4.635 | 0.017 | 2.957 | 0.022 | 12.3 | 0.4 | 0.226 | 0.015 | 0.189 | 0.007 |
| 1.756 | 1.558 | 0.018 | 4.502 | 0.020 | 2.850 | 0.026 | 11.7 | 0.5 | 0.179 | 0.018 | 0.198 | 0.011 |
| 2.252 | 1.594 | 0.016 | 4.456 | 0.017 | 2.831 | 0.022 | 11.0 | 0.4 | 0.181 | 0.015 | 0.198 | 0.007 |
| 2.854 | 1.648 | 0.015 | 4.341 | 0.020 | 2.868 | 0.021 | 9.9 | 0.4 | 0.199 | 0.018 | 0.168 | 0.008 |
| 3.454 | 1.699 | 0.016 | 4.263 | 0.021 | 2.802 | 0.023 | 9.0 | 0.4 | 0.184 | 0.014 | 0.179 | 0.009 |
| 4.053 | 1.729 | 0.020 | 4.282 | 0.026 | 2.793 | 0.028 | 8.4 | 0.5 | 0.202 | 0.018 | 0.191 | 0.011 |
| 4.749 | 1.655 | 0.019 | 4.171 | 0.025 | 2.750 | 0.027 | 10.5 | 0.4 | 0.104 | 0.018 | 0.166 | 0.012 |
| 5.645 | 1.725 | 0.016 | 4.064 | 0.021 | 2.685 | 0.022 | 9.3 | 0.5 | 0.093 | 0.017 | 0.172 | 0.008 |
| 6.646 | 1.741 | 0.024 | 4.058 | 0.033 | 2.724 | 0.035 | 8.7 | 0.4 | 0.118 | 0.022 | 0.162 | 0.012 |
| 7.743 | 1.704 | 0.018 | 4.072 | 0.024 | 2.586 | 0.026 | 10.3 | 0.3 | 0.035 | 0.016 | 0.201 | 0.011 |
| 9.040 | 1.745 | 0.025 | 3.881 | 0.033 | 2.581 | 0.036 | 9.7 | 0.7 | 0.005 | 0.025 | 0.162 | 0.015 |
| 10.530 | 1.643 | 0.031 | 3.892 | 0.041 | 2.502 | 0.044 | 12.0 | 0.7 | -0.056 | 0.020 | 0.208 | 0.024 |
| 12.330 | 1.541 | 0.033 | 3.821 | 0.045 | 2.414 | 0.047 | 14.8 | 0.8 | -0.126 | 0.017 | 0.253 | 0.023 |
| 14.520 | 1.765 | 0.036 | 3.794 | 0.049 | 2.430 | 0.052 | 10.0 | 0.8 | -0.049 | 0.024 | 0.217 | 0.032 |
| 17.210 | 1.447 | 0.041 | 3.729 | 0.056 | 2.405 | 0.059 | 17.3 | 0.9 | -0.169 | 0.018 | 0.259 | 0.025 |
| 20.500 | 1.520 | 0.051 | 3.670 | 0.069 | 2.431 | 0.072 | 15.3 | 1.3 | -0.153 | 0.023 | 0.225 | 0.044 |
| 24.480 | 1.544 | 0.065 | 3.618 | 0.088 | 2.271 | 0.091 | 15.4 | 1.6 | -0.192 | 0.024 | 0.300 | 0.047 |
| 29.450 | 1.501 | 0.089 | 3.674 | 0.092 | 2.136 | 0.095 | 17.0 | 2.0 | -0.224 | 0.036 | 0.388 | 0.037 |
| 35.860 | 1.692 | 0.103 | 3.753 | 0.106 | 2.170 | 0.108 | 12.4 | 2.0 | -0.153 | 0.049 | 0.355 | 0.056 |
| 44.710 | 1.657 | 0.155 | 3.735 | 0.157 | 2.225 | 0.155 | 13.0 | 2.8 | -0.154 | 0.070 | 0.327 | 0.086 |
| 58.860 | 1.573 | 0.243 | 4.026 | 0.249 | 1.983 | 0.242 | 15.8 | 3.5 | -0.180 | 0.062 | 0.506 | 0.099 |
| Radius (arcsec) | d | d | d | Age (Gyr) | dAge | [] | d[] | [] | d[] | |||
|---|---|---|---|---|---|---|---|---|---|---|---|---|
| -7.398 | 1.712 | 0.034 | 3.635 | 0.033 | 2.351 | 0.040 | 11.3 | 0.7 | -0.119 | 0.018 | 0.239 | 0.018 |
| -3.230 | 1.659 | 0.023 | 4.140 | 0.024 | 2.675 | 0.028 | 10.7 | 0.5 | 0.067 | 0.021 | 0.183 | 0.014 |
| -1.444 | 1.578 | 0.023 | 4.479 | 0.023 | 2.982 | 0.028 | 10.6 | 0.6 | 0.243 | 0.020 | 0.156 | 0.008 |
| -0.486 | 1.581 | 0.020 | 4.837 | 0.020 | 3.099 | 0.024 | 9.3 | 0.5 | 0.389 | 0.016 | 0.199 | 0.007 |
| 0.266 | 1.527 | 0.017 | 4.920 | 0.017 | 3.016 | 0.021 | 11.1 | 0.4 | 0.344 | 0.013 | 0.230 | 0.006 |
| 1.249 | 1.620 | 0.026 | 4.673 | 0.027 | 2.931 | 0.032 | 9.7 | 0.6 | 0.303 | 0.025 | 0.216 | 0.011 |
| 2.764 | 1.671 | 0.025 | 4.318 | 0.032 | 2.773 | 0.033 | 9.9 | 0.6 | 0.166 | 0.022 | 0.194 | 0.013 |
| 5.846 | 1.755 | 0.030 | 3.860 | 0.037 | 2.428 | 0.039 | 10.2 | 0.6 | -0.041 | 0.022 | 0.230 | 0.024 |
| 13.930 | 1.597 | 0.043 | 3.514 | 0.055 | 2.149 | 0.055 | 14.7 | 0.9 | -0.224 | 0.016 | 0.345 | 0.025 |
| Object | Name | RA 2000.0 (hms) | Decl 2000.0(o ’ ”) | ADaaAD is the angular distance from the center of light of NGC 4697, measured in arc seconds | m(5007) |
|---|---|---|---|---|---|
| 1 | W1039 | 12 48 39.015 | -5 47 53.28 | 47 | 26.0 |
| 2 | W1048 | 12 48 37.846 | -5 47 38.11 | 38 | 25.7 |
| 3 | W1132 | 12 48 35.902 | -5 47 25.04 | 38 | 25.5 |
| 4 | W1090 | 12 48 36.655 | -5 48 42.56 | 42 | 26.1 |
| 5 | W1186 | 12 48 34.791 | -5 48 35.84 | 37 | 25.7 |
| 6 | W1511 | 12 48 32.967 | -5 48 22.42 | 48 | 25.6 |
| 7 | W1636 | 12 48 31.260 | -5 48 30.80 | 75 | 25.7 |
| 8 | W1679 | 12 48 28.651 | -5 48 06.14 | 108 | 26.6 |
| 9 | W1683 | 12 48 27.123 | -5 47 58.83 | 131 | 25.6 |
| 10 | W1707 | 12 48 27.202 | -5 49 25.52 | 154 | 25.8 |
| 11 | W1709 | 12 48 26.045 | -5 49 13.11 | 163 | 26.0 |
| 12 | W1737 | 12 48 23.645 | -5 49 58.86 | 217 | 26.0 |
| 13 | W1747 | 12 48 20.016 | -5 49 52.20 | 261 | 26.0 |
| 14 | W1746 | 12 48 18.897 | -5 50 15.67 | 286 | 26.0 |
| Line | PN 1 | PN 2 | PN 3 | PN 4 | PN 5 | PN 6 | PN 7 |
|---|---|---|---|---|---|---|---|
| [Ne III]3868 | 1.5 | 1.2 | 2.2 | 2.1 | 1.4 | 1.3 | 2.2 |
| H 4861 | 1.0 | 1.0 | 1.0 | 1.0 | 1.0 | 1.0 | 1.0 |
| [O III]4959 | 8.0 | 4.2 | 7.2 | 5.1 | 3.1 | 4.3 | 5.9 |
| [O III]5007 | 23.3 | 14.6 | 22.0 | 15.5 | 9.5 | 12.8 | 18.9 |
| H 6563 | 3.0 | 3.3 | 3.8 | 3.0 | 3.2 | 3.4 | 4.2 |
| Line | PN 8 | PN 9 | PN 10 | PN 11 | PN 12 | PN 13 | PN 14 |
|---|---|---|---|---|---|---|---|
| [Ne III]3868 | - | 2.0 | 1.6 | 2.2 | 1.5 | 2.5 | 1.3 |
| H 4861 | 1.0 | 1.0 | 1.0 | 1.0 | 1.0 | 1.0 | 1.0 |
| [O III]4959 | 3.5 | 6.0 | 6.2 | 6.2 | 5.0 | 6.7 | 6.1 |
| [O III]5007 | 10.2 | 18.3 | 19.3 | 19.5 | 14.0 | 18.7 | 18.3 |
| H 6563 | 3.3 | 4.1 | 3.2 | 3.1 | 2.5 | 3.2 | 2.8 |
| logL | HDEN | logT | logRin | C | N | O | Ne | 5007 | 3868 | L(H) |
|---|---|---|---|---|---|---|---|---|---|---|
| 37.43 | 4.60 | 4.98 | 16.3 | 8.50 | 8.00 | 8.60 | 7.88 | 19.0 | 1.9 | 34.99 |
| 37.43 | 4.60 | 4.88 | 16.3 | 8.58 | 8.08 | 8.68 | 7.99 | 19.0 | 1.9 | 34.99 |
| 37.43 | 4.60 | 5.08 | 16.3 | 8.56 | 8.06 | 8.66 | 7.94 | 19.0 | 1.9 | 34.97 |
| 37.43 | 4.40 | 4.98 | 16.3 | 8.52 | 8.02 | 8.62 | 7.91 | 19.0 | 1.9 | 34.99 |
| 37.43 | 4.80 | 4.98 | 16.3 | 8.56 | 8.12 | 8.61 | 7.88 | 19.0 | 1.9 | 35.01 |
| 37.43 | 5.00 | 4.98 | 16.3 | 8.61 | 8.15 | 8.64 | 7.90 | 19.0 | 1.9 | 35.05 |
| 37.43 | 4.60 | 4.98 | 16.1 | 8.58 | 8.15 | 8.61 | 7.90 | 19.0 | 1.9 | 34.92 |
| 37.43 | 4.60 | 4.98 | 16.5 | 8.58 | 8.15 | 8.64 | 7.93 | 19.0 | 1.9 | 35.09 |