Evidence of a counterrotating core in the Large Magellanic Cloud
Abstract
Stellar radial velocity in the central region of the Large Magellanic Cloud (LMC) is used to estimate the radial velocity curve along various position angles (PA) including the line of nodes (LON). The central part of the radial velocity profile, along the LON, shows a V-shaped profile - a clear indication of counterrotation. The counterrotating region and the secondary bar have similar location and PA. The origin of the counter-rotating core could be internal(secondary bar) or external(accretion). To explain the observed velocity profile, we propose the existence of two disks in the inner LMC, with one counterrotating. This two disk model is found to match the HI velocities as well. Two disks with different LON and velocity profiles can create regions which are kinematically and spatially separated. Predicted such locations are found to match the observed locations where the HI clouds are found to have two velocities.
1 Introduction
The Large Magellanic Cloud (LMC) has been the subject of a large number of surveys over the years in a wide variety of wavebands (see Westerlund (1990)). The radial velocity curve of the LMC was estimated up to 8 Kpc by van der Marel et al. (2002) using carbon stars. The linear inner part of the rotation curve has one peculiarity, which is the presence of negative velocity near the center. This result was not given any importance in the paper due to statistically insignificant number of stars near the center. Two kinematic components in CH stars were found by Hartwick & Cowley (1988) and a lower velocity component in carbon stars was found by Graff et al. (2000). The HI velocity studies also revealed two kinematic components, the L and the D components (Rohlfs et al., 1984; Luks & Rohlfs, 1992). Double peaked H I velocities, indicating H I clouds with two velocities in the same line of sight have been found in some locations in the LMC, suggestive of HI gas being located in two layers in the LMC. The galacto-centric radial velocity curve as shown in figure 8 of Rohlfs et al. (1984) shows that the central linear part of the velocity profile has a reversal of the slope near the center. All the above, point to the possibility of a kinematically distinct component in the inner LMC. Zhao et al. (2003) estimated and studied the radial velocity of 1347 stars in an attempt to detect the presence of a kinematically different component in the inner LMC, and assigned a probability of less than 1% for its presence. We re-analyze the above data and search for evidence of a second kinematic component in the inner LMC.
The variation of stellar velocity as a function of radial distance along various position angles (PA) is used to study the inner kinematics of the LMC. In a barred galaxy, the linear part of the curve near the center would correspond to the bar. As we go away from the center, towards the ends of the bar, the presence of the disk starts dominating, which is denoted by a flattening of the curve. If a kinematically different component is present near the central region, one would expect to see a deviation from a straight line profile in the central region well inside the point of flattening of velocity. Thus, deviations in the radial velocity curve near the center, estimated along various PAs, including the LON, are used to search for the kinematic signature of a second component within the primary bar of the LMC. So far, no model has been proposed to explain the different kinematics shown by gas and stars. In this study, we propose a two-disk model for the LMC. We model these disks with the observed inclination and the LONs estimated from the radial velocity profiles along various PAs. We also demonstrate that this simple model for the LMC is capable of explaining most of the observed kinematic features.
2 Rotation curve and the V-shaped profile
The radial velocity of 1347 stars presented by Zhao et al. (2003) is used to obtain the stellar radial velocity curves. The bar region of the LMC is more or less covered by this data. The main advantage of this data is that it is homogeneous such that the same set up is used to estimate all the velocities, thereby reducing the systematic errors. On the other hand, the observed stars do not belong to any particular evolutionary category, thus represents a heterogeneous population. We also used the stellar velocities of red super giants (Olsen & Massey, 2003), carbon stars (Kunkel et al., 1997) and red giants (Cole et al., 2005). The center of the LMC is taken to be = ; = (J2000) (de Vaucouleurs & Freeman, 1973), which is the optical center. The and are converted to the linear X, Y co-ordinates using this center.
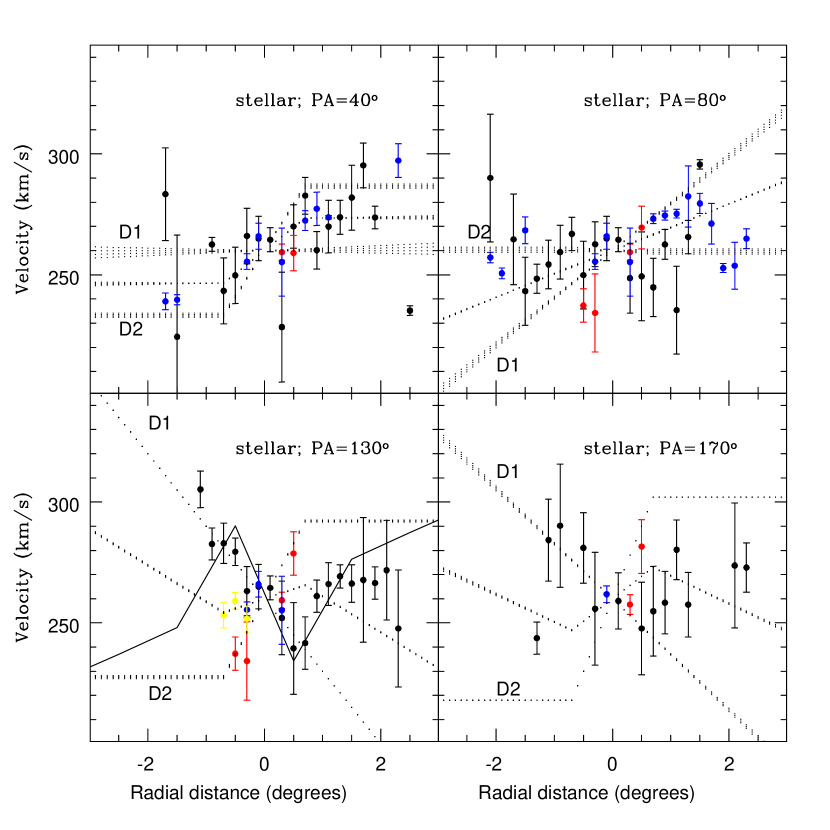
van der Marel et al. (2002) estimated the LON to be 129o.9 6o.0, using carbon stars. Therefore, stars located along PA = 130o and located up to 0.4o away from the PA in the perpendicular direction, on both sides are selected. These stars were plotted as a function of radial distance and were found to show a variation from the expected straight line profile. This could be more clearly identified if we bin the data in the radial distance and study the variation of the average velocity. The plot is shown in figure 1, bottom left panel. The error bars as shown in the figure indicate the dispersion in the velocity among the stars in each bin. The striking feature of the plot is the ’V’ shaped velocity profile in the central region, where we expect a straight line profile corresponding to the primary bar. The radial distance along any PA is taken positive for the northern part and negative for the southern part of the LMC (Feitzinger, 1980). The rotation curve as estimated from carbon stars by van der Marel et al. (2002) (their table 2) is shown as solid line. It can be seen that their suggestion of counterrotation near the center is confirmed here.
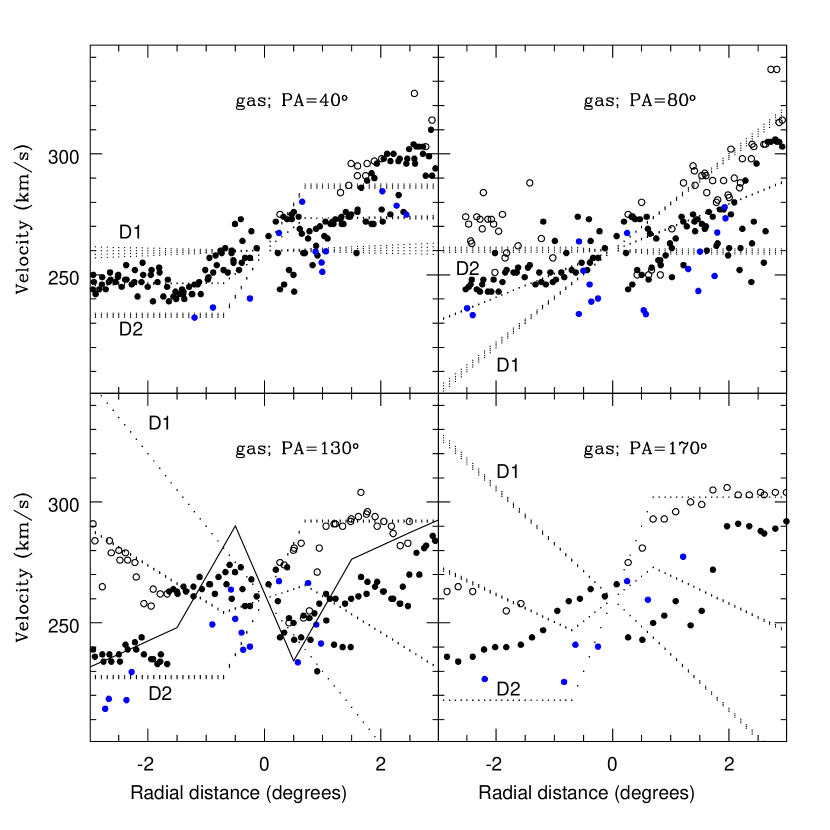
We obtained the radial velocity profile along various PAs, to estimate the value of the PA at which maximum gradient is noticed, which will be the LON of the central region. Therefore, we used all the stellar data and estimated the radial velocity profiles for PAs from 0o – 180o, with a gap of 10o. The slope of the counter-rotating region was found to be maximum near 120o – 130o, indicating that this is the LON of the inner region. The stars located immediately outside the counterrotating region, were seen not to have the LON of 130o. This can be seen in the top-left plot as shown in figure 1, where the radial velocity profile along PA = 40o, which is the minor axis for the above LON, is shown. The radial velocity has a gradient about the minor axis. The stellar data shown here extends only up to 2o – 2.5o, therefore the above argument is valid up to this radial distance. The HI velocity data of the main component from Rohlfs et al. (1984) were also analyzed in the same way and the radial velocity curve is shown in figure 2 (lower left panel). In the case of gas, we have shown the actual data points and not the average. The velocity pattern clearly indicates two velocity components, where the inner region shows an s-shaped deviation. The PA of the LON of HI gas was found to be 170o (Luks & Rohlfs, 1992; Kim et al., 1998; Rohlfs et al., 1984). We also estimated the radial velocity curve along the HI LON for both stars and gas and the plots are shown in the lower right panels of figures 1 and 2. The stellar radial velocity curve shows very large scatter, which is partly due to less number of stars and partly due to inherent scatter in each bin. The HI profile, clearly shows an s-shaped deviation in the inner region. NGC 3593 is also found to have similar radial velocity profile, as shown in figure 1 of Bertola et al. (1996). This was interpreted as a case of inner stars counterrotating with respect to the outer ones.
3 Two disk model and the fit to the observed radial velocity profiles
We tried to model the disk of the LMC such that a counterrotating contribution is added to the main disk of the LMC. The main disk of the LMC which contains the bar and majority of the mass is responsible for most of the radial velocity curve. The LON of the counterrotating region is also found to be 130o. Thus the inner kinematic change is produced by invoking counterrotation, with respect to the main large scale disk, whose parameters were estimated by van der Marel et al. (2002). On the other hand, the region just outside the counterrotating core was found to have a LON 130o. The position of the LON of this region can be estimated from the fact the there is a positive slope observed at a PA of 40o. This indicates that the value of LON is larger than 130o. A value of 160o – 170o for the PA was able to reproduce the observed slope along 40o. It is found that the LON of HI gas is 170o and it extends only up to 2.5 – 3.0o. The inclination of the HI distribution was found to be similar to that of the stellar disk. Thus it is quite possible that the intermediate region between the counterrotating core and the outer LMC, is dominated by a disk, which is more of HI gas and having the above mentioned properties. The stellar data shows a lot of scatter for 170o, probably due to the fact that the stars are quite disturbed in this region.
Thus, we generated two disks, one with the LON=130o that follows the kinematics of the stellar disk (D1) and with an inclination of , about the LON. The rotational velocity for this disk is chosen such that it fits the observed range of stellar velocity and with a linear rise in the velocity up to a radial distance of 3o, which stays flat beyond that. The systemic velocity of this disk is taken as 260.0 kms-1. The disk, which is dominated by HI gas, has the LON=170o (D2). The systemic velocity of the disk2 was taken as 275 kms-1 (Kim et al., 1998) initially, but was found to fit well for 260 kms-1 as well. The rotational velocity of the disk2 is chosen such that it fits the stellar data. Since the two disks have the same inclination about two different LON, there will be a separation created between the disks. As their kinematics are also different, there will be regions in the LMC, which have the same location in the sky, but different velocities along the line of sight. When one estimates the radial velocity curve, both disks contribute such that the observed velocities could be the same as that of the individual disks or an average of the two components, depending upon where they are located.
To compare with the observation, we generated the radial velocity curves as shown in figures 1 (for stars) and 2 ( for gas). In both the figures, the radial velocities of individual disks as well as the average are shown. In figure 1, the profile of D1 fits the central region between 1.0o – 0.5o very well for the PA = 130o. The stars in Zhao et al. (2003) mostly follow the counterrotating disk. The carbon stars on the other hand follow the disk2 and the red giants follow the average velocity profile. Therefore, even inside the counterrotating core, two disk model is required to fit the observed data. The stellar data just outside the central region, towards the north, seems to fall closer to the average profile of D1 and D2. The assumption of the LON for the disk2 as 170o is justified from the fact that the velocity profile along the minor axis of D1 is found to fit well. The plot at the lower right hand panel, for the PA = 170o is found to show a lot of scatter, which is not expected. Also, the minor axis of D2, which is PA= 80o also shows a scatter plot. Stars located in this intermediate region, between 1o – 2.5o appear disturbed. In the case of gas, as shown in figure 2, the agreement is very good. For PA = 130o, the HI gas is found to follow the D2 and the average. The open circles denote the second component of HI as given by Rohlfs et al. (1984). It is remarkable to see that the two disk model naturally explains the presence of two velocities of clouds in the same line of sight. Molecular clouds also more or less follow the predicted velocities. The plot for PA=40o is found to fit most of the data, except the high velocity gas in the north and some scatter near the center. For PA = 170o, which is the LON for HI, the HI gas is found to follow D2, with some deviation near the center. For PA=80o, molecular clouds are found to show deviation from the model, but the HI gas is found to be more or less located within the predicted locations and does not show any significant rotation about its minor axis. Therefore, we find that the velocity model which was tuned to fit the stars, fits the HI gas remarkably well. The model velocities which were arrived are: the slope of D1 is 30.0 kms-1deg-1, up to a radius of 3o, D2 has a slope of 60.0 kms-1deg-1, up to a radius of 0.o7 and a constant velocity of 42 kms-1 up to 3.o0. In reality, the extent of the counterrotating disk could be much less than 3o. Better data in the intermediate region is required to obtain the exact value. A variation of up to 15% in the above value seems to fit the observed profile and hence the error of estimation of the slope can be considered to be 15%. Assuming the already estimated inclination, we find that the main disk of the LMC is rotating in the clockwise direction. This result is similar to the finding of Kroupa & Bastian (1997). The core region has counter clockwise rotation.
In this model, there are some locations in the line of sight, where the two disks are physically and kinematically separated. Points in the line of sight which are located in two disks and separated by more than 360 pc are assumed to be physically separated. The scale-height of the HI disk was estimated to be about 180 pc (Padoan et al., 2001), thus the assumed value for separation is just enough to physically separate the disks. Locations which are in the same line of sight, but located in two disks and have more than 20 kms-1 difference in velocity are assumed to be kinematically separated. Figure 3 shows the predicted locations in the LMC, where the disks are physically and kinematically separated. One of the observed features in the LMC is the presence of HI clouds in layers. The location of the double peaked clouds (Rohlfs et al., 1984) are over plotted as red points. One can see that majority of the double peaked clouds are located within the predicted region. HI in the north-western side is matched very well. Some part of the south-east lobe of HI is found to be extended outside, and this lobe is known to extend to larger distance from the LMC, due to tidal effects (Staveley-Smith et al., 2003). Thus a larger extent of the HI gas in this lobe may be expected. The presence of gas near the north-eastern side is not explained by this model. The more or less agreeable match between the predicted and observed locations of the double velocities indicates that the assumed two disk model is very close to the true nature of the LMC.
If the microlensing in the LMC is indeed caused by self-lensing, then kinematic outliers are expected towards the LMC in their distribution of radial velocity, proper motion, projected distance from the center of the LMC, distance modulus and reddening (Zhao, 1991a, b). In the two-disk model, stars present in two disks differ in radial velocity, projected distance, distance modulus and may be reddening also. Though most of the stars are located in the main disk, the disk2 also hosts some stars like the young stars. Thus stars located in two disks can increase the star-star microlensing in the line of sight, thereby increasing the probability of self-lensing within the inner LMC. The locations of the observed micro-lensing events towards the LMC are shown in figure 3 as big open circles on the predicted physically and kinematically separated locations on the LMC. Many of the events can be found to fall within the predicted region. This suggests that the two disks in the inner LMC fit most of the criteria required for self-lensing within the LMC.
4 Discussion
The main result of the present study is in the identification of a counterrotating core in the LMC. The inner LMC within a radius of 3o is modeled as having the presence of two disks, with one counterrotating. This model is valid inside the 3o radius. The region outside is not studied here and probably follows the parameters as estimated by van der Marel et al. (2002). The two-disk model presented here is a very simple model. In reality, the LMC may be a more complicated system, which requires detailed modeling. The velocity data used in the present analysis was able to bring out the counterrotation very clearly. The V-shaped profile obtained in the center should in fact be an S-shaped profile, just like in the case of HI. The lack of data is responsible for the V-shape, which is the truncated S-shape. More velocity data for stars belonging to various population may lead to a more detailed model of inner and intermediate regions based on velocity dispersion, kinematics of different populations and possibly differing rotation centers of the two disks.
Kinematically peculiar cores are generally understood as being fossil fingerprints of merging history of host galaxies (see Mehlert et al. (1998)). In disk galaxies it is generally interpreted as the signature of external origin of the gas component (Bertola et al., 1992), where less than 12% host counterrotating gas disks and less than 8% host counterrotating stellar disks (Pizzella et al., 2004). The presence of counterrotation in NGC 3593 is modeled as due to two disks, to fit the observed velocity profile (Bertola et al., 1996). The two disk model proposed for the LMC thus closely resembles the model for NGC 3593. In the LMC, the population I stars are found to show the kinematics of HI gas indicating that they belong to the disk2. It is possible that the young stars in the LMC are formed from the gas which has been accreted recently. Recently, Bruns et al. (2004) presented a complete HI survey of the Magellanic system. The LMC and the SMC were found to be associated with large gaseous features - the Magellanic Bridge, the interface region and the Magellanic stream. This gas connects the two not only in position, but also in velocity. As discussed by Bruns et al. (2004), a fraction of the gas present in the vicinity is likely to be accreted by the Clouds. The gas in the Magellanic Bridge has low velocities in the LMC-standard-of-rest frame making an accretion of some of this gas by the LMC very likely. Thus it is very likely that the inner gas-rich disk of the LMC could be formed from this infalling gas, which could provide new fuel to star formation.
There is also a second possibility for the formation of counterrotation near the center. The photometric location of an inner secondary bar was identified by Subramaniam (2004) as 1.3 to 0.5 Kpc in radial distance along the LON 120o. This is in good agreement with the extent of the counterrotating component and its PA. Thus the identified counterrotation may be associated with the secondary bar of the LMC. Numerical simulations of secondary bars, for example, Fredli (1996) indicates that nested, counterrotating, stable bars are viable and such systems can exist. The proposed formation scheme is the accretion of a retrograde satellite. Counterrotating secondary bars could also be formed due to the instabilities in the primary bar (Fredli & Martinet, 1993). This scenario does not require any merger. Thus, the true nature and the reason for the formation of the counterrotating core in the LMC is to be understood from a wide variety of possibilities which are of external/internal origin and some discussion in this direction can be found in Corsini et al. (1998). The proximity of the LMC makes it ideal to test out the theories of formation of counterrotating cores and possibly understand their origin.
We thank Andrew Cole for providing the velocity data of red giants.
References
- Bertola et al. (1992) Bertola, F., Buson, L.M. & Zeilinger, W.W., 1992, ApJ, 401, L79
- Bertola et al. (1996) Bertola, F., Cinzano, P., Corsini, E.M., Pizzella, A., Persic, M., & Salucci, P., 1996, ApJ, 458, L67
- Bruns et al. (2004) Bruns et al., 2005, A&A, 432, 45
- Cole et al. (2005) Cole, A.A., Tolstoy, E., Gallaghar, III, J.S. & Smecker-Hane, T., 2005, AJ, 129, 1465
- Corsini et al. (1998) Corsini, E.M., Pizzella, A., Funes, S.J., Vega Beltran, J.C., & Bertola, F., 1998, A&A, 337, 80
- de Vaucouleurs & Freeman (1973) de Vaucouleurs, G., & Freeman, K.C. 1973, Vistas Astron., 14, 163
- Feitzinger (1980) Feitzinger, J.V., 1980, Space Sci. Rev., 27, 35
- Fredli (1996) Friedli, D., 1996, A&A, 312, 761
- Fredli & Martinet (1993) Friedli, D., & Martinet, L., 1993, A&A, 277, 27
- Graff et al. (2000) Graff, D.S., Gould, A., Suntzeff, N.B.,& Schommer, R.A. 2000, ApJ, 540, 211
- Hartwick & Cowley (1988) Hartwick, F.D.A., & Cowley, A.P., 1988, ApJ, 334, 135
- Kim et al. (1998) Kim, S., Staveley-Smith, L., Dopita, M.A., Freeman, K.C., Sault, R.J., Kesteven, M.J., & McConnell, D., 1998, ApJ, 503, 674
- Kroupa & Bastian (1997) Kroupa, P., Bastian, U., 1997, New Astron., 2, 77
- Kunkel et al. (1997) Kunkel, W.E., Demers, S., Irwin, M.J. & Albert, L., 1997, ApJ, 488, 129
- Luks & Rohlfs (1992) Luks, Th., & Rohlfs, K. 1992, A&A, 263, 41
- McGee & Milton (1966) McGee, R.X., & Milton, J.A. 1966, Austral. J. Phys. 19, 343
- Mehlert et al. (1998) Mehlert,D., Saglia, R.P., Bender, R., & Wegner, G., 1998, A&A, 332, 33
- Mizuno et al. (2001) Mizuno, N., et al., 2001, PASJ, 53, 97
- Olsen & Massey (2003) Olsen, K.A.G., & Massey, P. 2003, AJ, 126, 2867
- Padoan et al. (2001) Padoan, P., Kim, S., Goodman, A. & Staveley-Smith, L., 2001, ApJ, 555, L33
- Pizzella et al. (1999) Pizzella, A., Corsini, E.M., Bertola, F., Funes, J.G. & Beltran, J.C.V. 1999, ASP conf. Series. 163., eds. P Carrel & J. Cepa, vol. 163, p292
- Pizzella et al. (2004) Pizzella, A., Corsini, E.M., Beltran, J.C.V. & Bertola, F., 2004, A&A, 424, 447
- Rohlfs et al. (1984) Rohlfs, K., Kreitschmann, J., Siegman, B.C., & Feitzinger, J.V. 1984, A&A, 137, 343
- Staveley-Smith et al. (2003) Staveley-Smith, L., Kim, S., Calabretta, M.R., Haynes, R.F. & Kesteven, M.J., 2003, MNRAS, 339, 87
- Subramaniam (2004) Subramaniam, A., 2004, ApJ, 604, L41
- van der Marel (2001) van der Marel, R.P. 2001, AJ, 122, 1827
- van der Marel et al. (2002) van der Marel, R.P., Alves, D.R., Hardy, E., & Suntzeff, N.B., 2002, AJ, 124, 2639
- Westerlund (1990) Westerlund, B.E., 1990, Astronomy & Astrophysics Review, 2, 29
- Zhao et al. (2003) Zhao, H.S., Ibata, R.A., Lewis, G.F., & Irwin, M.J. 2003, MNRAS, 339, 701
- Zhao (1991a) Zhao, H.S., 1999a, ApJ, 526, 141
- Zhao (1991b) Zhao, H.S., 1999b, ApJ, 527, 167