The ACS Virgo Cluster Survey. VII. Resolving the Connection Between Globular Clusters and Ultra-Compact Dwarf Galaxies11affiliation: Based on observations with the NASA/ESA Hubble Space Telescope obtained at the Space Telescope Science Institute, which is operated by the association of Universities for Research in Astronomy, Inc., under NASA contract NAS 5-26555.
Abstract
We investigate the connection between globular clusters and ultra-compact dwarf galaxies (UCDs) by examining the properties of ten compact, high-luminosity () objects associated with M87 (NGC 4486, VCC1316), the cD galaxy in the Virgo Cluster. These objects, most of which were previously classified as M87 globular clusters, were selected from a combination of ground- and space-based imaging surveys. Our observational database for these objects — which we term DGTOs or “dwarf-globular transition objects” — includes Advanced Camera for Survey (ACS) F475W and F850LP imaging from ACS Virgo Cluster Survey, integrated-light spectroscopy from Keck/ESI, and archival F606W WFPC2 imaging. We also present a search for DGTOs associated with other galaxies based on ACS imaging for 100 early-type galaxies in Virgo. Our main findings can be summarized as follows:
-
(1)
Out of the six DGTOs in M87 with both ground-based spectroscopy and HST imaging, we find two objects to have half-light radii, velocity dispersions and mass-to-light ratios that are consistent with the predictions of population synthesis models for old, metal-rich, high-luminosity globular clusters.
-
(2)
Three other DGTOs are much larger, with half-light radii 20 pc, and have -band mass-to-light ratios in the range . These objects, which we consider to be UCDs, resemble the nuclei of nucleated dwarf elliptical galaxies in the Virgo Cluster, having similar mass-to-light ratios, luminosities, and colors.
-
(3)
The classification of the sixth object is more uncertain, but it bears a strong resemblance to simulated “stellar superclusters” which are presumed to form through the amalgamation of multiple young massive clusters.
-
(4)
In general, the UCDs in M87 are found to follow the extrapolated scaling relations of galaxies more closely than those of globular clusters. There appears to be a transition between the two types of stellar systems at a mass of . We suggest that the presence of dark matter is the fundamental property distinguishing globular clusters from UCDs.
-
(5)
We identify a sample of 13 DGTO candidates from the complete ACS Virgo Cluster Survey, selecting on the basis of half-light radius, magnitude and color. For a number of these objects, membership in Virgo can be established through radial velocities or surface brightness fluctuation measurements with our ACS images. Three of these DGTO candidates are embedded in low-surface brightness envelopes.
-
(6)
Five of the 13 DGTOs in Virgo are associated with a single galaxy: M87. This finding suggests that proximity to the Virgo center may be of critical importance for the formation of these objects, although we find M87 to be more abundant in DGTOs than would be expected on the basis of its luminosity, the size of its globular cluster system, or the local galaxy density.
These results show that distinguishing bonafide UCDs from high-luminosity globular clusters requires a careful analysis of their detailed structural and dynamical properties, particularly their mass-to-light ratios. In general, the properties of the UCDs in our sample are consistent with models in which these objects form through tidal stripping of nucleated dwarf galaxies.
1 Introduction
A potentially new type of faint and compact stellar system has recently been identified in the course of a spectroscopic survey in the Fornax Cluster (Drinkwater et al. 1999; Hilker et al. 1999; Drinkwater et al. 2000; Phillipps et al. 2001). Radial velocity measurements for these so-called ultra compact dwarf galaxies (UCDs) reveal them to be Fornax members, and yet they are unresolved in typical ground-based seeing. This observation places an upper limit of pc on the half-light radii of these objects. This is considerably smaller than normal dwarf galaxies, which have exponential scale-lengths 300 pc (Deady et al. 2002), and at the same time is much larger than the half-light radii of typical Galactic globular clusters, which have median pc.
The unusual properties of these objects have inspired a number of different explanations for their origin. Possibilities include that they are: (1) exceptionally large and luminous — but otherwise normal — globular clusters which share a common origin with their low-mass analogs; (2) the nuclei of nucleated dwarf elliptical (dE,N) galaxies which happen to be embedded in envelopes of exceptionally low surface-brightness; (3) the aggregate remains of massive young star clusters which merge following their formation in gas-rich mergers (Fellhauer & Kroupa 2002); (4) the end-products of small-scale primordial density fluctuations which collapsed in dense environments (see Phillipps et al. 2001); or (5) the tidally-stripped nuclei of otherwise normal dE,N galaxies. In fact, this latter scenario had been considered several times in the past, beginning with attempts to explain the overabundance of globular clusters associated with M87 in terms of tidal stripping of dwarf galaxies. Zinnecker et al. (1988), Freeman (1990) and Bassino et al. (1994) had examined the possibility that strong tidal effects on nucleated dwarf galaxies, in cluster environments, might leave behind compact nuclei which resemble globular clusters. More recent simulations (e.g., Bekki et al. 2001; 2003; 2004) have generally confirmed the findings of Bassino et al. (1994) that, although non-nucleated dwarf elliptical galaxies disintegrate completely after a few passages close to a giant galaxy like M87, the nuclei of more massive dE,N galaxies manage to survive long after the surrounding envelope has been tidally stripped (a mechanism dubbed “galaxy threshing” by Bekki et al. 2001). Phillipps et al. (2001) and Drinkwater et al. (2003) examine the various possibilities, and argue that the compact objects in Fornax are either the stripped remains of nucleated dwarfs, or a genuinely new class of galaxy.
To date, the debate over the origin of UCDs has been guided largely by the results of ground-based imaging and spectroscopy, which by themselves provide little or no constraints on the internal structural and dynamical properties of these objects. Such information is not only essential for understanding their nature, but also for assessing the extent to which they differ from massive, but otherwise “normal”, globular clusters (see also Mieske et al. 2002). However, HST imaging has recently become available for several of these objects. From an analysis of STIS images for five UCDs, Drinkwater et al. (2003) find typical absolute magnitudes and half-light radii of and pc. In light of the new measurements, rather than just upper limits, the classification of UCDs as objects fundamentally distinct from massive globular clusters seems less secure: for instance, 9% of the globular clusters in the Milky Way have half-light radii of pc (the range spanned by the objects in Fornax), although the majority of these globulars are low-luminosity objects. In any event, it is clear that reliable information on the photometric, structural, dynamical properties for an expanded sample of UCD candidates, preferably in new and different environments, is needed to investigate the nature and homogeneity of this potentially new type of galaxy. And improved observational material for not just candidate UCDs, but also the exceptionally bright globular clusters which are under-represented in Local Group samples, is needed to investigate the extent to which these UCDs differ from the most luminous globular clusters.
In this paper, we investigate the connection between globular clusters and UCDs by studying objects selected from a combination of ground-based catalogs of the M87 globular cluster system and HST images acquired as part of the ACS Virgo Cluster Survey (Côté et al. 2004; hereafter Paper I). To avoid biasing the discussion and classification of these objects as either globular clusters or UCDs, we henceforth refer to them as “dwarf-globular transition objects” or DGTOs. This term seems appropriate since these objects have luminosities which place them simultaneously among the brightest known globular clusters and the faintest dwarf elliptical galaxies. Our goal is to combine our F475W and F850LP ACS imaging with archival F606W WFPC2 imaging and ground-based spectroscopy from the Keck telescope to identify and study these DGTOs. In this paper, we focus on the photometric, structural and dynamical properties of these objects and we use this information to classify each DGTO as either a globular cluster or a UCD; in a future paper, we shall investigate the star formation and chemical enrichment histories of our program objects using our Keck spectra (Haşegan et al. 2005; in preparation).
The paper is organized as follows. In §2, we discuss the selection of the program objects. In §3, we describe the reduction of the spectroscopic data obtained with the Echellette Spectrograph and Imager (ESI; Sheinis et al. 2002). The measurement of radial velocities and internal velocity dispersions for the program objects is presented in §4. The determination of structural parameters for a subset of our program objects, based on HST images, is discussed in §5. We examine the scaling relations for these objects in §6 and derive masses and mass-to-light ratios in §7. Additional DGTO candidates identified in the ACS Virgo Cluster Survey are reported in §8. We summarize our findings in §9.
2 Sample Selection
We begin by concentrating on ten DGTOs in the vicinity of VCC1316 (M87), the cD galaxy near the dynamical center of Virgo. All ten objects have previously been classified as globular clusters associated with M87, and all are confirmed members of Virgo, having appeared in published photometric and radial velocity studies of the M87 globular cluster system (e.g., Strom et al. 1981; Cohen & Ryzhov 1997; Cohen et al. 1998; Hanes et al. 2001; Côté et al. 2001). With absolute magnitudes in the range , these objects would be among the most luminous of M87’s 14,000 globular clusters (McLaughlin et al. 1994). In terms of luminosity alone they have few, if any, counterparts in the Local Group.
As explained in the following sections, we have obtained ESI spectra for all ten objects. HST imaging is available for six of the ten. Among these six, three were observed with ACS in the F475W and F850LP bandpasses as part of the ACS Virgo Cluster Survey, while WFPC2/F606W images for three other objects are available from the HST archive.
2.1 Selection From Ground-Based Surveys
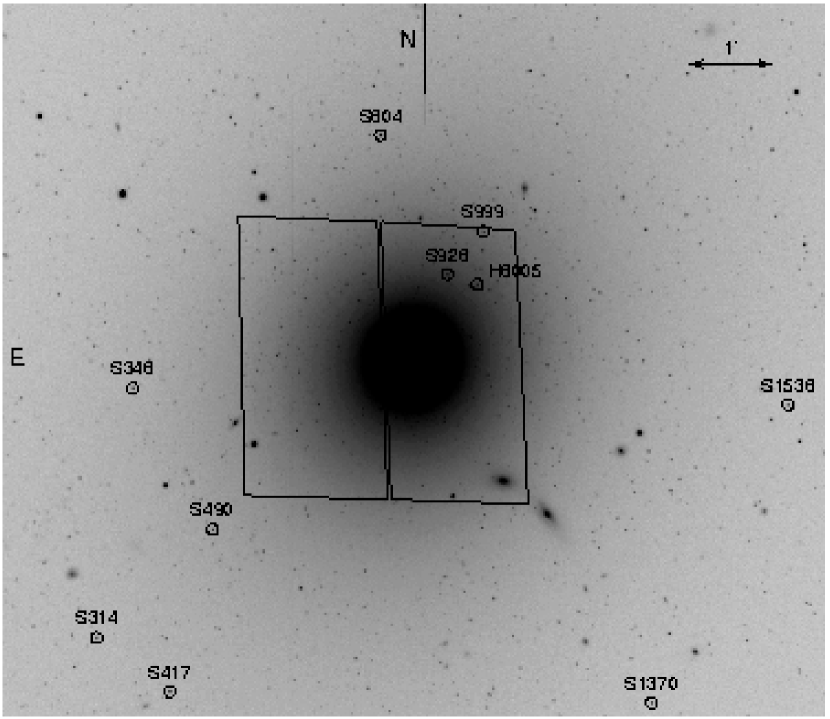
Seven of our DGTOs (S314, S348, S417, S490, S804, S1370, S1538) were selected from the photographic survey of the M87 globular cluster system of Strom et al. (1981). In each case, membership in Virgo was previously established through radial velocity measurements (e.g., Mould et al. 1990; Cohen & Ryzhov 1997; Hanes et al. 2001). These objects were selected to be among the brightest of M87 globular clusters in the compilation of Hanes et al. (2001).
Figure 1 shows the positions of these seven objects in a -band image centered on M87 (McLaughlin et al. 1994). Note that they all fall outside the field imaged by the ACS Virgo Cluster Survey, which is indicated by the solid lines.
2.2 Selection From the ACS Virgo Cluster Survey
Paper I gives a detailed description of the ACS Virgo Cluster survey (GO-9401): a program to image, in two widely separated bandpasses (F475W Sloan and F850LP Sloan ), 100 early-type members of the Virgo Cluster using the ACS instrument (Ford et al. 1998). Total exposure times for each galaxy are 750 sec in F475W and 1210 sec in F850LP, respectively. Given its depth and uniformity, the survey offers a unique opportunity to study the globular cluster systems of early-type galaxies in Virgo in a systematic and comprehensive manner. Jordán et al. (2004a; hereafter Paper II) discuss the pipeline developed for the reduction and analysis of the 500 ACS Virgo Cluster Survey images: i.e., image registration, drizzling strategies, the computation of weight images, object detection, the identification of globular cluster candidates and the measurement of their photometric and structural parameters.
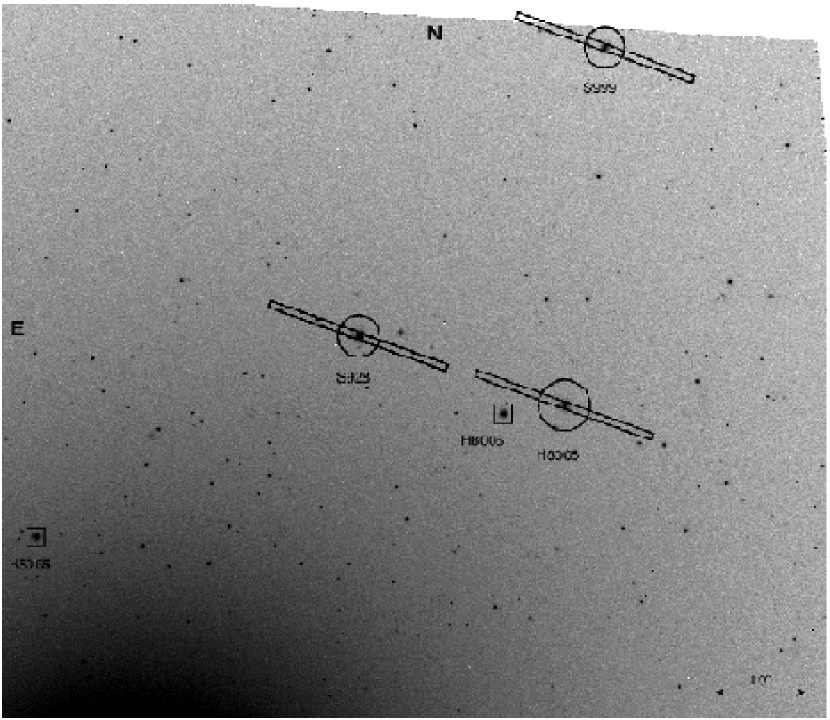
Several DGTOs candidates were immediately apparent upon examining the 2000 sources detected in our M87 field, the overwhelming majority of which are globular clusters. Compared to the bulk of the clusters in M87, these objects are unusually bright and spatially extended. Figure 2 shows a portion of the reduced ACS Virgo Cluster Survey F475W image of M87, illustrating the position and appearance of several DGTOs: the three objects for which we obtained ESI spectroscopy (S928, S999, H8005) as well as two additional DGTOs (H5065 and H8006; see §8). The rectangle centered on each of the first three objects shows the dimension and orientation of the spectrograph slit used in the observations described in §3.
Table 1 contains coordinates, photometry and metallicities for the ten DGTOs that are the focus of this paper. The first column gives the identification number of each object, where the names beginning with an “S” are from Strom et al. (1981), and those starting with an “H” are from Hanes et al. (2001). The next four columns record the right ascension and declination from Hanes et al. (2001), the distance from the nucleus of M87, and the apparent magnitude from McLaughlin et al. (1994). Columns 6–8 give the and magnitudes from the ACS Virgo Cluster Survey, along with the dereddened color (assuming and ; Schlegel et al. 1998). Column 9 gives the observed () color for each object, taken from the database of Hanes et al. (2001). The final three columns record three different estimates of the metallicity for each object: (1) that derived from the () colors and the color-metallicity relation of Bruzual & Charlot (2003) for an assumed age of 13 Gyr; (2) that from the observed () color and the globular cluster color-metallicity relation of Cohen et al. (2003), assuming ) (Geisler & Forte 1990) and (Schlegel et al. 1998); and (3) that found from the Keck/LRIS spectroscopy of Cohen et al. (1998). There is generally good agreement between the various estimates, but since metallicities based on the () index are available for all ten objects, we adopt these estimates in the following analysis.
3 ESI Spectroscopy
An instrument with both high spectral resolution and excellent efficiency is needed to measure the velocity dispersions of low-mass stellar systems, such as globular clusters or dwarf galaxies, at the distance of Virgo. Integrated-light spectra for the ten DGTOs were obtained using the Keck 10m telescope and ESI on 29 April – 1 May 2000 and 4 June 2003. During the first of these observing runs, we observed the seven objects which were selected from the ground-based studies; during the second run, three objects identified from our ACS images were targeted. The same instrumental setup was used in both cases.
In echelle mode, ESI offers ten spectral orders, with complete wavelength coverage from 3900 Å to 10900 Å at a dispersion ranging from 0.15 Å pixel-1 (for = 3900-4400 Å in order #15) to 0.39 Å pixel-1 (for = 9500-11000 Å in order #6). The spectral dispersion, in units of velocity, is a nearly constant 11.5 km s-1 pixel-1. Each object was observed with a 0.75″20″slit, giving an instrumental velocity resolution of 25 km s-1.
Tables 2 and 3 summarise the observation logs. In Table 2, we present the exposure time, Heliocentric Julian Date, position angle of the ESI slit, full width at half maximum for each object measured along the slit’s spatial direction, and the extraction half-width for each observation (i.e. the distance along the slit, measured from the object’s center, over which the light profile was summed). Objects in our sample were observed once, with the exception of S999 and H8005, which were observed twice. Table 3 presents the right ascension, declination, exposure time, Heliocentric Julian Date, spectral type, visual magnitude and radial velocity for the radial velocity standard stars observed during the two observing runs.
The processing of the raw data involved bias subtraction, finding and tracing the apertures, flat normalization, cosmic ray removal, arc extraction and spectral calibration. We used two independent paths for the data reduction, based on the MAuna Kea Echelle Extraction (MAKEE) (Barlow & Sargent 1997) and IRAF reduction packages111IRAF is distributed by the National Optical Astronomy Observatories, which are operated by the Association of Universities for Research in Astronomy, Inc., under cooperative agreement with the National Science Foundation.. The velocity dispersion measurements described in the following section were carried out using both the MAKEE and IRAF processed spectra, yielding consistent results. Henceforth, the quoted velocity dispersions refer to those measured using the MAKEE-processed spectra.
Figure 3 shows the final spectra for the ten DGTOs in the spectral range 5100-5300Å. For S999 and H8005, we show the summed spectra that were used in the analysis below.
4 Velocity Dispersion Measurements
For composite stellar systems, the observed spectrum is a luminosity-weighted sum of individual stellar spectra shifted according to their line-of-sight velocities. Assuming that the individual spectra can be represented by a single template (generally a reasonable assumption for globular clusters or early-type galaxies) then the observed spectrum can be approximated as the convolution of the template spectrum and the line-of-sight velocity distribution (LOSVD), which acts as a broadening function. In the present case, our goal is to estimate the internal velocity dispersion for each of our DGTOs using the template (standard star) and observed spectra.
In order to assess the sensitivity of our results to the method used to carry out the velocity dispersion measurements, three different approaches were used: the Fourier Correlation Quotient method (FCQ; Bender 1990; Bender et al. 1994), Penalized PiXel Fitting (pPXF; Capellari & Emsellem 2004), and the cross correlation method of Tonry & Davis (1979).
The FCQ method constructs an estimate of the broadening function using Fourier techniques, with the deconvolution based on the template-object correlation function. While this algorithm is relatively insensitive to template mismatch, it does require that the absorption lines in the template spectrum be narrow compared to the broadened lines of the object spectrum (i.e., that the object velocity dispersion be large compared to the instrumental resolution; Bender et al. 1991). For our ESI observations, the instrumental resolution ( 25 km s-1) is comparable to that expected for our targets. Indeed, this method failed to give stable results for a few of our program objects. As a result, the FCQ results were not used in the dynamical analysis presented below.
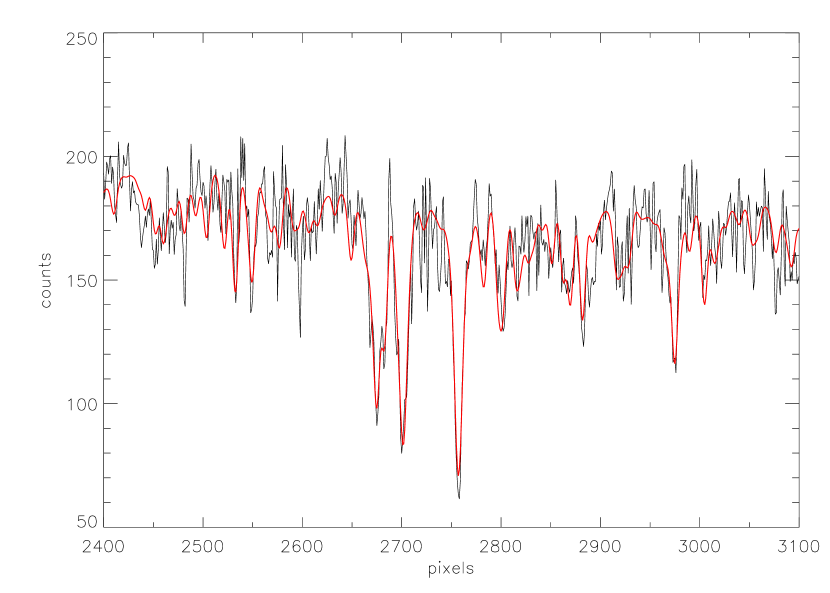
The pPXF algorithm considers the LOSVD of the stars as a Gauss-Hermite series and attempts to recover it using a maximum penalized likelihood formalism while working in pixel space (Merritt 1997; Capellari & Emsellem 2004). It has the advantage of being robust even when the data have low signal-to-noise or when the observed LOSVD is not well sampled. Figure 4 gives an example of the pPXF output for S1538 and a template star (HD154417) in the approximate wavelength range 5100–5300 Å.
The method of Tonry & Davis (1979) assumes that the LOSVD is a Gaussian function with a dispersion equal to
| (1) |
where is the dispersion of the object-template cross-correlation peak and the dispersion of the template auto-correlation peak is given by . The Fourier auto- and cross-correlations were performed with the RV.FXCOR task in IRAF. Measurements were carried out for three spectral orders, spanning the wavelength range 4500–5800 Å. Although the results obtained using different orders were generally in good agreement, the radial velocities and velocity dispersions used in the analysis below are those found using the spectral region 5100–5300 Å which, thanks to the high-S/N in this region and the large number of sharp absorption lines including the Mg I triplet, produced the highest cross correlation peaks and the best consistency among the various methods.
Tables 4 and 5 summarize our findings for the FXCOR and pPXF methods. From left to right, these tables give the mean radial velocity, the individual velocity dispersion measurements (from both the FXCOR and pPXF methods and for a variety of templates), and the average velocity dispersion from each method. It is clear that the two methods give results that are in good agreement. The final column gives the corrected central velocity dispersion, , obtained using the pPXF measurements, after scaling upwards to account for the blurring of the actual velocity dispersion profiles within the ESI slit (see §5). Since an estimation of this correction requires the intrinsic light profile to be known, we are able to give central velocity dispersions only for those DGTOs with HST imaging. These six objects have km s-1, with mean 28 km s-1. For comparison, Galactic globular clusters have central dispersions km s-1, with 7 km s-1 (Pryor & Meylan 1993). Considering just the observed (i.e., uncorrected) dispersions, the full sample of ten DGTOs has km s-1, with mean 28 km s-1.
5 Structural Parameters
5.1 Objects with ACS Imaging
As discussed in §2.2, three DGTOs targeted for observation with Keck/ESI were identified in the ACS Virgo Cluster Survey (S928, S999 and H8005). Since at the distance of Virgo, globular clusters and even the most compact dE/dE,N galaxies are resolved in our ACS images, it is possible to model directly the two-dimensional light distribution of these objects. In fact, this is standard part of the ACS Virgo Cluster Survey reduction pipeline, in which candidate globular clusters are first identified on the basis of magnitude and axis ratio (see Paper II). Since globular clusters in the Local Group are nearly spherical systems, or at most modestly flattened, those sources with axis ratios are discarded. In addition, we discard sources brighter than approximately five magnitudes above the expected turnover of the globular cluster luminosity function at the distance of Virgo. In principal, this last criterion will exclude some extremely bright DGTO candidates, but the adopted upper limits of and translates into a luminosity cutoff 4 that of G1, one of the brightest globular clusters of M31 (Meylan et al. 2001).
Photometric and structural parameters for all objects which satisfy the above criteria were derived by fitting the two-dimensional ACS surface brightness profiles (in both the F475W and F850LP filters) with Point Spread Function (PSF)-convolved isotropic, single-mass King (1966) models (see Paper II and Jordán et al. 2004b; hereafter Paper III). As described in Paper II, empirical PSFs in the F475W and F850LP filters were derived using DAOPHOT II (Stetson 1987; 1993) and archival observations of fields in the outskirts of the Galactic globular cluster NGC 104 (47 Tucanae). The King concentration index, , half-light radius, , and total magnitude were derived for each globular cluster candidate, in both filters. For King models, and the core radius, , are uniquely related for a given concentration index, so the fitted and were used to find for each object (see McLaughlin 2000).
Observed and derived structural parameters for the three DGTOs selected from the ACS Virgo Cluster Survey are presented in Table 6. The first two columns of this table record the object name and ellipticity measured from the ACSVCS images using PSF-convolved King models that allow the inclusion of ellipticity. The next six columns give the King concentration indices, half-light radii and core radii, in both the and bands. The mean -band surface brightness within the half-light radii measured in the separate bandpasses,
| (2) |
is given in the next two columns. These were calculated using the magnitudes presented in Table 1, assuming AV = 3.24E() and a color excess of E() = 0.023 from Schlegel et al. (1998). The final six columns report model-related parameters used in the computation of King masses for our DGTOs, as explained in §7. Note that the half-light radii measured in the two bands show a small but systematic difference of 7% in the sense that the -band radii are larger, presumably a consequence of uncertainties in the PSFs. In the analysis that follows, we use structural parameters averaged between the two filters.
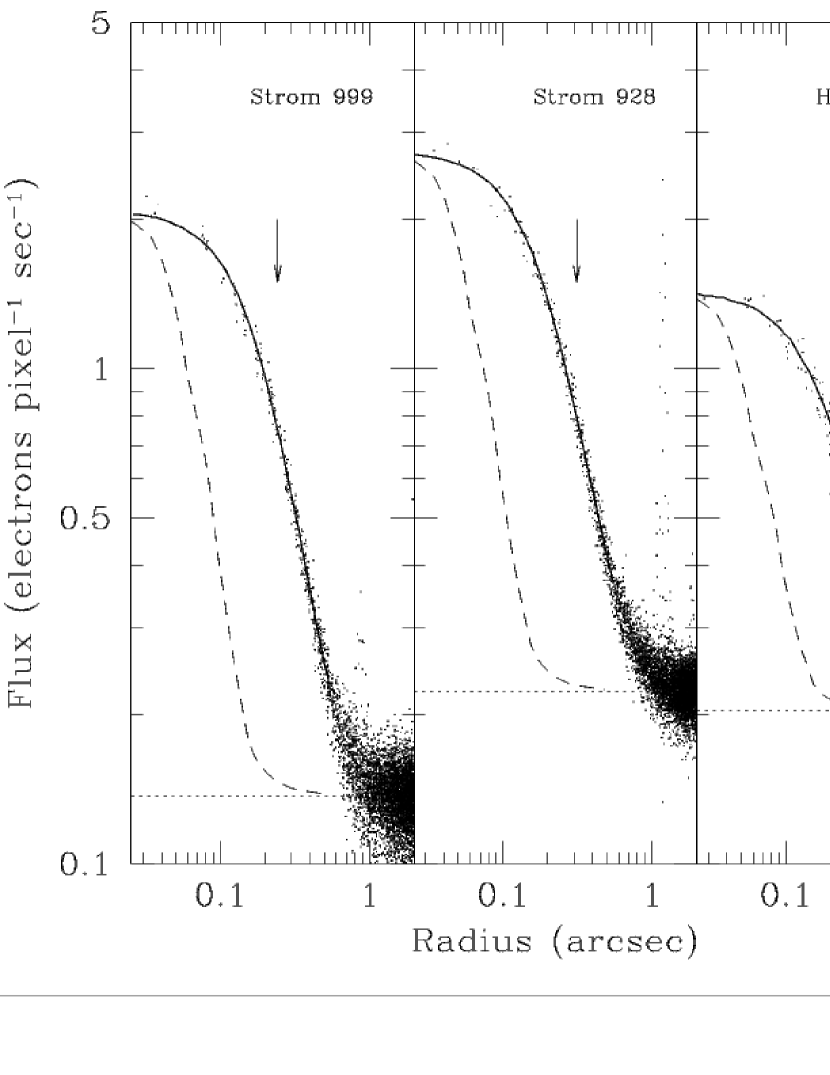
For the three DGTOs in our ACS field, Figure 5 shows radial profiles in the F475W filter measured with IRAF task PLOT.PRADPROF. The adopted background value for each object is shown as the horizontal dotted line; the mean F475W PSF for the M87 frame is shown as the dashed profile. The best-fit, PSF-convolved King model is shown as the solid curve (for two objects, S999 and S928, we notice a small discrepancy in the central part of their profiles with respect to the fit), the fitted parameters of which are given in Table 6. The arrow in each panel indicates the fitted half-light radius, demonstrating the large spatial extent of these objects: , or 24 pc for our adopted M87 distance of 16.1 Mpc (Tonry et al. 2001).
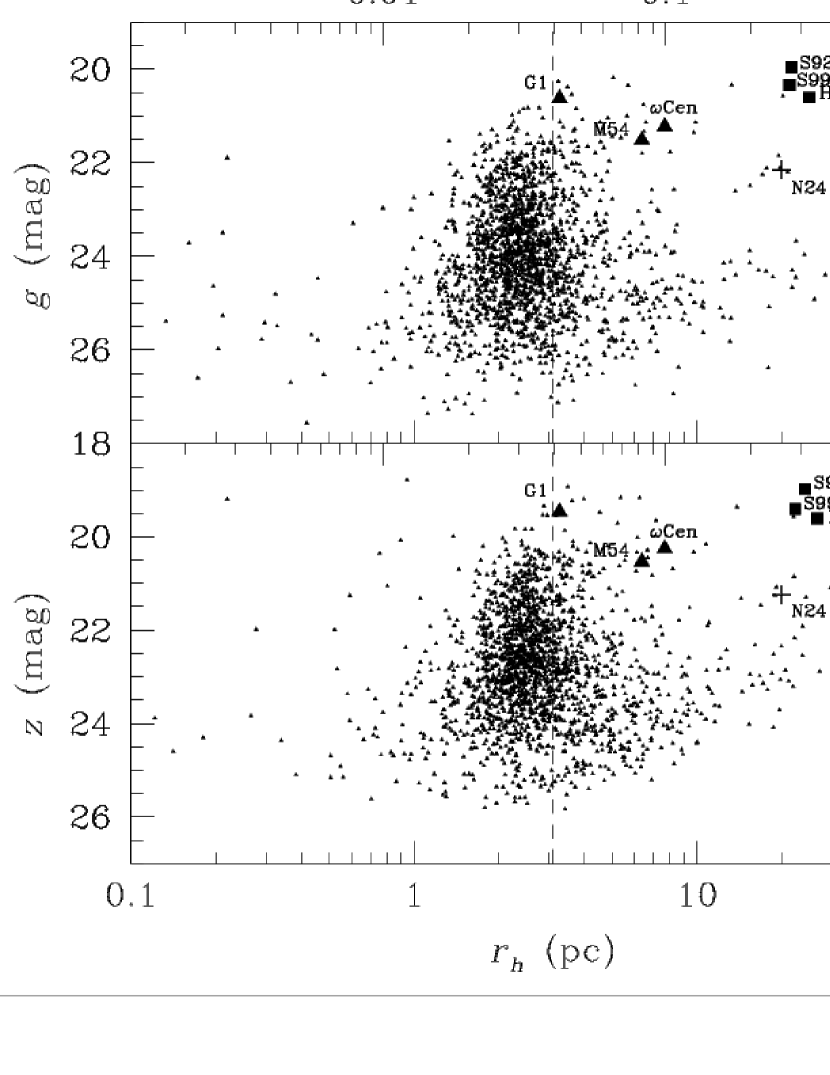
Figure 6 shows the distribution of half-light radii, in both the and bandpasses, for the 2000 cataloged objects in our M87 field. We find median sizes of = 2.34 pc and rh,z = 2.53 pc for these objects, with an scatter of 0.6 pc. The vertical lines in Figure 6 show the median half-light radius of Galactic globular clusters, = 3.2 pc. Taken at face value, this result suggests that the globular clusters in M87 are 30% more compact than those in the Milky Way. A more detailed discussion of the half-light radii and other structural parameters for globular clusters in the ACS Virgo Cluster Survey will be presented in a future paper in this series.
The large squares in Figure 6 show the location of S999, S928 and H8005 in the size-magnitude plane. Not only are these DGTOs among the brightest sources in the M87 field, they are far larger than the vast majority of globular clusters belonging to this galaxy. For comparison, we show in Figure 6 the position of Centauri, G1 and M54, as they would appear at the distance of M87. These objects, which are among the brightest of the 500 cataloged globular clusters in the Local Group, have sometimes been identified as the nuclei of dwarf galaxies in various stages of disruption and, hence, DGTOs in their own right (Freeman 1993; Meylan et al. 2001; Gnedin et al. 2002; Bekki & Freeman 2003). In plotting these objects in Figure 6, we combine their absolute magnitudes and metallicities (Harris 1996; Meylan et al. 2001; Barmby et al. 2002; McLaughlin & van der Marel 2005) with the ()-[Fe/H] and ()-[Fe/H] relations in Paper III to estimate their absolute magnitudes in the and bandpasses. Each object is then shifted to our adopted distance of 16.1 Mpc for M87 and reddened appropriately. We find 20.25 and 21.22 for Cen, 20.62 and 19.46 for G1, and 21.51 and 20.53 for M54. Half-light radii are taken from Harris (1996) and McLaughlin & van der Marel (2005).
It is clear from this figure that S999, S928 and H8005 are objects quite unlike Cen, G1 and M54. They are, on average, twice as luminous as the Local Group clusters, although this result in itself is perhaps not surprising given that the sample of clusters in our M87 field is 3–4 larger than is available in the entire Local Group. More significantly, the half-light radii of S999, S928 and H8005 are roughly five times larger than those of the brightest Local Group clusters. Indeed, few clusters of this size exist in the Local Group; from the catalog of 150 Galactic globular clusters given in Harris (1996), we find only a single object, Pal 14, with pc. But with an absolute magnitude of , Pal 14 is hundreds of times fainter than S999, S928 and H8005. In fact, the Galactic globular cluster which most closely resembles the DGTOs in M87 is NGC 2419, which is both large ( pc) and bright (). It is denoted in Figure 6 by the cross, where we have used the procedure described above to estimate and .
5.2 Objects with WFPC2 Imaging
Seven objects having ESI spectra fall outside the ACS field of view (Figure 1). A search of the HST archive revealed WFPC2 imaging in the F606W filter for three of these objects (S314, S427 and S490), with exposure times between 500 and 1200 seconds. These images were retrieved from the archive and reduced using standard WFPC2 reduction procedures. In order to clean the images of cosmic rays, we combined two images for each object using the WFPC.CRREJ task in IRAF, taking care not to alter the cores of the objects. Structural parameters for these objects were then derived using the same procedure as described above. Parameters were derived using two different PSF estimates: (1) a theoretical estimate for the F606W filter calculated with Tiny Tim software (Krist 1995); and (2) an empirical estimate of the PSF for the F555W filter based on archival observations (P.B. Stetson, private communication). Structural parameters obtained using the two different techniques were in good agreement, although the residuals were somewhat smaller in the latter case. The results presented in Table 7 are those obtained with the empirical F555W PSF. Two objects (S314 and S490) have pc. This is close to the mean for globular clusters in the Milky Way and just slightly larger than the average M87 globular cluster. The third object (S417) is considerably larger, with pc. Clusters of this size are rare in the Milky Way, but not entirely absent: for instance, among the 141 clusters with measured half-light radii (Harris 1996), ten objects (or 7% of the sample) have pc. On the other hand, nine of these ten objects are very faint, Palomar-type clusters, with . The tenth object is NGC 2419 which, as pointed out above, happens to be one of the most luminous clusters in the Milky Way (yet still a full order of magnitude fainter than S417).
For all DGTOs with HST imaging, we have calculated central velocity dispersions, , by correcting the observed values of to account for the blurring of the light profile within the spectrograph. We used the best-fit King model parameters obtained from our ACS and WFPC2 imaging, and convolved the corresponding King model surface brightness and velocity dispersion profiles with various Gaussian kernels to approximate the effects of ground-based seeing. The adopted kernel was taken to be that which produced a FWHM for each object which matched the FWHM measured along the ESI slit (see Table 2). We then determined the correction factor for each object needed to convert the measured dispersion to the true, central value. These correction factors were always %. The resulting values of are tabulated in the final columns of Tables 4 and 5.
6 Scaling Relations
Correlations between the physical properties of stellar systems hold important clues for understanding their formation and evolution (e.g., Kormendy 1985; Djorgovski 1993). Numerous studies of globular cluster scaling relations have shown them to be comparatively “simple” systems: i.e., well approximated by isotropic, equilibrium King models with a constant mass-to-light ratio of (see McLaughlin 2000 and references therein). By constrast, studies of other low-mass stellar systems, such as dE and dSph galaxies, indicate that dark matter or non-equilibrium dynamics must be important. For instance, Local Group dSph galaxies have (Mateo 1998) while intermediate values, , have been measured for a handful of dE,N galaxies, and their nuclei, in the Virgo Cluster (Geha et al. 2002; 2003). Meanwhile, Drinkwater et al. (2003) have reported central velocity dispersions of 24–37 km s-1 and -band mass-to-light ratios in the range 2–4 for five faint compact objects in the Fornax Cluster, and argued on this basis that they constitute a fundamentally different class of object from globular clusters. In this section, we investigate the scaling relations of our DGTOs and present a comparison with those of globular clusters and galaxies.
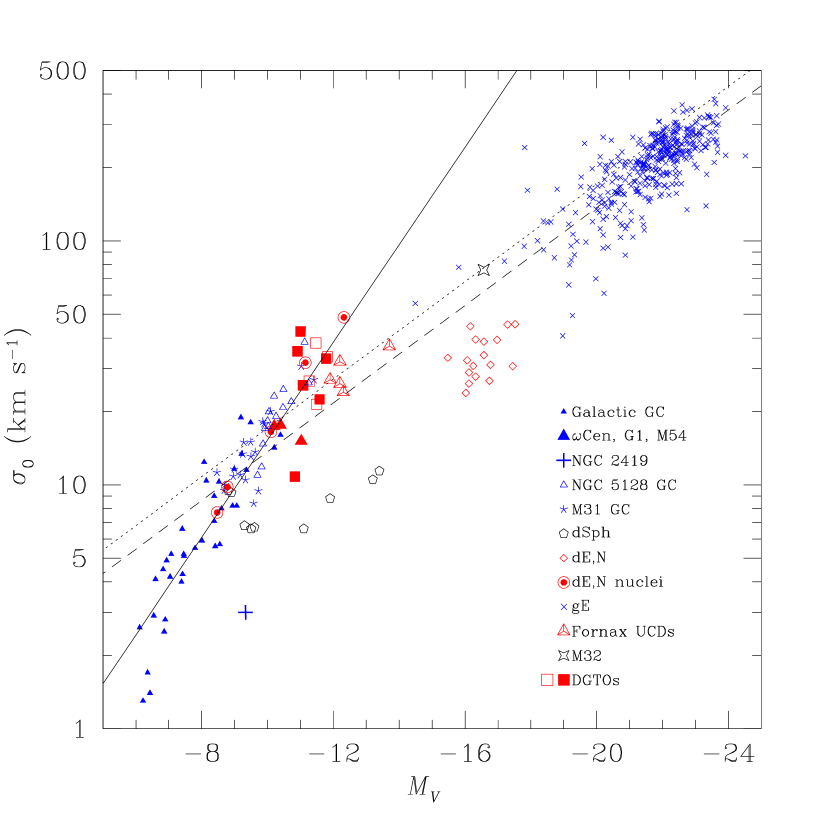
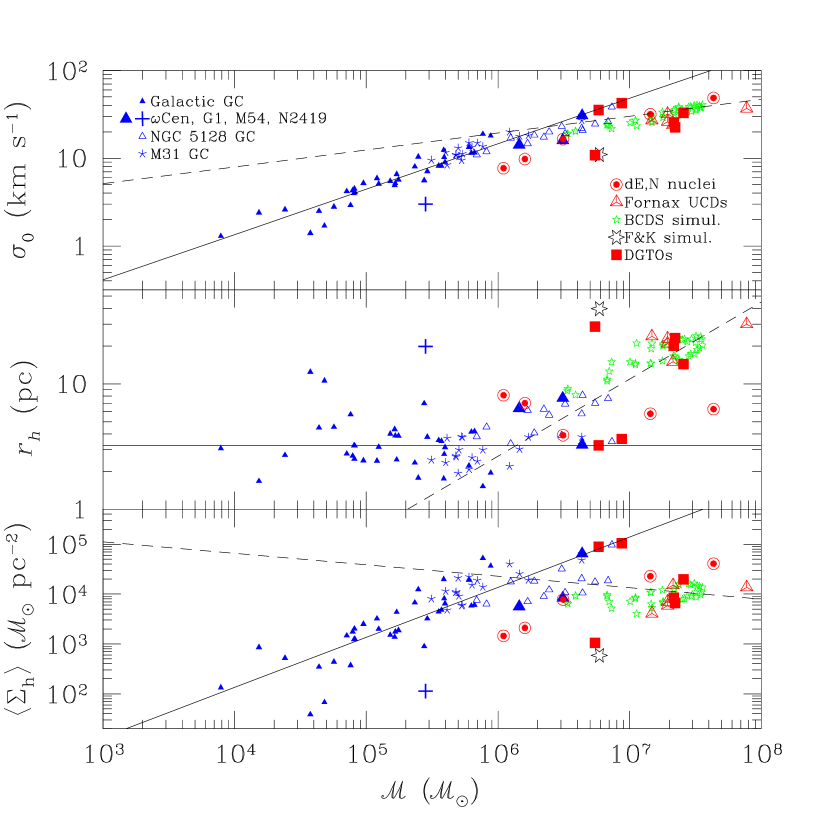
In the scaling relations shown in Figures 7–11, we plot the location of globular clusters belonging to the Galaxy (McLaughlin & van der Marel 2005), M31 (using the data collated in McLaughlin & van der Marel 2005, in preparation) and NGC 5128 (Martini & Ho 2004; Harris et al. 2002); Local Group dSph galaxies (Mateo 1998); Virgo dE,N galaxies and their nuclei (Geha et al. 2002; 2003); the UCDs in Fornax (Drinkwater et al. 2003); and the compact Local Group elliptical galaxy M32 (Mateo 1998; van der Marel et al. 1998; Graham 2002). Our DGTOs (with data from Tables 1, 4, 5, 7 and 8) are indicated by the large squares. The Local Group globular clusters Cen, G1 and M54 are indicated by the large filled triangles, while NGC 2419 is shown as the cross.
Figure 7 shows a particularly important scaling relation for hot stellar systems: central velocity dispersion versus absolute visual luminosity. The behavior of high-luminosity galaxies is indicated by the crosses, which show the bright ellipticals from Faber et al. (1989). The dashed line represents the Faber-Jackson (1976) relation obtained by fitting to the bright ellipticals ) and finding the slopes that minimize the residuals perpendicular to the best-fit line, to allow for error in both coordinates:
| (3) |
For comparison, the solid line shows the best-fit relation for Galactic globular clusters from McLaughlin & van der Marel (2005):
| (4) |
This relation also provides an adequate description of the globular clusters in M31 and NGC 5128, as well as the nuclei of dE,N galaxies in Virgo. With to , most of our program objects lie close to the intersection of these two scaling relations; certainly one cannot claim on the basis of this figure alone that the DGTOs are inconsistent with the globular cluster relation. We believe, that with the possible exception of UCD3 (the brightest object in the study of Drinkwater et al. 2003), this conclusion also applies to the compact objects in Fornax. Drinkwater et al. (2003) reported that they fall along the extrapolation of the Faber-Jackson relation; however, compared to Equation 3, the galaxy scaling relation shown in their Figure 3 overpredicts by 25% the central velocity dispersion at fixed luminosity. Figure 7 suggests that discriminating between bright globular clusters and bonafide UCDs based on their location in the - plane is difficult at best. Additional information (e.g., structural parameters and internal dynamical properties) is needed to distinguish globular clusters from UCDs in this luminosity range.
In Figure 8, we combine our , and measurements to show the Virial Theorem for low-mass stellar systems: . The lower dashed line in this panel shows the expected relation for a constant mass-to-light ratios of , the value appropriate for non-core-collapsed globular clusters in the Milky Way (McLaughlin 2000). The fact that the DGTOs lie above this relation suggests that this value may be inappropriate for these objects. Indeed, this relation appears to underpredict the mass-to-light ratios of systems brighter than . Anticipating the results of §7, the upper dashed line shows the scaling relation for , a relation which better describes the brighter DGTOs and provides a superior representation of the central nuclei in Virgo dE,N galaxies (Geha et al. 2002). The luminous globular clusters in NGC5128 (Martini & Ho 2004) and the majority of the Fornax UCDs (Drinkwater et al. 2003) appear to have intermediate mass-to-light ratios.
As is well known, elliptical galaxies fall along a two-dimensional surface in the parameter space defined by size, surface brightness and velocity dispersion (see Djorgovski 1994 for a review):
| (5) |
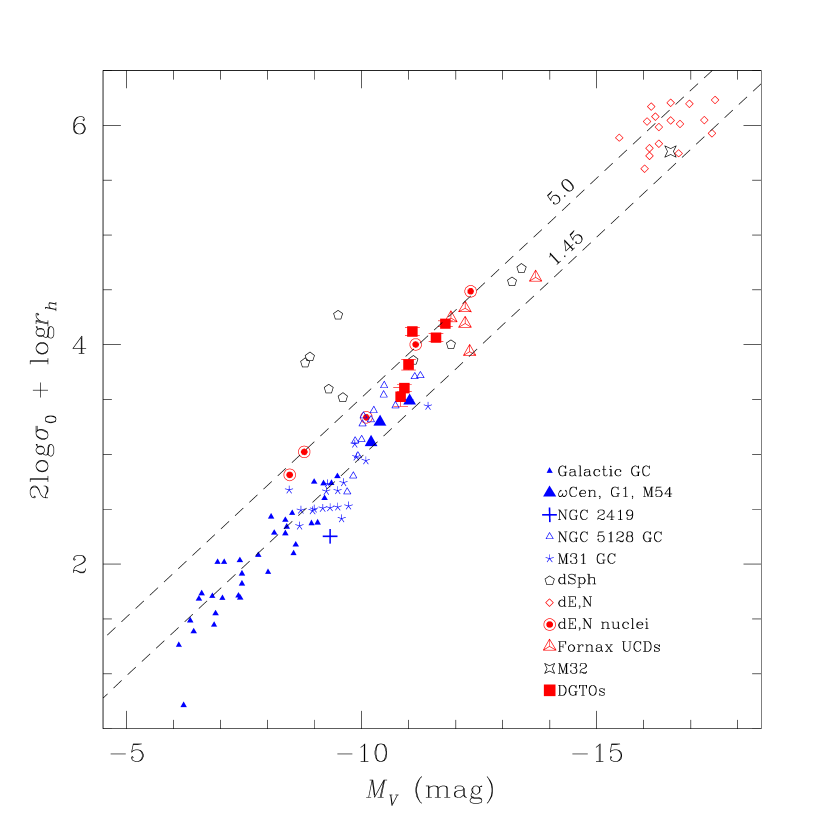
Analogs of this Fundamental Plane for globular clusters have been presented by Djorgovski (1995), and more recently, by McLaughlin (2000). Figure 9 shows these two representations of the globular cluster Fundamental Plane (upper and lower panels, respectively). The dashed line in the upper panel shows a least-squares fit for the Galactic globular clusters to the bivariate correlation, with from Djorgovski (1995):
| (6) |
In the lower panel, the dashed line indicates the expected relation if globular clusters obey a relation between binding energy and total luminosity, , which gives and
| (7) |
This relation, from McLaughlin (2000), accurately describes the globular clusters in the Milky Way (Djorgovski 1995), M31 (Barmby et al. 2002), NGC 5128 (Harris et al. 2002) and M33 (Larsen et al. 2002). It also provides an adequate description of the six objects from our survey, although there does appear to be a zeropoint offset of 0.2, in the sense that the DGTOs lie slightly above the dashed line. As discussed in Appendix A1 of McLaughlin (2000), the zeropoint of the line defined by Equation 7 depends on mass-to-light ratio, with . Thus, the observed tendency for the program objects to lie above the cluster relation — drawn here at a constant a mass-to-light ratio of 1.45 — suggests that some of the DGTOs have mass-to-light ratios which are 2-3 higher than globular clusters in the Milky Way. This same conclusion applies to the dE,N nuclei of Geha et al. (2002). As before, the majority of the UCDs in Fornax show a more modest enhancement in mass-to-light ratio relative to globular clusters in the Milky Way. This findings are consistent with conclusions based on Figure 7. Apart from the small zeropoint difference, the DGTOs show good agreement with the McLaughlin (2000) relation so we conclude that, as a class, they obey the Fundamental Plane defined by globular clusters.
7 Masses and Mass-to-Light Ratios
The mass-to-light ratio of a stellar system is important for understanding its nature and origin, offering insight into the underlying stellar populations, dark matter content, and even the extent to which the system is in virial equilibrium. For the six objects having measured velocity dispersions and structural parameters, we may derive masses using the King model approximation. The King mass, , is given by
| (8) |
(e.g., Dubath & Grillmair 1997) where is the gravitational constant, is central velocity dispersion and is the core radius. The parameters , and depend on the fitted King model, and were calculated through spline interpolation of the relations given in King (1966) and Peterson & King (1975). For , , and , we take the average of the measurements in and . Structural parameters used in the mass determinations are presented in Table 7.
Our results are presented in Table 8, which records object name, -band absolute magnitude and luminosity, mass and mass-to-light ratio. It is apparent that the mass-to-light ratios for our six DGTOs are higher (i.e., ) than the mean value of 1.450.1 for Galactic globular clusters, which is again consistent with expectations based on the bivariate correlations discussed in §6. We now turn to the question of whether these mass-to-light ratios require these DGTOs to have a fundamentally distinct nature from globular clusters. We begin by examining the scaling relations, as a function of dynamical mass, for low- and intermediate-mass stellar systems.
For bright elliptical galaxies, studies of the Fundamental Plane indicate a dependence between luminosity and mass-to-light ratio. Using the dynamical masses for elliptical galaxies given by van der Marel (1991), we find
| (9) |
where we have adopted km s-1 Mpc-1 and transformed his magnitudes into the band. Equation 9 is equivalent to
| (10) |
Combining this result with Equation 3 yields the relationship between galaxy mass and central velocity dispersion given below. Likewise, a fit to the bright ellipticals of Faber et al. (1989) gives
| (11) |
for the galaxy size-luminosity relation. With and known, one can calculate the mean mass density within the half-light (or half-mass) radius, , and its dependence on mass. Combining Equations 3, 10 and 11, one finds the following scaling relations for elliptical galaxies:
| (12) |
These relations, extrapolated into the low- and intermediate-mass regimes, are shown as the dashed lines in Figure 10. From top to bottom, this figure plots , and against for galaxies in the range .
For comparison, the solid lines in each panel show the best-fit relations for the Galactic globular cluster system:
| (13) |
where the second relation is the familiar result that globular clusters sizes are independent of luminosity. Observational data for the low- and intermediate-mass stellar systems shown in Figures 7-9 are plotted in Figure 10 with the same symbols. Note that, in the case of the Fornax UCDs, masses are not available on an individual basis, so we combine their visual magnitudes with the mean mass-to-light ratio of reported by Drinkwater et al. (2003) to estimate their masses. Figure 10 also shows the predicted properties of UCDs from two sets of numerical simulations: (1) those of Bekki et al. (2004), who explored the possibility that UCDs form through mergers of globular clusters within dwarf galaxies which then undergo tidal stripping; and (2) those of Fellhauer & Kroupa (2002), who modeled UCD formation as the amalgamation of young massive star clusters which form in gas-rich mergers. While these simulations are fully independent, in both cases the formation of UCDs is presumed to involve multiple mergers of star clusters.
Perhaps the most noteworthy feature of Figure 10 is the apparent presence of two separate families in this low-mass regime, with a transition at a few million solar masses; formally, the globular cluster and galaxy scaling relations cross at . This transition, which is reminiscent of that observed at in the Faber-Jackson and Virial Theorem scaling relations presented in Figures 7 and 8, takes the form of a change in slope, or a “break”, in the relation shown in the upper panel. That this truly represents a fundamental transition between two families of stellar systems is best seen in the middle panel of this figure: above , the size of an object increases in proportion to its mass, while below , globular clusters have a characteristic size of pc irrespective of mass. As a consequence, the relation shown in the lower panel shows a peak near . In other words, for globular clusters, increases with mass, while the converse is true of galaxies.
Focusing on the six DGTOs shown in Figure 10, we see that two objects (S314 and S490) lie on the extrapolation of the relation for globular clusters and have sizes of pc. As a result, they also lie along the extrapolation of the globular cluster relation shown in the lower panel. On this basis, these two objects should probably be considered globular clusters, albeit ones of unusually high mass and luminosity.
Three additional objects (S417, S928 and S999) fall along the galactic scaling relations in all three panels. Although the distinction between the globular cluster and galaxy scaling relations is modest in terms of velocity dispersion, there is a clear separation in terms of and . In general, these objects occupy roughly the same positions in the , and planes as the simulated UCDs of Bekki et al. (2003). As such, they must be considered prime UCD candidates.
The sixth and final DGTO, H8005, presents more of a puzzle. It falls below both the globular cluster and galaxy relations in the plane and, with pc is larger than one would expect for a globular cluster, or a dwarf galaxy, at a mass of . Moreover, it is an extreme outlier in the plane, with a mean half-mass density that is roughly an order of magnitude lower than any other object in our sample. Interestingly, this object bears a striking resemblance to the E01 simulation of Fellhauer & Kroupa (2002) at an age of 10 Gyr. If this agreement is not merely coincidental, then H8005 may represent the remains of a “stellar supercluster” which formed through the multiple mergers of young massive clusters in the distant past. Based on the available evidence, we provisionally classify H8005 as a UCD, but note that its structural properties may be fundamentally different from those of S417, S928 and S999.
Taken together, the scaling relations in Figure 10 offer hope for distinguishing globular clusters from UCDs in this low-mass regime. As an additional aid in classifying DGTOs, we now turn our attention to their measured mass-to-light ratios.
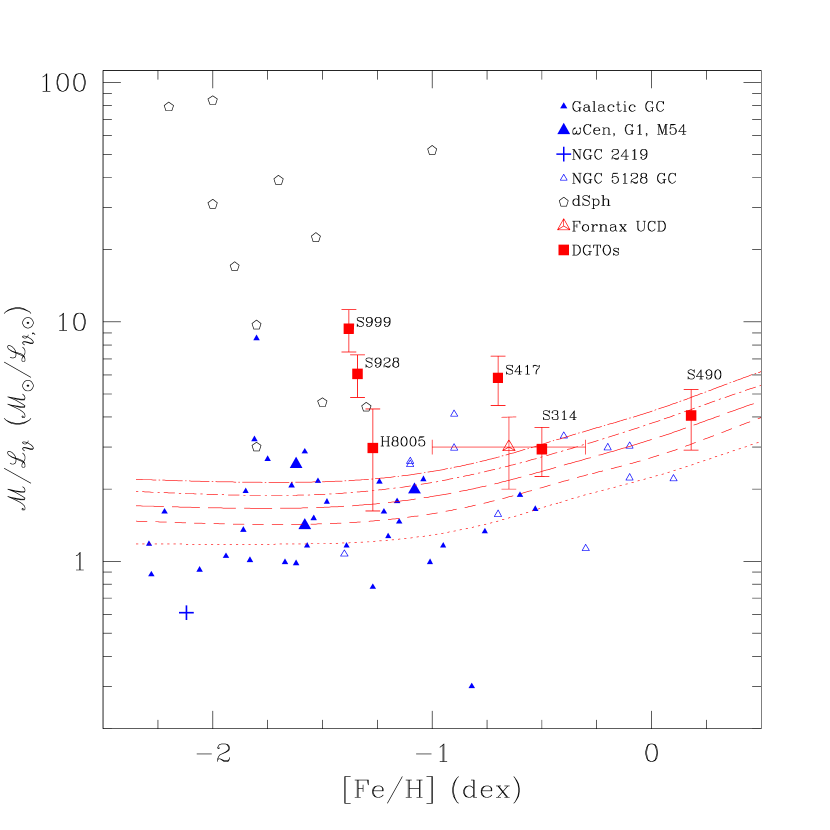
At fixed age, the mass-to-light ratio of a stellar system depends on its metal abundance, with increasing towards higher [Fe/H]. Mass-to-light ratios and metallicities are available for six DGTOs in our sample (see Tables 1 and 8). Figure 11 plots mass-to-light ratio versus metallicity for these objects, along with those of globular clusters in the Milky Way and NGC 5128 (with Cen, G1 and M54 indicated by the large triangles), and Local Group dwarf spheroidal galaxies. The large open triangle in this figure shows the mean location of the Fornax UCDs, which have (Drinkwater et al. 2003). We have estimated crude metallicities for these objects by combining the mean colors of and reported by Karick et al. (2003) with the respective color-metallicity relations of Couture et al. (1990) and Kissler-Patig et al. (1998). This yields [Fe/H] and [Fe/H]; we consequently adopt [Fe/H] for the Fornax UCDs.
The five curves show theoretical predictions for the dependence of mass-to-light ratio on metallicity, according to the population synthesis models of Bruzual & Charlot (2003) with the disk-star initial mass function of Chabrier (2003). Curves show the expected behavior for single-burst populations with ages of 7, 9, 11, 13 and 15 Gyr.
In accordance with the preceding discussion, all six DGTOs are seen to have mass-to-light ratios larger than the average value of 1.45 for Galactic globular clusters. At first glance, this might appear surprising since our sample includes two objects, S314 and S490, which we have argued above are probably globular clusters. However, the higher mass-to-light ratios of these objects ( 3–4) are perfectly consistent with the model predictions since these are also the two most metal-rich objects in our small sample. Similarly, the mass-to-light ratios of = 2–4 reported by Drinkwater et al. (2003) for the compact Fornax objects are also consistent with model predictions for old globular clusters with [Fe/H] . In other words, mass-to-light ratios alone provide no justification for the classification of these objects as UCDs.
On the other hand, three objects (S417, S928 and S999) are found to have mass-to-light ratios in the range . Mass-to-light ratio this large are much more difficult to explain in terms of age and metallicity effects. Indeed, for no age/metallicity combination is it possible to produce mass-to-light ratios as large as (as is the case for S999) without resorting to extreme initial mass functions (see below). Whether this indicates the presence of dark matter in these systems, or that the fundamental assumption of virial equilibrium underlying Equation 8 is invalid, remains to be seen. At the very least, it is clear that their mass-to-light ratios set these objects apart from normal globular clusters. It is also worth noting that their mass-to-light ratios appear to more closely resemble those measured for Virgo dE,N galaxies (with a median value in the band of 5.5; Geha et al. 2002) than for globular clusters.
Finally, the measured mass-to-light ratio for H8005, , is slightly larger that predicted by the population synthesis models for a globular cluster at this metallicity although the discrepancy is not statistically significant given the measurement errors. This observation is again consistent with the stellar supercluster scenario of Fellhauer & Kroupa (2002) who note that, after 10 Gyr of stellar fading with no morphological evolution, their merged superclusters should have mass-to-light ratios identical to those of normal star clusters at this age (and metallicity).
All in all, Figure 11 reinforces the DGTO classifications presented above. To summarize, we divide our sample of six DGTOs into three categories:
-
1.
Two probable globular clusters: S314 and S490
-
2.
Three probable UCDs: S417, S928 and S999
-
3.
One possible UCD: H8005.
The question remains, however, as to why the mass-to-light ratios of the probable UCDs resemble those of dwarf nuclei and, indeed how such mass-to-light ratios might arise in the first place. In the galaxy threshing scenario, the mass-to-light ratios of UCDs should mimic those of the dE,N nuclei, which does indeed seem to be the case. On the other hand, the dE,N nuclei are taken to be baryon dominated at all times in the simulations of Bekki et al. (2001). Simply stated, a physical explanation for the high mass-to-light ratios observed for the most probable UCDs is lacking, although some possibilities exist (e.g., the truncation of the initial mass function during starbursts; Charlot et al. 1993). We shall return to the issue of dE,N nuclei in a future paper in this series.
8 A Search for Additional DGTOs in the ACS Virgo Cluster Survey
Obviously, it is of interest to know if there are additional DGTOs in the ACS Virgo Cluster Survey, either in M87 or belonging to other program galaxies. We have searched our object catalogs for the complete sample of 100 galaxies, selecting candidate DGTOs on the basis of magnitude, half-light radius and color. Guided by the location of the DGTOs in Figure 6, we adopt
| (14) |
where the condition on is required in both bands. In addition, we restrict the dereddened color to the range
| (15) |
which is appropriate for globular clusters and dwarf galaxies having normal stellar populations (see Figures 5 and 6 of Paper I). At the same time, this color selection minimizes the number of high-redshift elliptical galaxies which fall into the sample.
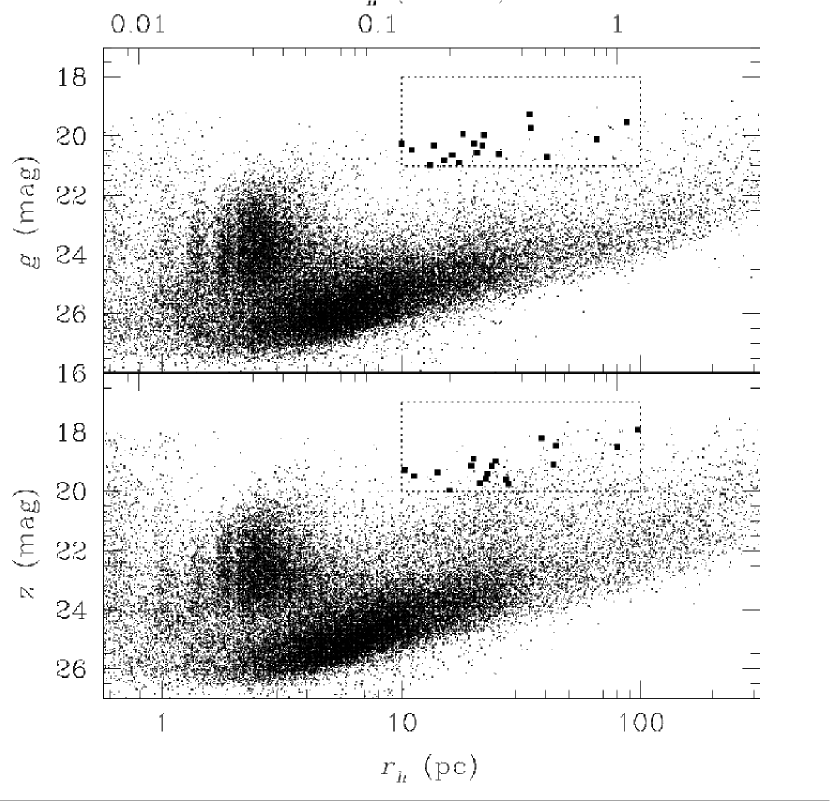
Among the 7 sources in the catalog, 27 objects satisfied the criteria specified by Equations 14 and 15. Each of these objects was inspected visually. Nine were found to be obvious background galaxies or spurious detections such as small-scale enhancements in rings or shells. The 18 remaining objects — which include the three DGTOs from Figure 2 — we consider to be DGTO candidates. They are shown in the -magnitude planes in Figure 12 as the large squares where we have now assumed a common distance of 16.5 Mpc for all galaxies. Small symbols in this figure show all sources from the ACS Virgo Cluster Survey. Generally speaking, three types of sources appear in this figure: Galactic field stars with pc; globular clusters with mean 2-3 pc, and ; and background galaxies, which occupy a diagonal sequence of faint objects beginning at pc and extended up to pc. The dashed region indicates the selection criteria given by Equation 14.
The properties of the 18 DGTO candidates plotted in this figure are summarized in Table 9, whose first column records an identification number composed of the VCC number of the host galaxy and a counter specifying an order number for candidates residing in the same galaxy. Columns 2–9 give other names for these objects, their coordinates, magnitudes, colors, half-light radii and concentration indices. The final three columns record any published radial velocity measurements (either from Table 4, Hanes et al. 2001, or Côté et al. 2003), distance moduli from our own surface brightness fluctuation (SBF) measurements (see below), and comments on their nature.
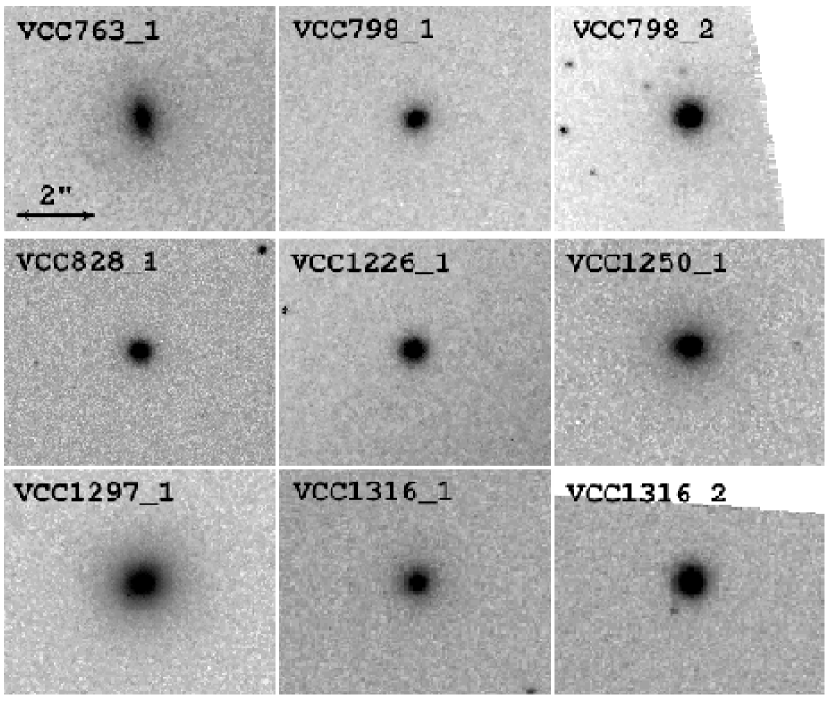
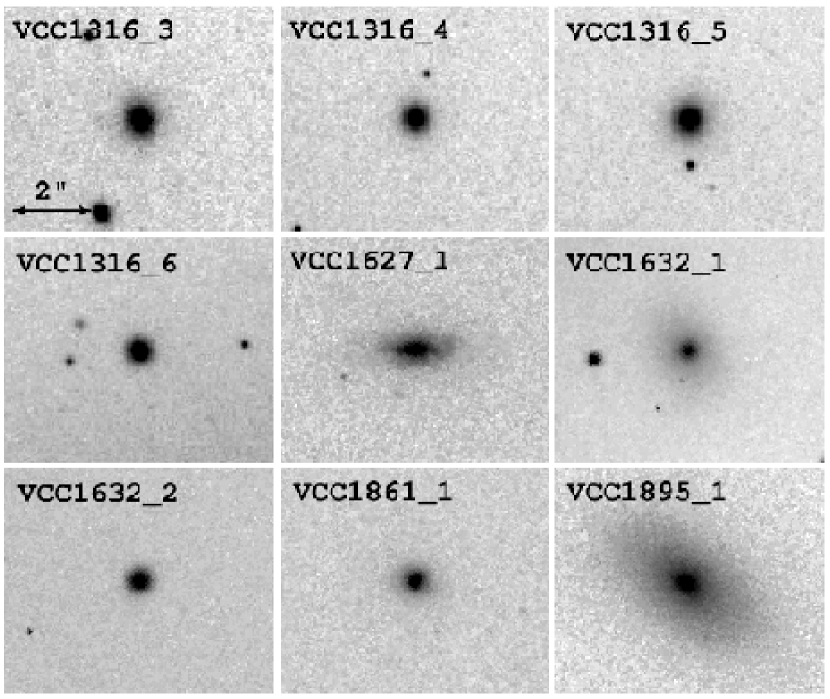
Figure 13 and 14 show the appearance of the 18 DGTOs in our F475W images. The line in the first panel of each figure has a length of 2″, highlighting their compact nature. Although our selection criteria should eliminate the majority of background galaxies, it is likely that at least some of these objects are early-type galaxies at high and intermediate redshift. To gauge the extent of this contamination, we have searched the object catalogs generated from 17 control fields for the ACS Virgo Cluster Survey, which are based on images collected from the HST archive and reduced with the same reduction pipeline used for the survey itself (see Paper II). Observations in these fields were carried out using the same filters as the Virgo program, and the combined images have comparable depths and drizzling strategies (see Peng et al. 2005 for details). Selecting objects on the basis of Equations 14 and 15, we find only two objects which would qualify as DGTO candidates, one of which can immediately be classified as a background galaxy based on its visual appearance. Since our control fields cover an area (17/100) 1/6th that of the Virgo fields, we expect 6 of the DGTO candidates listed in Table 9 to be background galaxies.
It is possible to determine which of the 18 candidates in Table 9 are true DGTOs by using additional information, such as radial velocities and/or distances, to test for membership in Virgo. For seven objects in Table 9, radial velocities are available either from the literature or from this study. Six of these objects, which were included in radial velocity surveys of the globular cluster systems of VCC1226 (M49; Côté et al. 2003) and VCC1316 (M87; Hanes et al. 2001; Côté et al. 2001), can be classified unambiguously as members of the Virgo Cluster. The redshift of the seventh object (VCC1316_1 = S1063) reveals it to be a definite background galaxy (Huchra & Brodie 1987).
An alternative means of establishing membership is through distances. The ACS Virgo Cluster Survey has been designed, in part, to provide accurate SBF distances for our program galaxies (see Mei et al. 2005a; b; Papers IV and V). Needless to say, applying the SBF technique to the DGTOs candidates is challenging because of their compact sizes (which render the observable fluctuations to spatial scales comparable to the PSF), the contamination of their fluctuations from the adjacent galaxy, and the statistical uncertainties involved in calibrating their stellar populations. Nevertheless, we were able to measure crude SBF magnitudes, , for 14 of the DGTO candidates in Table 9. Although the errors on these measurements are of order 0.5 mag, they are sufficient to discriminate between the competing scenarios of a dwarf galaxy or globular cluster residing in Virgo and a giant elliptical lying well in the background. For instance, for dwarf ellipticals in Virgo, whereas for Virgo giants fall in the range 29–30 mag (Paper V). Thus, candidates with fluctuation magnitudes can be classified with some confidence as non-members of Virgo, although in such cases, the measurements should be considered lower limits. It is reassuring that memberships established from radial velocities and SBF measurements are in agreement in every case where both methods could be applied (VCC1316_1, VCC1316_2, VCC1316_3 and VCC1316_4).
Considering both the radial velocity and SBF measurements, we conclude that nine of the 18 objects in Table 9 are certain members of Virgo; four additional objects are classified as possible members. We consider the remaining five objects to be certain or probable background galaxies. Figure 15 shows the color distribution of all 18 objects. It is clear that the confirmed DGTOs (i.e., those classified as certain members of Virgo) comprise a rather homogeneous population in terms of color, with 0.88 1.18. If these DGTOs are old (i.e., with ages greater than a few Gyr), then their colors point to low to intermediate metallicities: [Fe/H] dex (see Figure 5 of Paper I). This estimate is consistent with the generally low metallicities found for S999, S928 and H8005 from independent photometry and spectroscopy (see Table 1). In any case, Figure 15 suggests that the relatively narrow color range of the certain DGTOs may be used to guide the membership classifications for those objects lacking radial velocities and SBF measurements. The final column of Table 9 summarizes our conclusions regarding the nature of each object, and the criteria used to establish membership (i.e., radial velocities, SBF measurements, or colors).
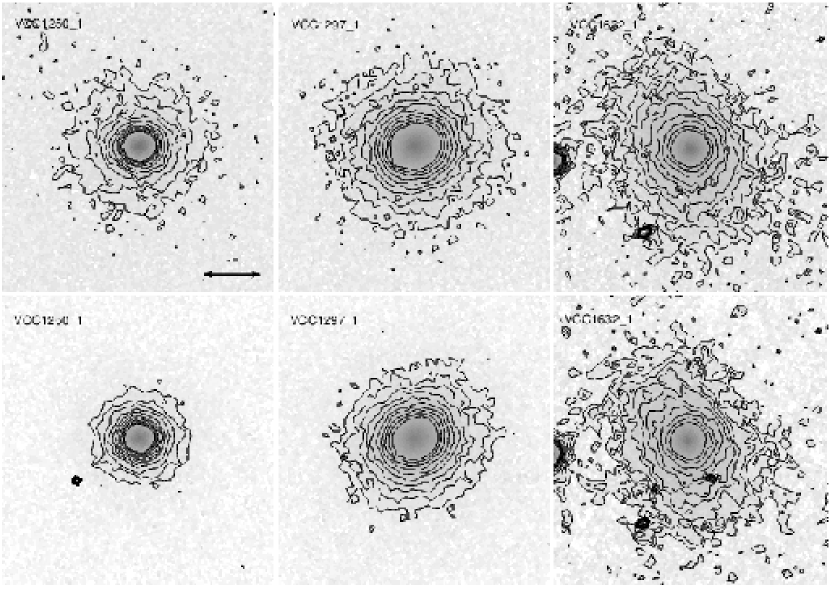
Three of the 13 certain or possible DGTOs merit special attention: VCC1250_1, VCC1297_1 and VCC1632_1. Figure 16, reveals that each of these objects has a surrounding halo of diffuse light. These objects appear to be similar to UCD3, the brightest of the compact objects in Fornax, which Drinkwater et al. (2001) have suggested is surrounded by a low-surface brightness envelope. Unfortunately, for none of the three Virgo objects is a radial velocity available. Moreover, the measurements for VCC1250_1 and VCC1297_1 are 1 mag larger than one might expect for old, metal-poor dwarfs within Virgo. The significance of this result, however, is unclear given the large measurement errors. In addition, if they are really distant background galaxies, then it would be surprising to find colors which so closely resemble those of the confirmed DGTOs. We conclude that a definitive conclusion regarding membership is not possible for these two objects. On the other hand, the SBF distance for VCC1632_1 clearly points to membership in Virgo. It is perhaps worth noting that, with , it would be the reddest of the confirmed DGTOs in our sample. Clearly, spectroscopy for all three of these objects is urgently needed; if they are truly Virgo members, their diffuse envelopes would provide irrefutable evidence of a direct link between the nuclei of low-surface brightness dwarfs and at least some DGTOs. Moreover, the diffuse light surrounding VCC1632_1 is noteworthy in that the intensity contours become increasingly flattened with radius, and may even show a hint of isophotal twisting. If this is the case, then VCC1632_1 may be a DGTO that is currently forming through the tidal stripping of a nucleated dwarf galaxy. Spectroscopy of this object would be extremely interesting: to settle the issue of membership and, if it is found to reside in Virgo, to search for the ordered motions that are expected to accompany tidal stripping (Piatek & Pryor 1995).
The nine certain DGTOs in Table 9 are associated with four different galaxies: VCC798 (M85) (2), VCC1226 (M49) (1), VCC1316 (M87) (5) and VCC1632 (M89) (1). It is remarkable that five of the objects, or 56% of the sample, are associated with a single galaxy (M87). If we consider both the certain and possible DGTOs, the overabundance still remains: 5/13, or of the sample. But how surprising is this excess? After all, M87 is unique among Virgo galaxies in several respects: it is one of the brightest members of Virgo, it has both a remarkably rich globular cluster system (McLaughlin et al. 1994) and a cD envelope (de Vaucouleurs & Nieto 1978), it is located close to Virgo’s center as traced by the cluster X-ray emission (Gorenstein et al. 1977), and it is roughly centered inside the “core” of the galaxy surface density profile (Binggeli et al. 1987). To understand how the properties of M87 (along with the three other galaxies containing confirmed DGTOs) may promote or inhibit the formation of DGTOs, we compare in Figure 17 their fraction of the total DGTO population, , to those for other tracer components:
-
1.
: The fraction of the blue luminosity contributed by each galaxy, , to the total of the ACS Virgo Cluster Survey sample, .
-
2.
: The fraction of the total globular cluster population from the ACS Virgo Cluster Survey, 1.3104, that is associated with an individual galaxy, . We consider globular clusters to be those objects with probability indices, , in the range (see Peng et al. 2005 for details).
-
3.
: The number of early-type member galaxies, , from the Virgo Cluster Catalog (Binggeli et al. 1985) which have and are located within 15 of each galaxy, normalized by the total number of such galaxies in Virgo, .222Since VCC798 lies 1/3 deg. from the boundary of region surveyed by Binggeli et al. (1985), the calculated value of for this galaxy should be viewed as a lower limit.
Figure 17 reveals that the number of DGTOs associated with M87 far exceeds that expected based on its luminosity, the size of its globular cluster system, and the local surface density of dwarf galaxies. For instance, M49 is comparably luminous ( versus 0.10 for M87) and its globular cluster system is about half as large as that of M87. Nevertheless, the number of DGTOs associated with M87 is five times that for M49. We suspect that unique location of M87 — i.e., sitting at the bottom of the gravitational potential well defined by Virgo and itself, and near the centroid of the dwarf galaxy population in Virgo; Binggeli et al. (1987); Côté et al. (2001) — must play a role in the origin of this excess. However, it seems clear that the total number of DGTOs is modest compared to the enormous M87 globular cluster system, and that they have virtually no effect on its overall properties such as specific frequency.
Finally, we note a curious result from our search for DGTOs in Virgo. Five of the nine certain DGTOs — selected from thousands of objects in 100 fields covering an area of 1100 arcmin2 — are located in a single 2 arcmin2 region within the northwest quadrant of the M87 field. This field happens to lie along the “principal axis” of the Virgo Cluster, which follows the major axis of M87 (and its globular cluster system) on small scales and is defined by the large-scale distribution of galaxies further out (Binggeli et al. 1987; West & Blakeslee 2000). Kinematical studies of Virgo/M87, focussing on its dwarf galaxies and X-ray-emitting gas (Binggeli 1999) and globular clusters (Côté et al. 2001), suggest that the population of dwarf galaxies in Virgo is probably not yet in equilibrium, with galaxies currently infalling along the principal axis. The DGTOs in M87 may thus provide indirect evidence for an evolutionary link to the predominantly low- and intermediate-luminosity galaxies which define this structure.
9 Summary
Motivated by the discovery of a population of faint, compact objects in the Fornax Cluster, we have carried out a detailed study of similar objects in Virgo, selected from ground-based studies of the M87 globular cluster system and imaging from the ACS Virgo Cluster Survey. In terms of luminosity, the “dwarf globular transition objects” which are the focus of this study occupy a luminosity regime which is populated by the brightest known globular clusters and the faintest dE galaxies. While it is perhaps not surprising that we find our sample to include both globular clusters and UCDs, our analysis has shown that extreme care must be exercised to distinguish UCDs from globular clusters in this luminosity range.
Among the six DGTOs in our sample which have measured dispersions, structural parameters and mass-to-light ratios, we find two to be massive, but otherwise normal, globular clusters. The four remaining objects we classify as probable or possible UCDs based on their metallicities, large sizes, and higher mass-to-light ratios. This latter parameter is found to be a particularly powerful tool for identifying UCDs. In terms of mass-to-light ratio, our UCDs resemble the nuclei of dE,N galaxies in Virgo, for which Geha et al. (2002) have measured 5. Assuming the fundamental assumption of virial equilibrium to be valid for the UCDs and dwarf nuclei, their mass-to-light ratios cannot be explained by simple stellar population differences. Rather, it appears that dark matter halos are needed to account for the measured mass-to-light ratios.
Extrapolating down from the scales of luminous elliptical galaxies, we find both the dwarf nuclei and UCDs to obey the galactic scaling relations (i.e., those involving mass, central velocity dispersion, half-light radius and mass surface density). This suggests a connection between the two populations, most obviously through the removal of low-surface brightness envelopes in dE,Ns by tidal stripping. Moreover, if the principal characteristic that distinguishes UCDs and dwarf nuclei from globular clusters is the presence of a dark matter halo, then this would naturally lead to a different set of scaling relations. A search for additional DGTOs in the ACS Virgo Cluster Survey has revealed 13 certain or possible DGTO candidates; three of these objects show some evidence for diffuse envelopes, although in no case can membership be established unambiguously at this time. Taken together, the assembled evidence is consistent with the formation of at least some UCDs through galaxy threshing (Bekki et al. 2001). At the same time, one UCD in our sample (H8005) is found to have properties which agree remarkably well with the predictions of UCD formation through multiple mergers of young massive star clusters (Fellhauer & Kroupa 2002). This suggests that there may well exist multiple formation routes for UCDs.
Certainly the overabundance of DGTOs associated with M87 — which contains about half of the total number of DGTOs uncovered in our survey of Virgo galaxies — suggests that proximity to the gravitational center of Virgo must play a key role in their formation. Remarkably, five of the 13 DGTOs uncovered in our survey of Virgo happen to lie within a single 2 arcmin2 region in the northwest quandrant of our M87 field. Keck spectroscopy is available for three of these five, and an analysis of their structural and dynamical properties reveals each of them to be a probable or possible UCD. It seems clear, however, that UCDs make up only a minute portion of the M87 globular cluster system and have virtually no effect on its overall properties.
Some obvious followup studies present themselves. Spectroscopy for our sample of candidate DGTOs in Virgo would be desirable, first and foremost to establish membership, but also to obtain velocity dispersions, metallicities and mass-to-light ratios needed to distinguish UCDs from globular clusters. In addition, the detection of low-surface brightness material surrounding UCDs would help bolster the case for an evolutionary link with nucleated galaxies. In this regard, new and better photometric, structural and dynamical data for dE,N galaxies and their nuclei would provide an invaluable point of comparison.
References
- Barlow & Sargent (1997) Barlow, T.A., & Sargent, W.L.W. 1997, AJ, 113, 136
- Barmby et al. (2002) Barmby, P., Holland, S., & Huchra, J.P. 2002, AJ, 123, 1937
- Bassino et al. (1994) Bassino, L.P., Muzzio, J.C., & Rabolli, M. 1994, ApJ, 431, 634
- Bekki et al. (2001) Bekki, K., Couch, W.J., & Drinkwater, M.J. 2001, ApJ, 552, L105
- Bekki et al. (2003) Bekki, K., Couch, W.J., Drinkwater, M.J., & Shioya, Y. 2003, MNRAS, 344, 399
- Bekki & Freeman (2003) Bekki, K., & Freeman, K.C. 2003, MNRAS, 346, 11
- Bekki et al. (2004) Bekki, K., Couch, W.J., Drinkwater, M.J., Shioya, Y. 2004, ApJ, 610, 13
- Bender (1990) Bender, R. 1990, A&A, 229, 441
- Bender et al. (1991) Bender, R., Paquet, A., & Nieto, J.-L. 1991, A&A, 246, 349
- Bender et al. (1994) Bender, R., Saglia, R., & Gerhard, O. 1994, MNRAS, 269, 785
- Binggeli et al. (1985) Binggeli, B., Sandage, A., & Tammann, G.A. 1985, AJ, 90, 1681
- Binggeli et al. (1987) Binggeli, B., Tammann, G.A., & Sandage, A. 1987, AJ, 94, 251
- Binggeli (1999) Binggeli, B. 1999, in Ringberg Workshop, The Radio Galaxy Messier 87, ed. H.-J. Röser & K. Meisenheimer (Berlin: Springer), 9
- Bruzual & Charlot (2003) Bruzual, G. & Charlot, S. 2003, MNRAS, 344, 1000
- Capellari & Emsellem (2004) Capellari, M., & Emsellem, E. 2004, PASP, 116, 138
- Chabrier (2003) Chabrier, G. 2003, PASP, 115, 763
- Charlot et al. (1993) Charlot S., Ferrari, F., Mathews, G.J., & Silk, J. 1993, ApJ, 419, L57
- Cohen & Ryzhov (1997) Cohen, J.G., & Ryzhov, A. 1997, ApJ, 486, 230
- Cohen et al. (1998) Cohen, J.G., Blakeslee, J.P., & Rhyzov, A. 1998, ApJ, 496, 808
- Cohen et al. (2003) Cohen, J.G., Blakeslee, J.P., & Côté, P. 2003, ApJ, 592, 866
- Côté et al. (2001) Côté, P., McLaughlin, D.E., Hanes, D.A., Bridges, T.J., Geisler, D., Merritt, D., Hesser, J.E., Harris, G.L.H., & Lee, M.G. 2001, ApJ, 559, 828
- Côté et al. (2003) Côté, P., McLaughlin, D.E., Cohen, J.G., & Blakeslee, J.P. 2003, ApJ, 591, 850
- Côté et al. (2004) Côté, P., Blakeslee, J.P., Ferrarese, L., Jordán, A., Mei, S., Merritt, D., Milosavljević, M., Peng, E., Tonry, J.L., & West, M.J. 2004, ApJS, 153, 223 (Paper I)
- Couture et al. (1990) Couture, J., Harris, W.E., & Alwright, J.W.B. 1990, ApJ, 73, 671
- Deady et al. (2002) Deady, J.H., Boyce, P.J., Phillipps, S., Drinkwater, M.J., Karick, A., Jones, J.B.; Gregg, M.D., & Smith, R.M. 2002, MNRAS, 336, 851
- de Vaucouleurs & Nieto (1978) de Vaucouleurs, G., & Nieto, J.-L. 1978, ApJ, 220, 449
- Djorgovski (1993) Djorgovski, S.G. 1993a, in The Globular Cluster – Galaxy Connection, eds. G. Smith & J. Brodie, ASPCS, 48, 496
- Djorgovski (1994) Djorgovski, S. 1994, in Ergodic Concepts in Stellar Dynamics, ed. V.G. Gurzadyan & D. Pfenniger (Berlin: Springer), p. 5
- Djorgovski (1995) Djorgovski, S. 1995, ApJ, 438, L29
- Drinkwater et al. (1999) Drinkwater, M.J., Phillipps, S., Gregg, M.D., Parker, Q.A., Smith, R.M., Davies, J.I., Jones, J.B., Sadler, E.M. 1999, ApJ, 511, L97
- Drinkwater et al. (2000) Drinkwater, M. J., Phillipps, S., Jones, J. B., Gregg, M. D., Deady, J. H., Davies, J. I., Parker, Q. A., Sadler, E. M., & Smith, R. M. 2000, A&A, 355, 900
- Drinkwater et al. (2001) Drinkwater, M.J., Gregg, M.D., & Colless, M.M. 2001, ApJ, 548, L139
- Drinkwater et al. (2003) Drinkwater, M.J., Gregg, M.D., Hilker, M., Bekki, K., Couch, W.J., Ferguson, H.C., Jones, J.B., & Phillipps, S. 2003, Nature, 423, 519
- Dubath & Grillmair (1997) Dubath, P., & Grillmair, C.J. 1997, A&A, 321, 379
- Faber & Jackson (1976) Faber, S., & Jackson, R. 1976, ApJ, 204, 668
- Faber et al. (1989) Faber, S.M., Wegner, G., Burstein, D., Davies, R.L., Dressler, A., Lynden-Bell, D., & Terlevich, R.J. 1989, ApJS, 69, 763
- Fellhauer & Kroupa (2002) Fellhauer, M., & Kroupa, P. 2002, ApJ, 124, 2006
- Ford et al. (1998) Ford, H.C. et al. 1998, Proc. SPIE, 3356, 234
- Freeman (1990) Freeman, K.C 1990, in Dynamics and Interactions of Galaxies, ed. R. Wielen, (Berlin: Springer), p. 36
- Freeman (1993) Freeman, K.C 1993, in ASP Conf. Ser. 48, The Globular Cluster-Galaxy Connection, 608
- Geha et al. (2002) Geha, M., Guhathakurta, P., & van der Marel, R.P. 2002, AJ, 124, 3073
- Geha et al. (2003) Geha, M., Guhathakurta, P., & van der Marel, R.P. 2003, AJ, 126, 1794
- Geisler & Forte (1990) Geisler, D., & Forte, J.C. 1990, AJ, 350, L5
- Gnedin et al. (2002) Gnedin, O.Y., Zhao, H., Pringle, J.E., Fall, S.M., Livio, M., & Meylan, G. 2002, ApJ, 568, L23
- Gorenstein et al. (1977) Gorenstein, P., Fabricant, D.; Topka, K.; Tucker, W.; Harnden, F.R. 1977, ApJ, 216, L95
- Graham (2002) Graham, A.W. 2002, ApJ, 568, L13
- Hanes et al. (2001) Hanes, D.A., Côté, P., Bridges, T.J., McLaughlin, D.E., Geisler, D., Harris, G.L.H., Hesser, J.E., & Lee, M.G. 2001, ApJ, 559, 812
- Harris (1996) Harris, W.E. 1996, AJ, 112, 1487
- Harris et al. (2002) Harris, W.E., Harris, G.L.H., Holland, S.T., & McLaughlin, D.E. 2002, AJ, 124, 1435
- Hilker et al. (1999) Hilker, M., Infante, L., Vieira, G., Kissler-Patig, M., & Richtler, T. 1999, A&AS, 134, 75
- Huchra & Brodie (1987) Huchra, J., & Brodie, J. 1987, AJ, 93, 779
- Jordán et al. (2004a) Jordán, A., Blakeslee, J.P., Peng, E., Côté, P., Ferrarese, L., Mei, S., Merritt, D., Milosavljević, M., Tonry, J.L., & West, M.J. 2004a, ApJS, 154, 509 (Paper II)
- Jordán et al. (2004b) Jordán, A., Côté, P., Ferrarese, L., Blakeslee, J.P., Mei, S., Merritt, D., Milosavljević, M., Peng, E., Tonry, J.L., & West, M.J. 2004b, ApJ, 613, 279 (Paper III)
- Karick et al. (2003) Karick, A.M., Drinkwater, M.J., & Gregg, M.D. 2003, MNRAS, 344, 188
- King (1966) King, I.R. 1966, AJ, 71, 61
- Krist (1995) Krist, J. E. 1995, “WFPC2 Ghosts, Scatter, and PSF Field Dependence,” in Calibrating Hubble Space Telescope: Post Servicing Mission, eds. A. Koratkar and C. Leitherer, p. 311
- Kissler-Patig et al. (1998) Kissler-Patig, M., Brodie, J.P., Schroder, L.L., Forbes, D.A., Grillmair, C.J., & Huchra, J.P. 1998, AJ, 115, 105
- Kormendy (1985) Kormendy, J. 1985, ApJ, 295, 73
- Larsen et al. (2002) Larsen, S.S., Brodie, J.P., Sarajedini, A., & Huchra, J.P. 2002, AJ,124, 2615
- Martini & Ho (2004) Martini, P., & Ho, L.C. 2004, ApJ, 610, 233
- Mateo et al. (1993) Mateo, M., Olszewski, E., Pryor, C., Welch, D.L., & Fisher, P. 1993, AJ, 105, 510
- Mateo (1998) Mateo, M. 1998, ARAA 36, 435
- McLaughlin (1999) McLaughlin, D.E. 1999, ApJ, 512, L9
- McLaughlin (2000) McLaughlin, D.E. 2000, AJ, 539, 618
- McLaughlin et al. (1994) McLaughlin, D.E, Harris, W.E., & Hanes, D.A. 1994, ApJ, 422, 486M
- McLaughlin & van der Marel (2005) McLaughlin, D.E, & van der Marel, R.P. 2005, ApJS, submitted
- Meylan et al. (2001) Meylan, G., Sarajedini, A., Jablonka, P., Djorgovski, S.G., Bridges, T., & Rich, R.M. 2001, AJ, 122, 830
- Mei et al. (2005a) Mei, S., Blakeslee, J.P., Tonry, J.L., Jordán, A., Peng, E.W., Côté, P., Ferrarese, L., Merritt, D., Milosavljevic, M., & West, M.J. 2005a, ApJ, in press (Paper IV)
- Mei et al. (2005b) Mei, S., Blakeslee, J.P., Tonry, J.L., Jordán, A., Peng, E.W., Côté, P., Ferrarese, L., Merritt, D., Milosavljevic, M., & West, M.J. 2005b, ApJ, in press (Paper V)
- Merritt (1997) Merritt, D. 1997, AJ, 114, 228
- Mieske et al. (2002) Mieske, S., Hilker, M., & Infante, L. 2002, A&A, 383, 823
- Mould et al. (1990) Mould, J.R., Oke, J.B., de Zeeuw, P.T., & Nemec, J.M. 1990, AJ, 99, 1823M
- Peterson & King (1975) Peterson, C.J., & King, I.R. 1975, AJ, 286, 27
- Phillipps et al. (2001) Phillipps, S., Drinkwater, M.J., Gregg, M.D., & Jones, J.B. 2001, ApJ, 560, 201
- Piatek & Pryor (1995) Piatek, S., & Pryor, C. 1995, AJ, 109, 1071
- Pryor & Meylan (1993) Pryor, C., & Meylan, G. 1993, in The Structure and Dynamics of Globular Clusters, edited by S.G.Djorgovski and G.Meylan (ASP, San Francisco), p.357
- Schlegel et al. (1998) Schlegel, D.J., Finkbeiner, D.P., & Davis, M. 1998, AJ, 500, 525
- Sheinis et al. (2002) Sheinis, A.I., Bolte, M., Epps, H.W., Kibrick, R.I., Miller, J.S., Radovan, M.V., Bigelow, B.C., & Sutin, B.M. 2002, PASP, 114, 851
- Stetson (1987) Stetson, P.B. 1987, PASP, 99, 191
- Stetson (1993) Stetson, P.B. 1993, in IAU Colloq. 136, Stellar Photometry: Current Techniques and Future Developments, ed. C. J. Butler & I. Elliot (Cambridge: Cambridge Univ. Press), 291
- Strom et al. (1981) Strom, S.E., Forte, J.C., Harris, W.E., Strom, K.M., Wells, D.C., & Smith, M.G. 1981, ApJ, 245, 416
- Tonry & Davis (1979) Tonry, J., & Davis, M. 1979, AJ, 84, 1511
- Tonry et al. (2001) Tonry, J.L., Dressler, A., Blakeslee, J.P., Ajhar, E.A., Fletcher, A.B., Luppino, G.A., Metzger, M.R., & Moore, C.B. 2001, AJ, 546, 681
- van der Marel (1991) van der Marel, R.P. 1991, MNRAS, 253, 710
- van der Marel et al. (1998) van der Marel, R.P., Cretton, N., de Zeeuw, P.T., & Rix., H.-W. 1998, ApJ, 493, 613
- Zinnecker et al. (1988) Zinnecker, H., Keable, C.J., Dunlop, J.S., Cannon, R.D., & Griffiths, W.K. 1988, in IAU Symp. 126, Harlow Shapley Symp. on Globular Cluster Systems in Galaxies, ed. J.E. Grindlay & A.G.D. Philip (Dordrecht: Kluwer), 603
- West & Blakeslee (2000) West, M.J, & Blakeslee, J.P. 2000, ApJ, 543, L27
| ID | (J2000) | (J2000) | () | [Fe/H]gz | [Fe/H] | [Fe/H]CBR | |||||
|---|---|---|---|---|---|---|---|---|---|---|---|
| (arcsec) | (mag) | (mag) | (mag) | (mag) | (mag) | (dex) | (dex) | (dex) | |||
| S314 | 12:31:05.10 | +12:20:04.0 | 307.2 | 20.19 | 1.68 | 0.50 | 0.34 | ||||
| S348 | 12:31:03.40 | +12:23:06.0 | 206.0 | 19.61 | 1.30 | 1.36 | 1.25 | ||||
| S417 | 12:31:01.50 | +12:19:25.0 | 300.6 | 19.33 | 1.59 | 0.70 | 0.61 | ||||
| S490 | 12:30:59.30 | +12:21:23.0 | 191.3 | 20.11 | 1.98 | 0.18 | 0.11 | ||||
| S804 | 12:30:51.10 | +12:26:12.0 | 165.8 | 19.29 | 1.55 | 0.79 | |||||
| S928 | 12:30:47.70 | +12:24:30.8 | 67.7 | 19.57 | 19.960 | 18.977 | 0.936 | 1.31 | 1.54 | 1.34 | 1.37 |
| S999 | 12:30:45.91 | +12:25:01.8 | 107.0 | 20.03 | 20.332 | 19.402 | 0.883 | 1.29 | 1.93 | 1.38 | |
| S1370 | 12:30:37.40 | +12:19:18.0 | 305.8 | 19.63 | 1.60 | 0.68 | 0.49 | ||||
| S1538 | 12:30:30.60 | +12:22:56.0 | 277.6 | 19.83 | 1.66 | 0.54 | 0.61 | ||||
| H8005 | 12:30:46.21 | +12:24:23.3 | 72.6 | 20.27 | 20.602 | 19.603 | 0.952 | 1.34 | 1.45 | 1.27 |
| ID | HJD | FWHM | |||
|---|---|---|---|---|---|
| (sec) | (deg) | (arcsec) | (arcsec) | ||
| S314 | 1800 | 2451664.77054 | 290 | 0.70 | 0.77 |
| S348 | 1500 | 2451664.79356 | 295 | 0.73 | 0.82 |
| S417 | 1500 | 2451665.73963 | 290 | 1.14 | 1.18 |
| S490 | 1800 | 2451664.81370 | 305 | 0.86 | 0.89 |
| S804 | 1500 | 2451664.75035 | 290 | 0.87 | 1.04 |
| S928 | 1800 | 2452794.82831 | 70 | 0.97 | 1.18 |
| S999 | 1200 | 2452794.81090 | 70 | 1.18 | 1.83 |
| 1200 | 2452794.85367 | 70 | 1.10 | 1.39 | |
| S1370 | 1800 | 2451665.75923 | 285 | 0.99 | 0.96 |
| S1538 | 1800 | 2451665.78279 | 295 | 1.08 | 1.20 |
| H8005 | 1800 | 2452794.87004 | 70 | 1.13 | 1.14 |
| 1100 | 2452794.89157 | 70 | 1.16 | 1.15 |
| ID | (2000) | (2000) | HJD | Type | |||
|---|---|---|---|---|---|---|---|
| (sec) | (mag) | (km s-1) | |||||
| HD86801 | 10:01:36.13 | +28:34:02.3 | 20 | 2451664.73377 | G0 V | 8.78 | 14.5 |
| HD102494 | 11:47:57.13 | +27:20:16.2 | 6 | 2452794.80510 | G9 IV | 7.48 | 22.9 |
| HD107328 | 12:20:22.59 | +03:18:37.7 | 1 | 2452794.80438 | K0.5 III | 4.96 | +35.7 |
| HD112299 | 12:55:29.08 | +25:44:05.9 | 15 | 2451664.74060 | F8 V | 8.39 | +3.4 |
| HD132737 | 14:59:54.04 | +27:09:30.2 | 8 | 2452794.91145 | K0 III | 7.64 | 24.1 |
| HD145001 | 16:08:06.18 | +17:02:35.3 | 1 | 2451665.01091 | G5 III | 5.00 | 9.5 |
| HD154417 | 17:05:18.85 | +00:42:11.1 | 1 | 2451665.01841 | F8.5 IV-V | 6.01 | 17.4 |
| HD194071 | 20:22:38.94 | +28:14:54.6 | 5 | 2451665.13127 | G8 III | 7.80 | 9.8 |
| HD203638 | 21:24:11.25 | 20:50:53.4 | 1 | 2451665.14021 | K0 III | 5.41 | +21.9 |
| (FXCOR) | (pPXF) | |||||||||||||
|---|---|---|---|---|---|---|---|---|---|---|---|---|---|---|
| ID | A | B | C | D | E | A | B | C | D | E | ||||
| (km s-1) | (km s-1) | (km s-1) | (km s-1) | (km s-1) | (km s-1) | |||||||||
| S928 | 1282.55.0 | 22.6 | 22.2 | 21.7 | 21.4 | 21.4 | 21.90.5 | 19.80.4 | 19.40.5 | 19.10.5 | 21.30.3 | 20.40.4 | 20.00.9 | 22.41.0 |
| S999 | 1465.95.1 | 18.6 | 19.6 | 18.9 | 21.3 | 19.6 | 19.61.0 | 22.40.3 | 22.50.4 | 22.30.3 | 25.20.3 | 24.30.4 | 23.31.3 | 25.61.4 |
| H8005 | 1882.65.1 | 11.4 | 7.0 | 9.5 | 12.3 | 9.7 | 9.982.0 | 10.11.5 | 7.61.8 | 7.10.5 | 11.80.3 | 8.70.4 | 9.11.9 | 10.82.3 |
| (FXCOR) | (pPXF) | |||||||||||||||
|---|---|---|---|---|---|---|---|---|---|---|---|---|---|---|---|---|
| ID | A | B | C | D | E | F | A | B | C | D | E | F | ||||
| (km s-1) | (km s-1) | (km s-1) | (km s-1) | (km s-1) | (km s-1) | |||||||||||
| S314aaArchival WFPC2 imaging available. See §5.2 and Table 7. | 1220.610.1 | 37.3 | 36.4 | 36.9 | 39.4 | 37.1 | 36.2 | 37.21.1 | 35.50.2 | 35.30.2 | 36.20.2 | 35.50.2 | 36.20.2 | 32.40.2 | 35.21.4 | 35.3 1.4 |
| S348 | 795.710.1 | 25.1 | 23.8 | 26.8 | 27.8 | 25.7 | 26.2 | 25.91.4 | 20.80.3 | 19.80.3 | 23.10.2 | 21.50.2 | 22.60.3 | 20.40.2 | 21.41.3 | |
| S417aaArchival WFPC2 imaging available. See §5.2 and Table 7. | 1862.14.2 | 31.5 | 31.5 | 32.7 | 31.7 | 32.6 | 32.6 | 32.10.6 | 30.90.2 | 30.00.2 | 31.90.2 | 31.00.2 | 31.60.2 | 27.70.2 | 30.51.5 | 32.9 1.6 |
| S490aaArchival WFPC2 imaging available. See §5.2 and Table 7. | 1566.87.0 | 37.7 | 34.7 | 33.9 | 36.7 | 36.4 | 37.2 | 36.11.5 | 44.10.2 | 44.90.2 | 41.50.2 | 42.30.2 | 42.60.2 | 37.10.2 | 42.12.7 | 42.5 2.7 |
| S804 | 1134.310.0 | 34.5 | 33.6 | 35.8 | 36.6 | 34.8 | 36.5 | 35.31.2 | 33.40.2 | 32.80.2 | 34.90.2 | 33.30.2 | 34.60.2 | 32.10.2 | 33.51.1 | |
| S1370 | 1083.94.1 | 39.8 | 39.1 | 40.6 | 40.3 | 40.0 | 39.2 | 39.80.6 | 38.60.2 | 38.80.2 | 39.10.2 | 38.60.2 | 39.20.2 | 34.80.2 | 38.21.7 | |
| S1538 | 1196.94.2 | 25.8 | 28.8 | 30.4 | 31.6 | 33.6 | 29.5 | 30.02.6 | 26.30.2 | 26.20.2 | 27.60.2 | 26.80.2 | 27.50.2 | 24.90.2 | 26.61.0 | |
| ID | |||||||||||||||
|---|---|---|---|---|---|---|---|---|---|---|---|---|---|---|---|
| (pc) | (pc) | (pc) | (pc) | (mag/ | (mag/ | ||||||||||
| arcsec2) | arcsec2) | ||||||||||||||
| S928 | 0.133 | 1.0800.029 | 1.1770.049 | 21.790.46 | 24.520.74 | 13.520.74 | 13.591.19 | 18.72 | 18.97 | 1.820.01 | 1.850.02 | 12.890.63 | 15.041.13 | 0.8950.006 | 0.9120.008 |
| S999 | 0.057 | 1.0100.045 | 1.0990.037 | 19.150.19 | 21.100.49 | 12.901.03 | 12.810.87 | 18.89 | 19.11 | 1.790.02 | 1.820.03 | 11.420.93 | 13.300.81 | 0.8790.011 | 0.8990.007 |
| H8005 | 0.171 | 1.3030.069 | 1.3040.071 | 28.141.64 | 29.242.37 | 13.391.70 | 13.901.97 | 19.98 | 20.06 | 1.880.02 | 1.880.02 | 18.121.80 | 18.141.86 | 0.9300.009 | 0.9300.009 |
| ID | |||||||
|---|---|---|---|---|---|---|---|
| (pc) | (pc) | (mag arcsec-2) | |||||
| S314 | 1.700.09 | 3.230.19 | 0.820.13 | 15.20 | 1.940.01 | 31.974.48 | 0.9610.005 |
| S417 | 1.190.09 | 14.360.36 | 7.851.17 | 17.58 | 1.850.03 | 15.322.06 | 0.9140.014 |
| S490 | 1.840.11 | 3.640.36 | 0.680.14 | 15.37 | 1.960.01 | 40.307.72 | 0.9690.006 |
| S928 | 1.130.05 | 23.161.37 | 13.550.04 | 18.85 | 1.830.02 | 13.971.08 | 0.9030.009 |
| S999 | 1.050.04 | 20.130.98 | 12.860.05 | 19.00 | 1.810.02 | 12.360.94 | 0.8890.010 |
| H8005 | 1.300.00 | 28.690.55 | 13.650.26 | 20.02 | 1.880.00 | 18.130.01 | 0.9300.000 |
| ID | ||||
|---|---|---|---|---|
| (mag) | () | () | (/) | |
| S314 | 10.910.16 | 1.980.30 | 0.580.10 | 2.940.68 |
| S417 | 11.780.16 | 4.390.66 | 2.560.46 | 5.831.36 |
| S490 | 11.000.16 | 2.140.32 | 0.870.21 | 4.060.15 |
| S928 | 11.580.16 | 3.520.53 | 2.130.29 | 6.061.23 |
| S999 | 11.080.16 | 2.310.34 | 2.160.29 | 9.361.87 |
| H8005 | 10.830.16 | 1.840.28 | 0.550.23 | 2.981.35 |
| ID | Otheraa Identifications from Côté et al. (2003) for VCC1226 (M49), or from Hanes et al. (2001) for VCC1316 (M87). | (J2000) | (J2000) | ()0 | bb Average radial velocity from Côté et al. (2003) for VCC1226, and from Hanes et al. (2001) for VCC1316. The velocity for S1063 is from Huchra & Brodie (1987). | Comments | |||||
|---|---|---|---|---|---|---|---|---|---|---|---|
| (mag) | (mag) | (mag) | (pc) | (km s | (mag) | ||||||
|
Certain or Probable DGTOs
|
|||||||||||
| 798_1 | 12:25:20.980 | +18:10:12.57 | 20.978 | 19.962 | 0.951 | 14.520.70 | 1.210.06 | 28.2 | Certain (SBF, color) | ||
| 798_2 | 12:25:26.018 | +18:11:47.95 | 19.923 | 18.907 | 0.951 | 19.020.76 | 1.130.05 | 28.6 | Certain (SBF, color) | ||
| 1226_1 | G9992 | 12:29:48.347 | +08:00:41.79 | 20.886 | 19.718 | 1.120 | 18.861.54 | 1.070.12 | 795 | Certain (velocity, color) | |
| 1316_2 | S999 | 12:30:45.912 | +12:25:01.80 | 20.332 | 19.402 | 0.880 | 22.341.74 | 1.120.11 | 1515 | 28.7 | Certain (velocity, SBF, color), UCD |
| 1316_3 | H8005 | 12:30:46.209 | +12:24:23.30 | 20.602 | 19.603 | 0.949 | 26.470.93 | 1.170.06 | 1934 | 28.4 | Certain (velocity, SBF, color), UCD? |
| 1316_4 | H8006 | 12:30:46.653 | +12:24:22.40 | 20.570 | 19.565 | 0.955 | 21.611.37 | 1.180.09 | 1071 | 27.9 | Certain (velocity, SBF, color) |
| 1316_5 | S928 | 12:30:47.704 | +12:24:30.80 | 19.960 | 18.977 | 0.933 | 23.450.43 | 1.100.03 | 1299 | Certain (velocity, color), UCD | |
| 1316_6 | H5065 | 12:30:50.049 | +12:24:09.15 | 20.331 | 19.355 | 0.926 | 13.900.21 | 0.880.03 | 1563 | Certain (velocity, color) | |
| 1632_1 | 12:35:38.106 | +12:33:01.17 | 19.712 | 18.449 | 1.175 | 39.401.77 | 2.000.03 | 28.6 | Probable (SBF, color) | ||
|
Possible DGTOs
|
|||||||||||
| 1250_1 | 12:29:56.685 | +12:19:31.46 | 20.462 | 19.472 | 0.931 | 11.140.34 | 1.120.06 | 29.8 | Possible (SBF) | ||
| 1297_1 | 12:30:33.419 | +12:29:54.16 | 19.264 | 18.201 | 1.017 | 36.501.71 | 1.540.04 | 29.8 | Possible (SBF) | ||
| 1632_2 | 12:35:35.194 | +12:33:41.72 | 20.262 | 19.273 | 0.901 | 10.130.09 | 0.840.03 | 29.6 | Possible (SBF, color) | ||
| 1861_1 | 12:41:01.441 | +11:09:04.25 | 20.810 | 19.751 | 0.996 | 21.522.73 | 1.790.11 | Possible (color) | |||
|
Certain or Probable Background Galaxies
|
|||||||||||
| 763_1 | 12:25:07.503 | +12:52:55.62 | 20.105 | 18.487 | 1.530 | 72.777.28 | 2.15cc c = 2.15 is the maximum allowed value of the concentration index in the King models fits to the surface brightness profiles. | 30.6 | Probable (SBF, color) | ||
| 828_1 | 12:25:44.093 | +12:49:22.14 | 20.244 | 19.135 | 1.038 | 22.031.10 | 1.110.08 | 30.4 | Probable (SBF) | ||
| 1316_1 | S1063 | 12:30:45.630 | +12:22:12.44 | 20.699 | 19.089 | 1.560 | 41.911.88 | 2.040.03 | 25396 | 30.6 | Certain (velocity, SBF, color) |
| 1627_1 | 12:35:40.852 | +12:23:10.71 | 20.634 | 19.129 | 1.422 | 17.942.98 | 1.730.17 | 28.8 | Probable (color, spiral morphology?) | ||
| 1895_1 | 12:41:51.700 | +09:22:52:55 | 19.528 | 17.906 | 1.585 | 92.278.17 | 2.15cc c = 2.15 is the maximum allowed value of the concentration index in the King models fits to the surface brightness profiles. | 32.7 | Probable (SBF, color) | ||