The Molecular Connection to the FIR-Radio Continuum Correlation in Galaxies
We have studied the relationships between the radio continuum (RC) and CO emission for a set of galaxies selected from the BIMA Survey of Nearby Galaxies. We find that the global CO-RC correlation is as tight as the global FIR-RC correlation for the 24 galaxies studied. Within 9 galaxies with 6″ CO and RC data available, the CO and RC emission is as tightly correlated as its global value; the radially averaged correlation is nearly linear, extends over four order of magnitude and holds down to the smallest linear resolution of the observations, which is pc. We define as the log of the ratio of the CO to RC flux as a way to characterize the CO-RC correlation. Combining 6″ pixel-by-pixel comparisons across all sources yields an average small-scale correlation of = 1.1 0.28; that is, the spatially resolved correlation has a dispersion that is less than a factor of 2. There are however systematic variations in the CO/RC ratio; the strongest organized structures in tend to be found along spiral arms and on size scales much larger than the resolution of the observations. We do not measure any systematic trend in CO/RC ratio as a function of radius in galaxies. The constancy of the CO/RC ratio stands in contrast to the previously measured decrease in the FIR/RC ratio as a function of radius in galaxies. We suggest that the excellent correlation between the CO, RC and FIR emission in galaxies is a consequence of regulation by hydrostatic pressure; this model links all three emissions without invoking an explicit dependence on a star formation scenario.
Key Words.:
radio continuum: galaxies - galaxies:spiral - ISM: molecules - stars: formation1 Introduction
The correlation between the global far-infrared (FIR) and centimeter-wavelength radio continuum (RC) emissions in galaxies is at the same time one of the most robust and one of the most puzzling relations in extragalactic research. On global scales, the FIR and RC emissions are linearly correlated over five orders of magnitude of luminosity, with an RMS scatter of less than a factor of 2 (Condon 1992; Yun, Reddy, & Condon 2001). The relation holds across a remarkable variety of galaxies to include dwarf galaxies (Leroy et al. 2004), normal barred and unbarred spiral galaxies of all Hubble types, irregular galaxies, E/S0 galaxies with ongoing star formation, starbursts, Seyferts and radio-quiet quasars (Condon 1992 and references therein), out to the most extreme starforming galaxies in the early Universe, at = 1 and beyond (Appleton et al. 2004).
Although both the FIR and RC emission are thought to originate as a result of star formation in molecular clouds, the emission mechanisms for the two processes are completely different. The FIR arises from dust heated by newly-born massive stars, still embedded in their parent envelopes. The RC is, for the most part, nonthermal synchrotron emission that arises from the interaction of relativistic electrons with the ambient magnetic field in which they diffuse. The relativistic electrons are thought to be accelerated in supernova remnants, which result from the massive stars. Given the many disparate steps, the completely different physics, and the different time scales for the various processes involved, the tightness of the global FIR-RC correlation is surprising indeed.
What is known about the relationship of molecular gas to the FIR and RC distributions? The FIR emission is well correlated with the CO emission on large scales in galaxies (e.g. Devereux & Young 1990; Young & Scoville 1991 and references therein), and the CO emission is also well correlated with the RC on global scales (Rickard, Turner & Palmer 1977; Israel & Rowan-Robinson 1984; Adler, Allen & Lo 1991; Murgia et al. 2002). At intermediate resolutions of 1–3 kpc, Marsh & Helou (1995) found a small but systematic decrease in the FIR/RC ratio as a function of increasing radial distance, which they interpreted as a smearing of the RC by the propagation of the radiating electrons. By contrast, Adler et al. (1991) and Murgia et al. (2002) found that the ratio between the RC and the CO emission is constant, to within a factor of 3, both inside the same galaxy and from galaxy to galaxy, down to kpc size scales.
The arcminute-scale resolution of IRAS and ISO has limited extragalactic comparisons of the FIR-RC correlation to kpc sizes for all but a few Local Group sources. However, on size scales of a few hundred parsecs and smaller, detailed maps of gas within several kpc of the Sun suggest that the radio continuum emission associated with regions of star formation is, for the most part, thermal, and does not follow the FIR-RC correlation (Boulanger & Perault 1988; Haslam & Osbourne 1987; Wells 1997). Why there should be a good global correlation between the CO, FIR and the synchrotron-dominated RC is thus not at all expected from observations of the local interstellar medium. Furthermore, given the good correlations on large scales in galaxies, and the poor local correlation, one might expect that there may be some linear size scale(s) at which the CO-RC and FIR-RC correlations break down.
In this paper, we examine several aspects of the CO-RC-FIR correlation problem. First, we quantify the FIR-RC, CO-RC and CO-FIR correlations on global scales for a sample of 24 galaxies with improved integrated single-dish CO measurements. Then, using 6″ imaging for a subsample of 9 sources, we show that the CO-RC relation is equally tight within galaxies as it is from galaxy to galaxy, down to linear scales of 100 pc. We show that the most significant large-scale variations in the CO-RC relation appear to be associated with spiral arms and that there is not a significant radial variation in the ratio. Finally, we propose that the RC-FIR-CO correlations may be explained on large and small scales to be a result of regulation by the hydrostatic pressure in galaxies.
2 Sample Selection and Data Reduction
Galaxies were selected from the Berkeley-Illinois-Maryland Association Survey of Nearby Galaxies (BIMA SONG), an imaging survey of the CO (J=1-0) emission in 44 nearby spiral galaxies with a typical resolution of 6″ (Regan et al. 2001; Helfer et al. 2003). For 24 of the galaxies in the BIMA SONG sample, fully-sampled single-dish CO images were incorporated into the BIMA SONG images, so that all of the CO flux is imaged for these galaxies (i.e., there is no “missing flux” problem for these sources). The single-dish data for these 24 sources, taken at 55″ resolution with the NRAO 12m telescope111The National Radio Astronomy Observatory is a facility of the National Science Foundation operated under cooperative agreement by Associated Universities, Inc., comprise the most extensive collection of fully-sampled, two-dimensional single-dish CO images of external galaxies to date, and we use global CO flux measurements from these single-dish data.
From the BIMA SONG data set, we selected a sub-sample of nine CO-bright galaxies for which high quality VLA B-array at 1.4 GHz were available either from the NRAO VLA archive1 or from the Faint Images of the Radio Sky at Twenty-Centimeters (FIRST) survey (White et al. 1997). The VLA archival data were calibrated and imaged with the NRAO package AIPS following standard procedures. To improve the sensitivity of the VLA radio continuum images to large scale structures, D array data were combined with the B array data. The D array data were taken from the VLA archive when available, and combined in the visibility plane with the B array data; otherwise D array images from the NRAO VLA Sky Survey (NVSS, Condon et al. 1998) were added in the image plane using the linear combination method implemented in the MIRIAD task IMMERGE (Sault, Teuben, & Wright 1995).
The subsample of 9 galaxies considered in this work are listed in Table LABEL:bimasample along with some of their physical parameters. All of them have an image of the CO integrated intensity from the NRAO 12m telescope. We therefore have CO and RC images at two different angular resolutions: a “low” resolution (″) pair obtained from the NRAO 12m and VLA D-array, and a “high” resolution (″) pair. The RC and CO image characteristics for the low and high resolution data sets are listed in Table LABEL:imageslr and LABEL:imageshr, respectively, with beam sizes listed in angular and linear scales.
We emphasize that these data are among the most comprehensive and uniformly processed CO and RC data from normal galaxies. Furthermore, the angular resolution of the CO and RC images are well matched, not just by filtering the data, but by having comparable intrinsic coverage over the relevant spatial frequencies. Both the low-resolution and high-resolution data sets had intrinsic beam areas where the RC and CO images matched typically to within 10%. Nonetheless, to account for even small differences in the beam areas, we convolved the images to common angular resolution in the quantitative analysis below.
Finally, in order to study the RC, CO and FIR global correlations, the integrated 60 m fluxes of the galaxies in our sample have been taken from the IRAS and IRAS HIRES (′) databases (see Table LABEL:globalfluxes for references).
| Galaxy | (J2000) | (J2000) | d | i | P.A. | RC3 Type, Nucleus |
|---|---|---|---|---|---|---|
| ( ) | (° ′ ″) | (Mpc) | (o) | (o) | ||
| IC 342 | 03 46 49.7 | 68 05 45 | 3.9 | 31 | 37 | SAB(rs)cd, HII |
| NGC 4258 | 12 18 57.5 | 47 18 14 | 8.1 | 65 | 176 | SAB(s)bc, Sy1.9 |
| NGC 4414 | 12 26 27.2 | 31 13 24 | 19.1 | 55 | 159 | SA(rs)c?, T2: |
| NGC 4736 | 12 50 53.06 | 41 07 14 | 4.3 | 35 | 100 | (R)SA(r)ab,T2 |
| NGC 5005 | 13 10 56.23 | 37 03 33 | 21.3 | 61 | 65 | SAB(rs)bc, L1.9 |
| NGC 5033 | 13 13 27.53 | 36 35 38 | 18.7 | 62 | 170 | SA(s)c, Sy1.5 |
| NGC 5055 | 13 15 49.25 | 42 01 49 | 7.2 | 55 | 105 | SA(rs)bc, T2 |
| NGC 5194 | 13 29 52.35 | 47 11 54 | 7.7 | 15 | 0 | SA(s)bc pec, Sy2 |
| NGC 6946 | 20 34 52.33 | 60 09 14 | 5.5 | 54 | 65 | SAB(rs)cd,HII |
-
Coordinates, distances, inclinations, position angles, RC3 type and nuclear classifications from Helfer et al. (2003).
| Galaxy | VLA data | RC- | CO- | |||
|---|---|---|---|---|---|---|
| (″″) | (mJy bm-1) | (″″) | (kpc kpc) | (Jy bm-1 km s-1) | ||
| IC 342 | D | 5244 | 0.15 | 5555 | 1.0 1.0 | 23.3 |
| NGC 4258 | D | 4545 | 0.50 | 5555 | 2.1 2.1 | 31.4 |
| NGC 4414 | C | 1414 | 0.20 | 5555 | 5.0 5.0 | 36.2 |
| NGC 4736 | D | 5454 | 0.13 | 5555 | 1.1 1.1 | 18.4 |
| NGC 5005 | D | 4848 | 0.20 | 5555 | 5.6 5.6 | 54.7 |
| NGC 5033 | D | 5454 | 0.20 | 5555 | 4.9 4.9 | 44.8 |
| NGC 5055 | D | 5454 | 0.20 | 5555 | 1.9 1.9 | 35.0 |
| NGC 5194 | D | 5454 | 0.30 | 5555 | 2.0 2.0 | 24.7 |
| NGC 6946 | D | 4440 | 0.10 | 5555 | 1.5 1.5 | 35.0 |
-
The linear resolution refers to the CO beam.
-
is the rms level in the unclipped image of integrated intensity.
| Galaxy | VLA data | RC- | CO- | |||
|---|---|---|---|---|---|---|
| (″″) | (mJy bm-1) | (″″) | (pcpc) | (Jy bm-1 km s-1) | ||
| IC 342 | B+D | 5.55.0 | 0.05 | 5.65.1 | 11097 | 4.8 |
| NGC 4258 | AnB+D | 3.53.3 | 0.05 | 6.15.4 | 240210 | 4.8 |
| NGC 4414 | B+D | 5.45.4 | 0.08 | 6.45.0 | 590460 | 1.9 |
| NGC 4736 | B+D | 6.15.1 | 0.05 | 6.95.0 | 140100 | 3.5 |
| NGC 5005 | B+D | 5.45.0 | 0.03 | 6.26.0 | 640620 | 2.9 |
| NGC 5033 | B+D | 5.35.0 | 0.07 | 6.15.4 | 550490 | 5.6 |
| NGC 5055 | B+D | 5.55.0 | 0.04 | 5.85.5 | 200190 | 3.6 |
| NGC 5194 | B+C | 6.04.8 | 0.02 | 5.85.1 | 214188 | 3.1 |
| NGC 6946 | B+C | 5.64.9 | 0.10 | 6.04.9 | 160130 | 3.1 |
-
The linear resolution refers to the CO beam.
-
is the rms level in the unclipped image of integrated intensity.
3 Data Analysis
In order to compare the point-to-point RC and CO brightnesses across entire galaxy disks, we overlaid regular grids of rectangular beam-sized boxes on both the RC and CO images. We then calculated the 1.4 GHz RC brightness () and the CO integrated intensity () by averaging all pixel values within each box. For the 55″ resolution data, we used CO images of integrated intensity made without clipping any of the channel images. For the 6″ resolution images, we used CO images as presented in Helfer et al. (2003), made by applying a smooth-and-mask technique that is very effective at showing low-level emission (but that may introduce a bias against faint, compact emission; see van Gorkom & Ekers 1989; Helfer et al. 2003). The smooth-and-mask technique does not bias the noise statistics of the final image, and we used the mask to calculate the pixel-by-pixel rms in the high-resolution images. For the radial profiles (below), the signal to noise ratio of the high- and low-resolution CO data is sufficient to use the unclipped images of the integrated intensity, avoiding any bias.
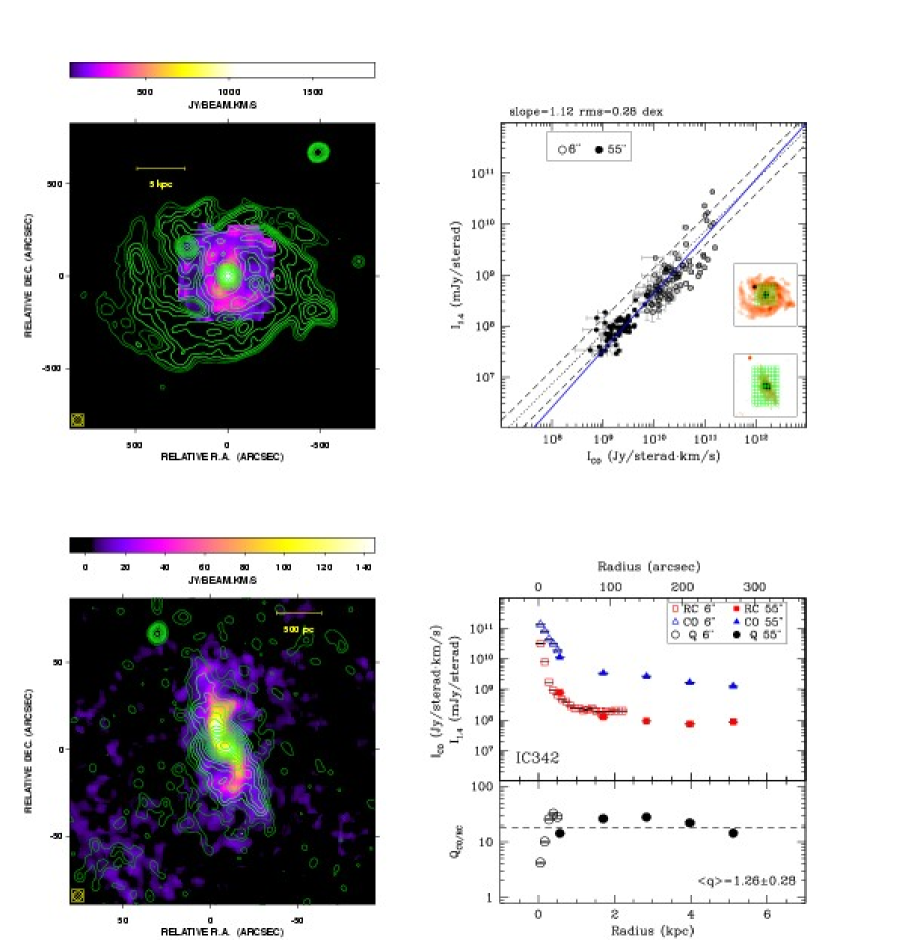
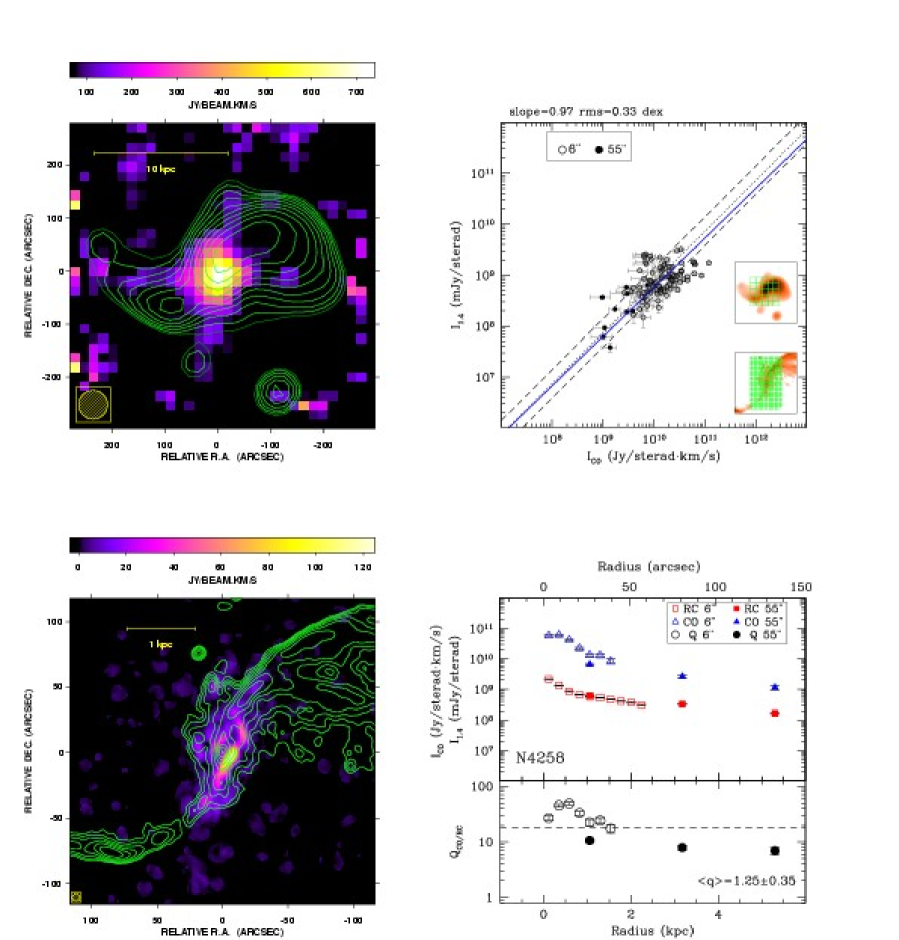
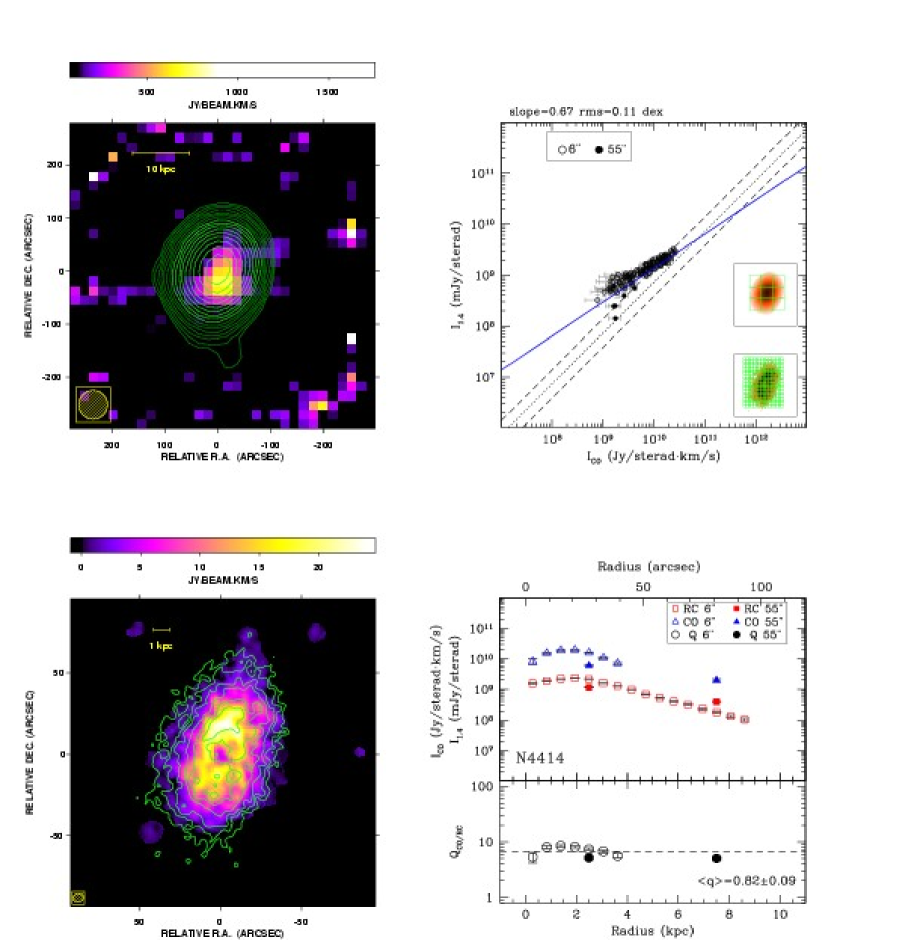
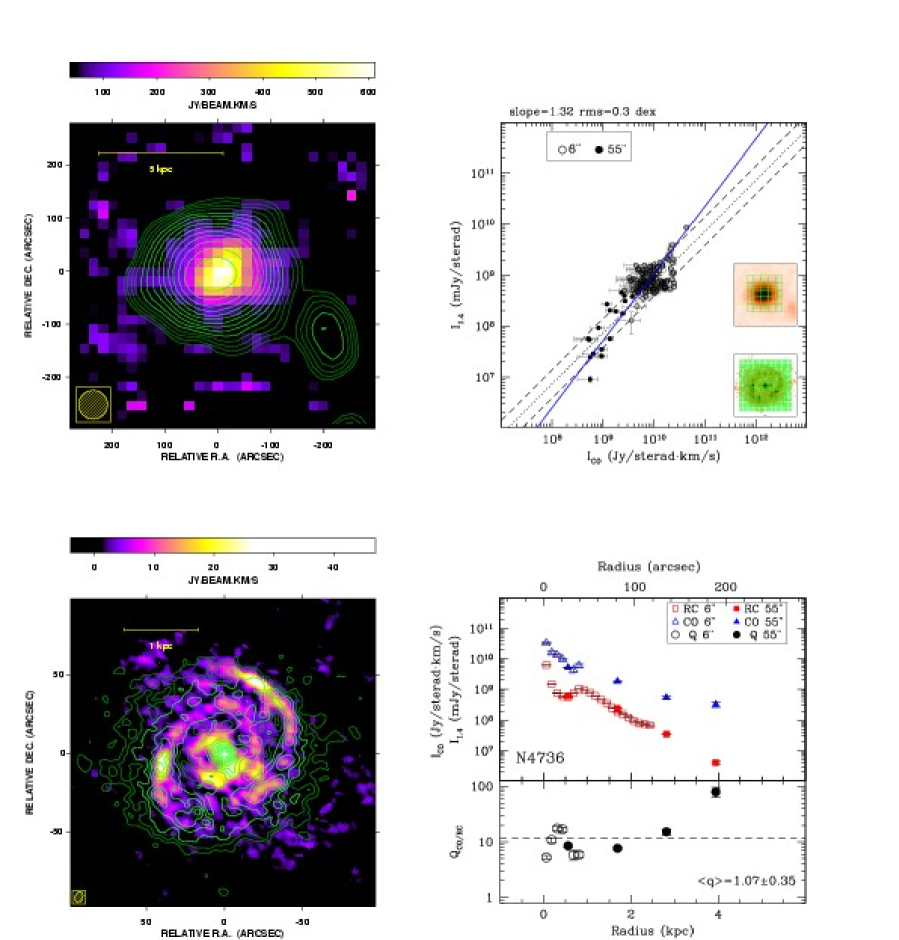
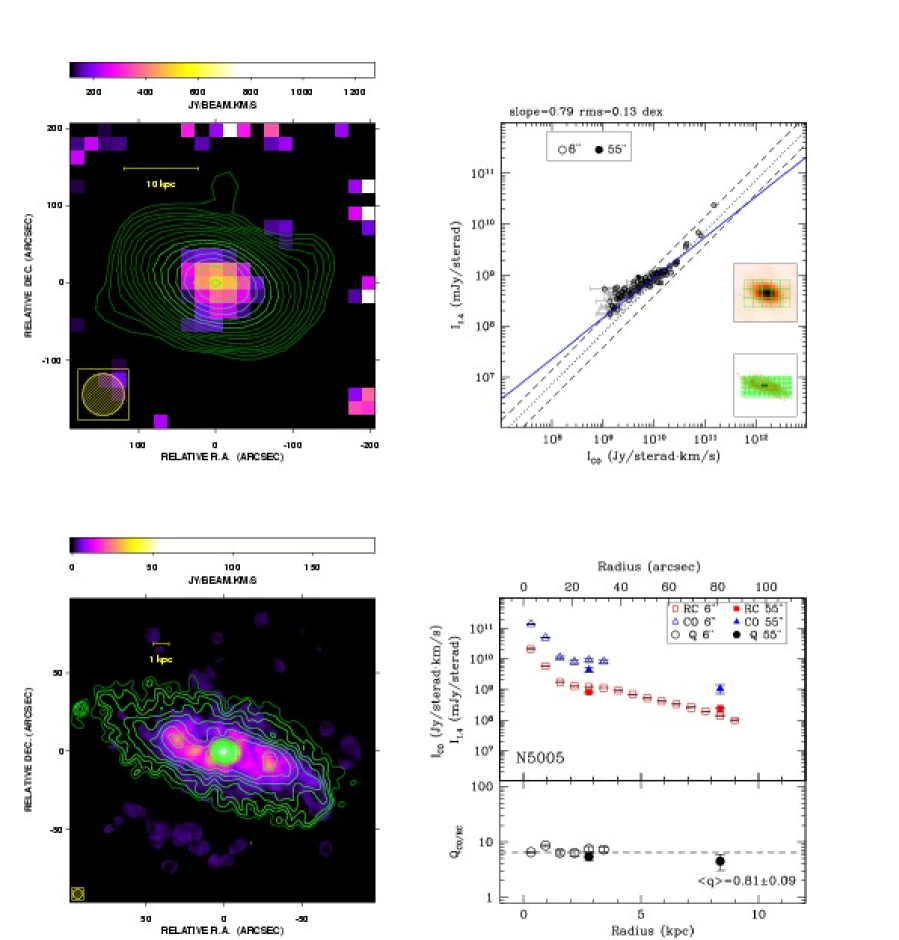
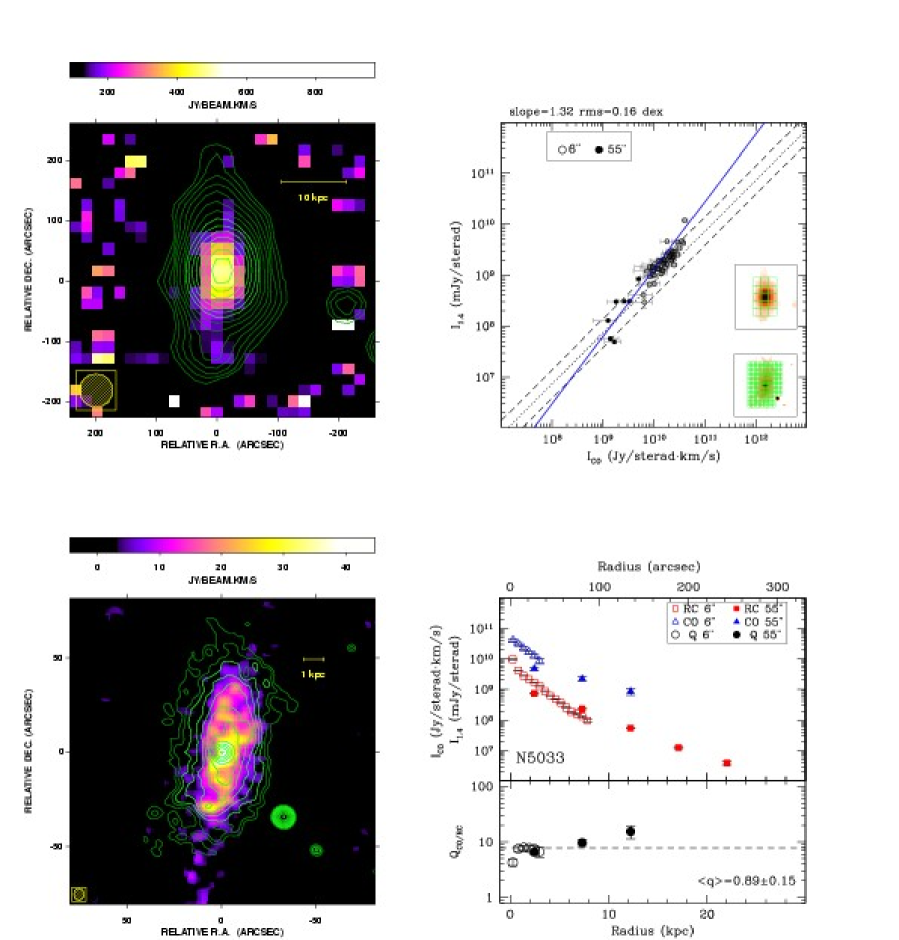
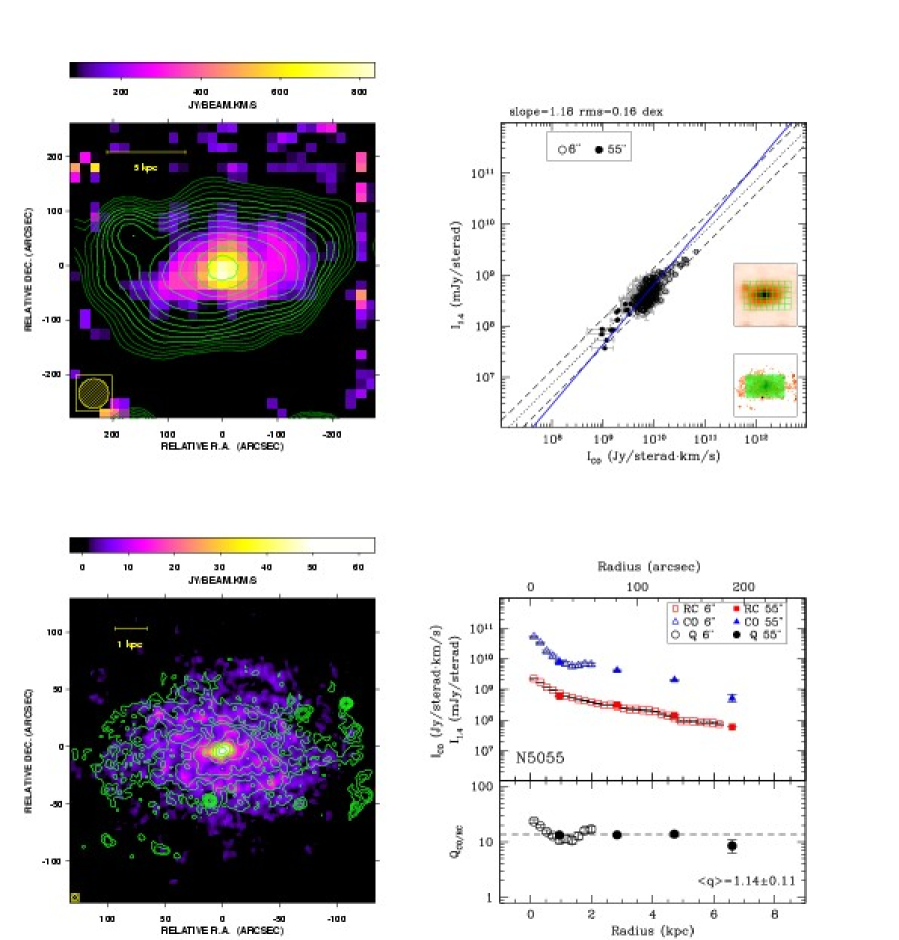
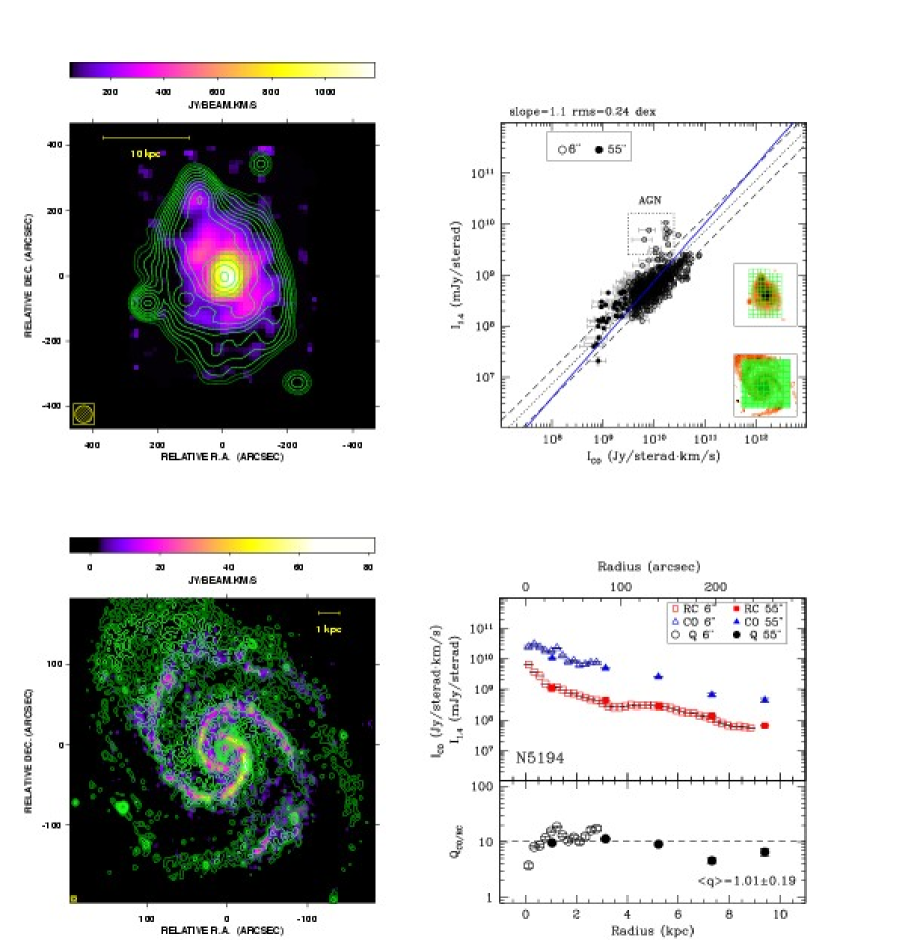
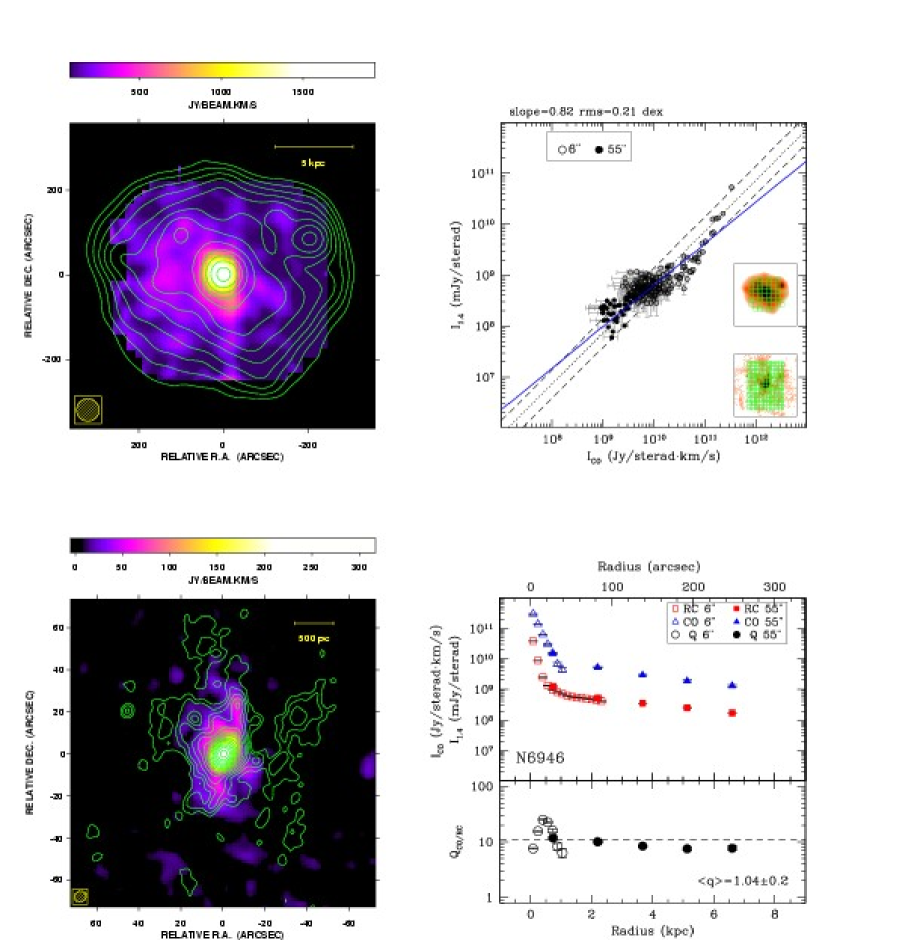
Fig. 1 shows the data analysis performed for the nine galaxies. For each galaxy, the upper and bottom left panels show the overlay of (contours) on (color) images respectively at low and high resolution. On top of the two panels, the intensity scale for the CO images is shown as a wedge. The RC contours start from a level of 5 and scale by a factor of .
The upper right panels plot versus at low (solid dots) and high (open dots) resolution. In the bottom right corner insets, the upper and lower panels show the box grids for the low and high resolution images, respectively. Only points above 2 have been plotted. Areas with obvious background continuum sources were omitted from the analysis.
Finally, the bottom right panel shows the radial profiles of and (on the top) and their ratio (Jy sr-1km s-1)/(mJy sr-1) (on the bottom). For this analysis, we used unclipped images of integrated intensity in CO to avoid any bias against faint emission, and we calculated the mean intensities in concentric elliptical annuli using the position angles and inclinations listed in Table LABEL:bimasample. We spaced the annuli to have widths along their major axis at the resolution of the corresponding images, or 6″ for the high-resolution images and 55″ for the low-resolution images. We plot only those points that are measured at a level 1. For each galaxy, the values of the mean and dispersion of () are given on the bottom right plot of the radial variation in .

4 Results
4.1 Comparison of Global Fluxes
For the 24 BIMA SONG galaxies that have associated single-dish CO images, Helfer et al. (2003) tabulated CO global fluxes that were directly measured from the single-dish images. For these sources, we can quantify the global CO-RC, FIR-CO, and RC-FIR correlations. The relevant fluxes are listed in Table LABEL:globalfluxes, and the relations are plotted in Fig. 2. Linear least squares fits to the relations yield a CO-RC correlation of log(S1.4)/log(SCO) 1.280.13, a CO-FIR correlation log(SFIR)/log(SCO) 1.050.11, and a FIR-RC correlation of log(S1.4)/log(SFIR) 1.050.14. (NGC 1068 is omitted from these fits, since it has a significant contribution to its RC flux from its AGN; however, omitting this source has a small impact on the slopes derived.) The RC-FIR correlation measured for these 23 sources is consistent with its best determination over a large (1809) number of sources (Yun, Reddy & Condon 2001), where the slope of the RC/FIR fit (also using 1.4 GHz RC and 60 m FIR) is 0.990.01.
Of the three correlations measured here, the slope of the CO-RC correlation is the steepest, and is the only one that appears to be inconsistent with a slope of unity. Furthermore, the CO-RC slope is consistent with that measured by Murgia et al. (2002), or 1.3 0.1, on arcminute scales using independent data. However, given the uncertainties, it is fair to say that these data show that all three correlations are comparably tight, and that we cannot identify any of the relations as being a “fundamental” one.
4.2 Point-to-Point and Radial Correlations of the RC and CO Emissions
The 55″ RC and CO images are shown in the upper-left panels of Figure 1. The RC emission, shown as contours in these figures, occasionally includes point sources which are almost certainly background radio sources. Ignoring these background sources, we can already see by eye that the general shape of the RC contours follows the underlying CO emission reasonably well. There are a few exceptions, like NGC 4258, for which the RC and CO emission seem to display quite different behaviours (see the Appendix for details).
The 6″ resolution images are shown in the lower-left panels of Figure 1. Here, the detailed agreement is even more striking, partly because a larger dynamic range of emission is represented in these images. We note that both the high- and low-resolution RC images have a larger dynamic range than the corresponding CO images; this prevents a full comparison of the two in the faintest regions and it may give the impression that there are RC features that are unmatched by the CO. However, the opposite is not observed: every CO feature appears to have a RC counterpart.
The quantitative point-to-point comparison of the correlation, shown for both the low and high resolution images in the upper-right panels of Figure 1, shows an excellent agreement between the two data sets for each galaxy. First, we note that for the point-to-point correlation, the low-resolution data are aligned with the extrapolation of the high-resolution data to lower intensity values. Moreover, the and radial profiles of the low and high resolution data also match very well (see bottom-right panels of Fig. 1). This is particularly evident toward the central region of the galaxies where the two data sets overlap and is an effect that results from the incorporation of extended flux from the low-resolution images into the high-resolution data.
The mean and dispersion in are given in the bottom right panels of Figure 1. The dispersion within the individual sources ranges from 0.09 to 0.35; these correspond to dispersions in the CO/RC flux ratios that are a factor of 1.2–2.2. These are remarkably tight correlations given that the dynamic range extends over three orders of magnitude for some sources. The average among all nine sources is 1.03 0.06 (uncertainty in the mean) 0.17 (standard deviation); that is, the CO/RC ratios from all sources are constant to within a dispersion of a factor of 1.5. These results emphasize both the small scatter in within each galaxy as well as among different sources. The CO and RC emission are on average linearly related for these sources, though we note that larger samples show a steeper RC/CO slope ( 4.1).
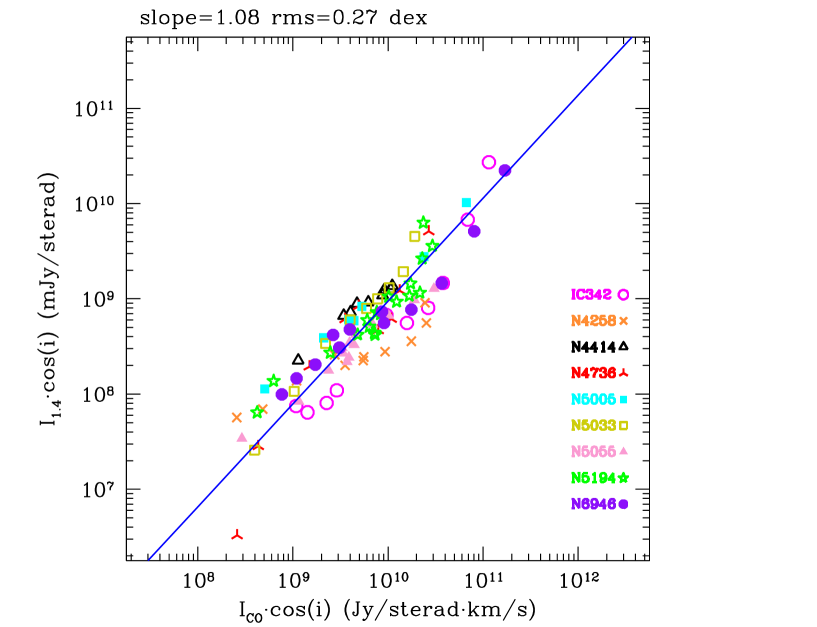
Despite small-scale variations, there is no systematic trend of with radius (lower-right panels of Figure 1). In Figure 3, we show the correlations of all of the galaxies on a common plot. The individual points represent annular averages and may generally be read as radial profiles. This figure serves to reinforce the commonality of the CO-RC relation among the galaxies. We note that this figure shows distance-independent intensity measurements, not luminosity measurements, and that the intensities extend over 3 orders of magnitude.

Figure 2 shows the correlation in the global over entire galaxies. Figure 3 shows the correlation at intermediate scales, when averaged over annular bins. We can examine the scatter in on the smallest scales by placing the individual pixels from all sources on a common plot, which we present in Figure 4. Over all pixels, the average correlation is = 1.1 0.28.
Some of the galaxies show slightly depressed CO emission relative to the RC at their centers, which may be caused by enhanced RC emission from the presence of an AGN. But with the exception of IC 342, the deepest depression in the emission ratios is only a factor of 1.1–3.3 away from the mean for each source. This close agreement in the galaxy centers is somewhat surprising, given the likely variation in the CO-to-H2 conversion in these regions.
To summarize, we find a very good point-to-point correlation between the CO and RC emissions at an angluar resolution of 6″ in a sample of 9 nearby spiral galaxies. We are aware that the small size of the sample analyzed in this work could weaken the statistical relevance of this result. However, for a sample of 22 galaxies that includes an additional 13 sources, Paladino et al. (in preparation) find a similarly low scatter in the overall RC-CO correlation.
4.3 Variations in With Spiral Structure
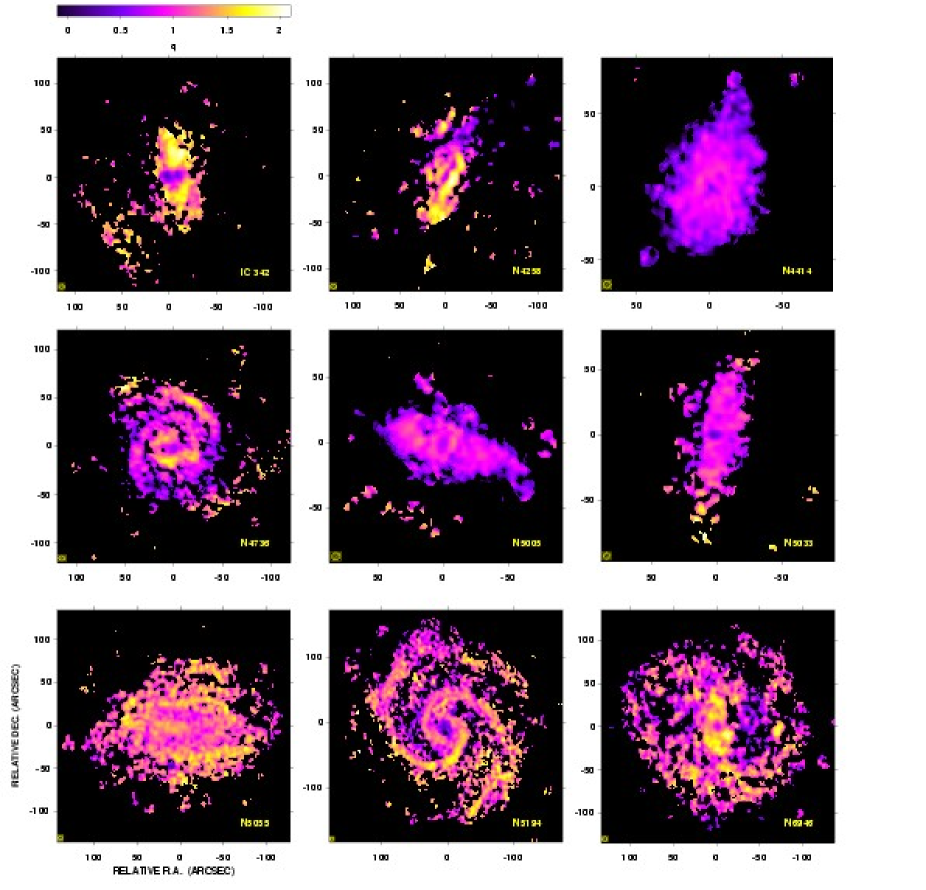
To investigate trends as a function of location within the galaxies, we also made images of the ratios for each source (Figure 6). All images are shown on a common color scale, so that color variations from source to source indicate real variations in .
There are clearly some differences in the distribution of among the different sources. For NGC 4414, NGC 5005, and NGC 5033, there is very little variation in , as evidenced by their low dispersions (Fig. 1). It is worth noting that both NGC 4414 and NGC 5005 are flocculent galaxies (Elmegreen & Elmegreen 1987), which lack prominent spiral structure. In NGC 4736 and NGC 5194 (M 51), systematic large-scale variations are apparent that follow the galaxies’ spiral structure. This is seen in NGC 6946 as well, with enhanced along the central north-south elongated structure (variously interpreted as a bar or as inner spiral arms; see Regan & Vogel 1995) and in the somewhat wispy arms to the southwest. In NGC 5055, there is a large-scale ringlike enhancement in ; remarkably, the enhancement in this flocculent prototype appears to follow nearly exactly two inner spiral arms revealed in imaging (Thornley 1996). The most significant, large-scale structures in therefore appear to be organized along spiral arms.
The two galaxies with the highest average and among the highest dispersion in are IC 342 and NGC 4258. The variations in in these galaxies do not appear to be closely correlated with spiral structure; however, these galaxies are unusual for other reasons, discussed further in Appendix A.
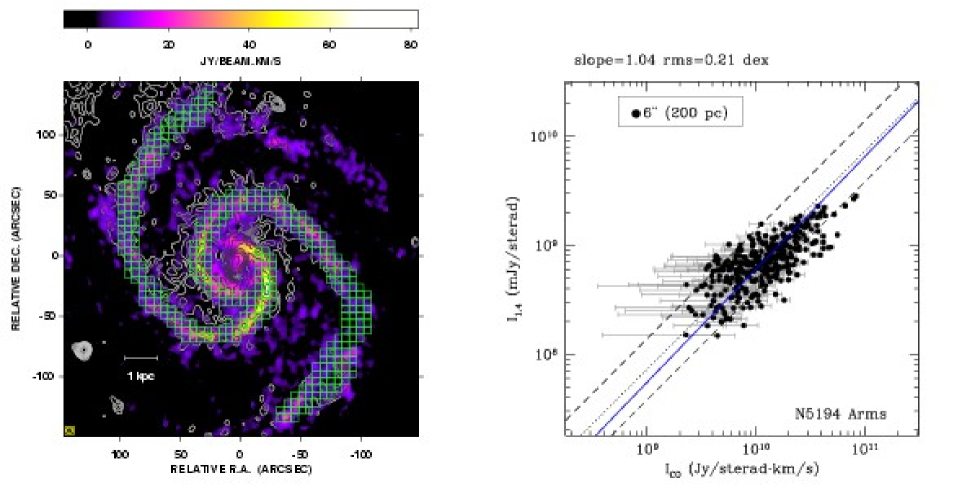
The association of higher CO/RC ratios on 1-2 kpc scales in spiral arms was noted by Adler et al. (1991), who also measured a larger scatter in the CO/RC relationship in these regions. Given the improved resolution of our images, we performed a further analysis of the RC-CO correlation behavior in the spiral arms of M51 with the intent of determining whether this systematic variation in might correspond to a breakdown in the correlation. We emphasize that we are sampling the RC and CO intensities at a spatial resolution of about 200 pc, a value which is significantly below the electron diffusion scale length. The result of this investigation is shown in Fig. 5. M51 still shows a tight linear RC-CO correlation, with a scatter of only 0.2 dex, within the arms. Based on this result, we cannot conclude that correlation breaks down at the linear scale of an arm width. If we consider the distribution of the CO/RC ratios in the arms, we get , which is only slightly above the average of that we get for the entire galaxy sample. In the interarm regions, we measure =. On top of this systematic effect, which appears to be associated with spiral structure, we observe larger but isolated deviations in which contribute to the correlation scatter. However, despite these localized variations there is still a remarkably low dispersion in the high-resolution CO-RC correlation. To summarize, we tend to measure an increase in CO/RC in spiral arms as seen earlier in Adler et al. (1991); unlike Adler et al., we do not see an increase in scatter within the spiral arms: the correlation dispersion is just as low.
| Galaxy | S1.4 | S60 | SCO | Reference | / | ||
|---|---|---|---|---|---|---|---|
| (mJy) | (Jy) | (Jy km s-1) | (kpc) | (kpc) | |||
| IC 342 | 2475 | 255.96 | 20000 | 1,2,3 | 3.5 0.2 | 6.21 0.06 | 0.56 |
| NGC 0628 | 180 | 20.86 | 1514 | 2 | 3.2 0.1 | 15.3 0.1 | 0.21 |
| NGC 1068 | 4991 | 181.95 | 4102 | 1.6 0.4 | 0.7 0.2 | 2.16 | |
| NGC 2903 | 407 | 60.03 | 3254 | 2.0 0.2 | 1.7 0.2 | 1.21 | |
| NGC 3351 | 48 | 19.92 | 1513 | - | - | - | |
| NGC 3521 | 357 | 47.02 | 4800 | 2.1 0.2 | 4.1 0.1 | 0.52 | |
| NGC 3627 | 458 | 67.8 | 4259 | 5.1 0.1 | 3.5 0.1 | 1.45 | |
| NGC 3938 | 62 | 9.24 | 923 | 4.0 0.2 | 6.3 0.1 | 0.64 | |
| NGC 4258 | 792 | 21.60 | 2686 | 1,2 | 2.1 0.2 | 3.1 0.3 | 0.70 |
| NGC 4303 | 416 | 37.53 | 2427 | 3.2 0.1 | 3.3 0.1 | 0.96 | |
| NGC 4321 | 340 | 25.86 | 2972 | 4.8 0.1 | 5.0 0.1 | 0.96 | |
| NGC 4414 | 231 | 30.11 | 2453 | 3.4 0.2 | 3.00 0.03 | 1.13 | |
| NGC 4569 | 83 | 10.08 | 1096 | 2.6 0.1 | 2.5 0.2 | 1.04 | |
| NGC 4736 | 254 | 69.2 | 2641 | 0.9 0.4 | 0.7 0.2 | 1.22 | |
| NGC 4826 | 103 | 35.45 | 1845 | 0.6 1.1 | 0.4 0.7 | 1.46 | |
| NGC 5005 | 176 | 22.3 | 1278 | 2.9 0.3 | 3.2 0.1 | 0.90 | |
| NGC 5033 | 178 | 16.45 | 2469 | 4.5 0.1 | 3.2 0.1 | 1.39 | |
| NGC 5055 | 390 | 40.02 | 3812 | 2.4 0.1 | 2.3 0.1 | 1.03 | |
| NGC 5194 | 1490 | 98.8 | 10097 | 2.9 0.1 | 3.4 0.1 | 0.84 | |
| NGC 5247 | 53 | 8.07 | 1102 | 4,5 | 7.1 0.2 | 7.3 0.1 | 0.97 |
| NGC 5248 | 140 | 20.71 | 1829 | 3.0 0.3 | 4.2 0.1 | 0.72 | |
| NGC 5457 | 750 | 88.04 | 3479 | - | - | - | |
| NGC 6946 | 1395 | 136.69 | 9273 | 2,4 | 2.5 0.2 | 3.83 0.04 | 0.65 |
| NGC 7331 | 373 | 35.29 | 2762 | 2,4 | 3.2 0.1 | 3.33 0.03 | 0.96 |
| Average | 0.98 0.41 |
-
Flux references: (1) S1.4 is 1.4 GHz RC from White & Becker 1992; (2) S60 is 60 m emission from Rice et al. 1988; (3) SCO from Crosthwaite et al. 2001; (4) S1.4 from Condon 1987. (5) S60,S100 from IRAS Faint Source Catalog; If not otherwise indicated, S1.4 is from Condon et al. 1990, S60 is from the IRAS Bright Galaxy Sample, Soifer et al. 1989, and SCO is from Helfer et al. 2003.
-
CO scale lengths modeled from the 55″ 12 m data.
-
RC scale lengths modeled from the low-resolution RC data from either the present study or from NVSS imaging.
4.4 The CO, RC and FIR Length Scales
We have modeled the CO and RC exponential scale lengths from 22 BIMA SONG galaxies with CO data taken from the 55″ 12 m data and the low-resolution RC data from either the present study or from NVSS imaging. The results are listed in Table LABEL:globalfluxes and shown in Figure 7. We note that the formal errors in the scale lengths almost certainly underestimate the true errors, for the following reasons: (1) the images often cover only 1–2 -folding lengths in the galaxies; (2) given the small coverage, the radial profiles may or may not be fairly represented by exponential functions. At higher resolution, the CO radial profiles have much more detailed structure and are in general not well characterized by exponentials (Regan et al. 2001); (3) there may be systematic errors in the CO data that are not well represented by the formal errors (Helfer et al. 2003); (4) we have not excluded background radio continuum sources; this error might tend to produce longer RC scale lengths than are present intrinsically. We note that some of the CO scale lengths derived here differ from those published in Regan et al. (2001). The scale lengths presented here are to be preferred (Regan 2004, private communication).
Despite the qualifications (which may also apply to previously determined FIR and RC scale lengths), the data in Table LABEL:globalfluxes suggest that on average, the CO scale lengths are comparable to the RC scale lengths, with = 0.98 0.41. This is true even though the dispersion in the average is large; that is, some galaxies show significantly longer or shorter CO disks than RC disks. We can further compare the FIR scale lengths modeled by Marsh & Helou (1995) with the BIMA SONG CO disk scale lengths for an overlap sample of 5 galaxies: NGC 2903, NGC 4303, NGC 5055, NGC 5194, and NGC 6946. (We exclude NGC 628, which lacks RC in the central region where the CO is present; the fit to the ringlike RC distribution yields a large scale length which is poorly determined. We also exclude NGC 7331, with ringlike emission in CO and RC that also precludes a good determination of its scale length.) After scaling the Marsh & Helou (1995) to a common distance scale with the BIMA SONG study, we find that for this subsample, = 0.69 0.07, = 0.65 0.14, and = 0.94 0.20. These results suggest that the FIR tends to have a smaller scale length than the RC or CO and that the RC and the CO may in some sense be more directly related to each other than either is to the FIR. New determinations of the FIR scale lengths using Spitzer imaging should help to clarify this issue.
5 Discussion
5.1 The Radial Correlations
The most significant deviation from the close correlation between the FIR and RC emission is a small, generally monotonic decrease in FIR/RC as a function of radius in many extragalactic sources (Beck & Golla 1988; Rice et al. 1990; Bicay & Helou 1990). In a seminal study, Marsh & Helou (1995) studied fully 2-dimensional maps of the FIR and RC emissions from 25 nearby galaxies, with improved, 1′ resolution over previous studies. Their results show decreasing ratios of FIR/RC in nearly all sources, with disk values at 4′ radius (10–20 kpc) that are lower by up to a factor of 10 than the central ratios. In the Marsh & Helou study, there are 3 galaxies in common with the present study: NGC 5055, NGC 5194, and NGC 6946. These galaxies show monotonic decreases in FIR/RC of a factor of 3.7, 4.1, and 2.8 over 4–5′ in radius. By contrast, the galaxies in the present study, including these three galaxies, do not show any apparent trend of CO/RC with radius (see bottom right panels of Figure 1). The CO-RC correlation therefore seems to be different from the FIR-RC correlation: the CO/RC shows no systematic trend with radius, and the CO and RC scalelengths seem to be on average equal, with both longer than the FIR scalelengths ( 4.4).
In the CO-RC correlation, we have seen that the strongest organized structures in are found along spiral arms, with enhanced along the spiral arms and lower values in the interarm regions. Recent Spitzer FIR imaging of M 81 (Gordon et al. 2004) shows very similar features: first, that the variations in are organized on size scales far greater than the resolution of the observations; and second, that these large-scale variations in strongly follow the spiral structure in M 81. In fact, though Gordon et al. don’t discuss this issue, an examination of the map of M 81 appears to show no systematic radial trend in .
How can the M 81 FIR-RC result and the CO-RC results presented in this study, namely that the strongest variations in the ratios are seen in azimuth across spiral arms, not as a radial variation, be justified with IRAS- and ISO-era observations that showed decreasing FIR-RC as a function of radius? If the strongest intrinsic variations are indeed across spiral arms, we note that the effect of these variations will generally be largest at small radius. That is, when averaged in azimuthal rings, the fraction of the total area in an annulus taken up by the spiral arms is much larger at small radius than it is at large radius. It may be that the measured radial falloff in FIR-RC is primarily a consequence of the low resolution of the FIR observations; it is essentially a measurement of the arm-interarm contrast of the galaxy. We predict that high-resolution Spitzer observations from the SINGS team (Kennicutt et al. 2003) and others will show that M 81 is not anomalous in this sense: the dominant variation will also be across spiral arms, with any radial trend being a secondary effect. In any case, Spitzer imaging will certainly further illuminate the issue of the relative strengths of the CO-RC, FIR-RC and the CO-FIR correlations.
5.2 A Brief Summary of Models of the FIR-RC and CO-RC Correlations
The global FIR-RC correlation is valid over five orders of magnitude in luminosity (Yun et al. 2001). We have shown in this paper that the RC, FIR and CO emission are also globally correlated, and that the CO-RC correlation is equally good on scales down to several hundred parsecs. However, the physical bases for understanding the FIR-RC and CO-RC correlations are not well understood. The problem is that the emission mechanisms are so different that it is difficult to understand why such a tight relationship should hold between them. The FIR emission is thought to be from dust heated by UV radiation from hot young stars and is therefore a reasonably good tracer of the star formation rate in a galaxy (e.g. Devereux & Young 1991). Because the extinction in the UV is so high, essentially all of the UV photons are absorbed by dust and are reprocessed into FIR emission. Few Lyman continuum photons are thought to escape from a galaxy (Leitherer et al. 1995; Heckman et al. 2001; Deharveng et al. 2001). Over scales of a few hundred parsecs or more, the RC emission from galaxies is typically at least 90% non-thermal (Condon 1992); for the galaxies in this paper, the thermal fractions at 1 GHz are typically 5–10% (Niklas, Klein & Wielebinski 1997). This synchrotron emission is due to cosmic-ray electrons spiraling around the galactic magnetic field. Why should the emission from relativistic cosmic-ray electrons be so tightly correlated with the FIR from dust? The CO emission from giant, turbulent, cloud complexes traces the bulk of molecular gas mass, even though it is optically thick. The good correlation between the CO and the FIR has been known for some time and is generally attributed to the intimate connection between massive star formation and molecular clouds (Devereux & Young 1991). That is, because CO has been found to be a reliable tracer of the mass of GMCs, and because the rate of massive star formation is related to the mass of molecular gas through an approximately constant star formation efficiency averaged over time (Rownd & Young 1999), the FIR, through the UV production and star formation rates, should be coupled to the CO emission. In detail, however, there is scatter of at least an order of magnitude in the CO-FIR relation (Young & Scoville 1991), and it has been difficult to relate the FIR reliably to a star formation rate for different types of galaxies (e.g. Kennicutt 1998; Bell 2003).
In the following, we briefly review some of the models previously posed to explain the FIR-RC and CO-RC correlations.
5.2.1 The FIR-RC Correlation: Conventional Picture and Calorimetric Models
In the conventional model, the FIR and the RC are correlated because each is a tracer of massive star formation: the RC through the supernovae that are ultimately produced from the recently formed massive stars and the FIR from the dust-reprocessed UV radiation from the stars themselves. But this explanation is wanting on several accounts. First, why should the density of cosmic-ray electrons and the strength of the interstellar magnetic field be closely coupled to the rate of star formation? The production of the RC emission requires a series of steps: massive star formation supernova production cosmic-ray acceleration interaction with the magnetic field, as does the FIR emission: massive star formation UV photon production absorption and reradiation by dust. To get the FIR-RC correlation to hold to a factor of two, as observed, each step must have a smaller range of variation than the observed correlation, which seems implausible. Furthermore, since the FIR-RC correlation is observed over a large range of physical scales, it is unclear why it should be so good on galactic scales, since star formation is a local process. In addition, star formation is seen to correlate well with thermal RC emission in HII regions (Boulanger & Perault 1988; Haslam & Osbourne 1987; Wells 1997), rather than the non-thermal emission on scales less than 100 pc, and there is not a particularly good correlation of supernova remnants with either sites of star formation (Wootten 1978) or with mid-IR or FIR emission (Cohen & Green 2001; Whiteoak & Green 1996).
Another problem with the conventional model is that the CO and RC both have a somewhat poorer correlation with other SFR indicators than they do with each other; indeed Bell (2003) raises issues about the linearity of the FIR-RC correlation by arguing that both indicators underestimate the star formation rates at low luminosities. Bell goes on to reach the unlikely conclusion that two unrelated effects have conspired to generate the observed correlation, without questioning the fundamental assumption that it is the star formation rate that provides the key link to the FIR-RC correlation. Leroy et al. (2004) show that the CO-RC correlation holds even for low-luminosity dwarf galaxies, suggesting that even further ad-hoc tuning would be necessary in order to understand the correlations among the CO and the FIR and RC within a conventional SFR framework. Notwithstanding Bell’s arguments regarding the suitability of the FIR and RC as star formation tracers, the correlations among the FIR-RC and CO-RC remain tight even if the FIR and RC underestimate the star formation, and we must look to an alternate explanation to understand the observed correlations.
Völk (1989) and others since have presented a calorimetric model in which the ratio of RC and FIR emissions is held constant by assuming that both the relativistic electrons as well as the UV photons are proportional to the SN rate. In this scenario, all systems are optically thick, so that all synchrotron or inverse Compton losses must occur in the host galaxy, and all the FUV radiation from massive stars is absorbed by dust grains within the galaxy. With both of these processes driven by the massive stars, the galaxy acts as a calorimeter.
Niklas & Beck (1997) show that only 30% of their 74-galaxy sample have radio spectral indices that support the optically thick model; however, Lisenfeld & Völk (2000) argue that cosmic ray electron convection, rather than diffusion, can flatten the spectra within the calorimeter model. Finally, the calorimeter model addresses the global energetics within galaxies, and it does not address the observed FIR-RC correlation that holds at least on kiloparsec size scales within galaxies, or the CO-RC correlation that holds down to size scales of 100 pc. This model thus seems to be unsatisfactory as a solution that holds generally for different kinds of galaxies at various resolutions.
In the phenomenological model by Helou & Bicay (1993), the FIR-RC correlation is driven by a tight coupling between the dust-heating photon luminosity and the production rate of cosmic ray electrons. The photon luminosity is regulated by the effective optical depth to the photons, and the CR luminosity is regulated by the efficiency with which the cosmic rays emit synchrotron radiation before they escape. In the optically thick case, the model is similar to calorimetric models, which Helou & Bicay postulate applies to infrared-luminous galaxies. In the optically thin case, which Helou & Bicay apply to normal galaxies, the photon luminosity and the CR luminosity are predicted to be approximately equal because of a coupling of the magnetic field with the gas density. Niklas & Beck (1997) however point out that in this model, the transition between galaxies with low and high radiation fields should be accompanied by an increase in the nonthermal spectral index, which they do not observe. Furthermore, Niklas & Beck show that their measured spectral indices do not correlate well with the equipartition magnetic field strength, in contradiction with the Helou & Bicay (1993) picture.
5.2.2 The CO-RC correlation: Cosmic Ray Heating and Secondary Electrons
Suchkov, Allen & Heckman (1993) present a model for the CO-RC correlation where the nuclear component of cosmic rays is responsible for heating the molecular gas while the electron component account for the synchrotron radiation. In this model, the CO need not be directly tracing star formation; rather, its emission depends on the cosmic rays that are products of high-mass star formation. This model is particularly attractive since it naturally provides a direct physical link between the CO line integrated intensity and the RC synchrotron emission. Bradford et al. (2003) show that the bulk of the molecular gas in the central 180 pc of NGC 253 is highly excited; these authors infer a temperature of K for the molecular gas and conclude that the best mechanism for heating gas is cosmic rays that are produced towards the starburst nucleus of this galaxy. However, we show that the observed CO-RC correlation spans more than three orders of magnitude in both quantities. This poses a serious problem for the CR heating model in that the molecular gas temperature should be raised by at least a factor of 1000. Thus, if it cannot be excluded that the CR heating is acting in some circumstances, it is difficult to accept it as the general explanation for the CO-RC correlation.
An interesting aspect of this picture, although not often addressed in literature, is the issue of the secondary electrons, which are produced by CR primaries interacting with the molecular gas (e.g. Marscher & Brown 1978). If the production of the secondary electrons is significant, then the CR nuclei could not only raise the molecular gas temperature but also enhance the synchrotron radiation. As outlined in 1, the RC emission from isolated giant molecular clouds is mostly thermal. Thus, the secondary electrons able to survive collisional losses will probably escape molecular clouds in a very short time-scale and diffuse in the disk where they became indistinguishable from the primaries. One can devise a scenario in which the CO-RC correlation is governed by the volume density of molecular clouds. The CO integrated intensity traces the number of clouds within the volume of the galaxy disk intercepted by the beam. On other hand, the secondary electron injection will also be proportional to the volume density of clouds, leading to a linear CO-RC correlation. A precise calculation of the secondary electron contribution implies special choices of rather uncertain parameters, such as the efficiency of energy transfer from supernovae to CRs and the ratio of primary electrons to nuclei in CRs (see e.g. Paglione et al. 1996) or the effective amount of diffuse molecular gas in the interstellar medium. While a detailed discussion of this issue is beyond the scope of this paper, such an intertwined relationship may help to explain the closeness of the CO and RC emission.
5.2.3 Cosmic-Ray Driven Interstellar Chemistry
Bettens et al. (1993) proposed that chemical evolution in molecular clouds, driven by the cosmic ray flux, is linked to the FIR flux through ion destruction in the clouds. While taking into consideration all three of the RC, FIR, and CO emissions, this theory neglects the strong influence of the interstellar magnetic field on the synchrotron radiation. The theory also makes rather specific predictions about how the relative abundances of molecules like HCN, H2CO, and CH3OH are tied to the nonthermal RC. Based on results from this paper and from how the HCN/CO ratios vary within the Milky Way and other galaxies (e.g. Helfer & Blitz 1997;), it seems unlikely that these predictions will hold in detail.
5.3 Hydrostatic Pressure as a Regulating Mechanism for the CO-RC Correlation
The difficulties in relating the seemingly independent emission mechanisms, and doing so over the range of size scales observed, suggest that there might be a single physical parameter that acts to correlate the observed quantities, rather than some process that relates them directly. We suggest that the parameter is the midplane hydrostatic pressure , modified by other large scale pressure variations such as those produced by the spiral arms. Recently, Wong (2000), Wong & Blitz (2002) and Blitz & Rosolowsky (2004) have suggested that the azimuthally averaged fraction of gas in the molecular phase, , or equivalently, the H2 to HI ratio, is determined by the radial variation in interstellar gas pressure, which can be approximated as
| (1) |
Here is the total surface density of gas, is the surface density of stars, is the velocity dispersion of the gas, and is the stellar scale height, which can be written in terms of the stellar velocity dispersion and midplane volume density as .
This expression for assumes that the midplane volume density of stars greatly exceeds the midplane volume density of gas, a condition that is satisfied throughout most disk galaxies except perhaps in spiral arms. One particular utility of this formulation is that both and are directly measurable, while and are observed to be fairly constant within galaxies (: Shostak & van der Kruit 1984; Dickey et al. 1990; : van der Kruit & Searle 1981a; 1981b; Fry et al. 1999). Furthermore, shows little variation from galaxy to galaxy about a value of 8 km s-1, and has a dispersion of only 50% from the mean (Kregel, van der Kruit & de Grijs 2002). In any event the dependence of the pressure on is weak due to the exponent of 0.5.
Let us first consider the origin of the CO-RC correlation. We begin by making the usual assumption that the CO surface brightness scales linearly with . Observations show that (Wong & Blitz 2002; Rosolowsky & Blitz in preparation). Because the surface density of atomic hydrogen is roughly constant with radius (e.g. Wong & Blitz 2002), we find that
| (2) |
The shallow decrease of with radius in some galaxies would increase the exponent slightly.
The RC emission, on the other hand, is determined largely by the synchrotron emissivity, which can be written as
| (3) |
where is the magnetic field strength, is the number density of cosmic-ray electrons with energies between energy and , and is the power law index of the spectrum of cosmic-ray energies such that (Condon 1992). The power law index of the observed synchrotron spectrum suggests that typically at GeV energies; thus we expect .
To express in terms of , we assume energy equipartition between the turbulent energy which dominates the hydrostatic pressure and the magnetic energy density , so that . This assumption has been discussed previously in the literature with regard to the FIR-RC correlation (e.g. Helou & Bicay 1993; Groves et al. 2003). We therefore expect .
To express in terms of , we consider the radial distributions of both quantities as observed in the Milky Way. The radial distribution of , although uncertain, is based on gamma-ray data from the Compton Gamma Ray Observatory, and yields a power-law fit: for R kpc (Strong & Mattox 1996). The radial distribution of is shown in Figure 8, using the data of Dame (1993) for and an exponential distribution of stars with a radial scale length of 3 kpc (Spergel, Malhotra & Blitz 1996) tied to a value of = 35 M☉ pc-2 at the solar circle. Beyond 4 kpc, is seen to have an approximately power law form with . Combining these two relations suggests that . We therefore expect
| (4) |
Combining Equations 2 and 4 yields
| (5) |
which is consistent within the uncertainties with the global results given in 4.1 and with the intermediate-resolution results of Murgia et al. (2002) for spiral galaxies and of Leroy et al. (2004) for dwarf galaxies.
As a check on the above derivation of , we note that if we combine the above result with Equation (2), we derive . For the large-scale observations presented here, in Murgia et al. (2002) and in Leroy et al. (2004), we have , which suggests a scaling of the CR electron density with pressure (quantities in brackets represent values averaged over the entire galaxy). For the sub-sample of the 9 bright galaxies studied at high resolution in this work, we instead observe . The sub-sample observations suggest that may be nearly independent from for these galaxies; in any case, the intrinsic variation from source to source suggests that could vary somewhat among galaxies. However, given the small scatter of the CO-RC correlation, it appears that varies only slowly with .

Next we consider how the FIR emission is related to both the CO and RC. The FIR emission has traditionally been linked to the CO emission through a Schmidt-type star formation law, with the assumption that the FIR is directly proportional to the star formation rate per unit area. This formulation works reasonably well for luminous FIR galaxies (Kennicutt 1998), but is problematic for normal and low-luminosity sources (Kennicutt 1998; Bell 2003).
Recently Dopita et al. (2004) proposed that the FIR emission itself is also directly related to : the ISM pressure sets the stall radius of the H ii region, so that with higher , the H ii region stalls at smaller radius and the mean dust temperature in the atomic and molecular shell around the H ii region should be higher. From stellar spectral synthesis modeling, Dopita et al. show that the 60 m flux is positively correlated with the ISM pressure, though in their “toy” model the increase is not enough to account for the corresponding increase in the RC emission. However, taken together with the above model of the CO-RC correlation, these models may have the potential to link all three of the CO-RC-FIR emissions with the interstellar pressure, without any explicit dependence on a Schmidt-type law or other star formation scenario. This is a particularly attractive feature given the problems with fitting the details of a generic starforming model to high- and low-SFR galaxies.
Why is it that the CO-RC-FIR relationship holds both globally and within galaxies to scales of a few hundred parsecs, but breaks down on smaller scales, scales of individual GMCs? Pressure mediation provides a natural scale for the relationship: the pressure scale height in galactic disks. On larger scales, hydrostatic pressure is determined by the slow variation of the gravity provided by the stars, on size scales equal to or larger than the thickness of the gas layer in a galactic disk. In the vicinity of the Sun, this scale is about 250 pc, but the thickness varies with galactic radius. Superposed on this is a higher spatial frequency variation in the spiral arms; on these and smaller scales, local pressure effects can become important.
Thus, our theory suggests that it is primarily HS pressure that drives the correlation by regulating both the fraction of gas in molecular form and the magnetic field strength. Secondary effects that can modify the basic correlation include (but are not limited to) spiral density waves, local star formation effects, and CR propogation.

5.4 Spectral Index Dependence on Hydrostatic Pressure: A Leaky Box Model
For our model to work requires a weak dependence of the CR electron density, , on HS pressure ( 5.3). The ordinary minimum energy argument instead accords equipartition to the energy of the relativisic electrons and that of the magnetic field, so that they both should scale with . This argument would lead to a RC-CO correlation much steeper than observed: , whereas we instead observe an exponent that is lower by an order of magnitude. Furthermore, it is commonly accepted that CR electrons diffuse from their injection sites. Thus, the CR electron density at a given location in the disk is the result of the balance between different processes such as the CR injection rate, the electron confinement time and energy losses.
To first approximation one might expect that the CR injection rate should be proportional to the SFR surface density, and thus, to the FIR emission. The FIR-CO correlation (Figure 2) would then lead to a direct scaling of with . However, this in contrast with the hydrostatic pressure model which predicts a weak dependence of on (see previous section).
Let us consider the simple hypothesis that a galaxy, or any star-forming region it contains, behaves essentially like a leaky box which is continuously replenished by a constant injection of fresh particles with a power law energy distribution at a rate . There are two time-scales which are relevant for the CR electron density. One is the confinement time of the electrons in the star-forming region, ; the other is the radiative life-time of the synchrotron electrons, . If , CR electrons will leave the galaxy disk (or the star-forming region) before losing their energy. That is, we expect that as the hydrostatic pressure increases, the star-formation rate grows, and with it the FIR emission and the cosmic ray injection rate. However, the strong stellar winds associated with intense star-formation rates will facilitate the propagation of the “excess” cosmic rays from the disk to the halo. In this regime, the synchrotron emission spectrum will be given by Eq. 3 with . Under the assumption of hydrostatic pressure regulation, we found that is nearly independent of ( 5.3); thus we expect , and we expect that the observed spectral index is about the same as the spectral index of the injected particles.
As the hydrostatic pressure decreases, will progressively increase. When , the CR electrons will lose all their energy inside the parent star-forming region and the synchrotron spectrum will be given by
| (6) |
with . In this asymptotic regime, the spectral index of the synchrotron radiation emission is 0.5 steeper with respect to the injection spectral index; i.e. for an injection spectral index of (see Fig. 9).

The electron synchrotron lifetime222The characteristic radiative age for electron emitting at 1 GHz in a 10 magnetic field is yr. at a given frequency scales as . Thus, under the hypothesis of energy equipartition , we have . In regions of strong star formation, where , we have seen that and ; therefore and
| (7) |
If we can further relate the particle injection rate to the star formation rate (and more tentatively, to the FIR luminosity) as , then
| (8) |
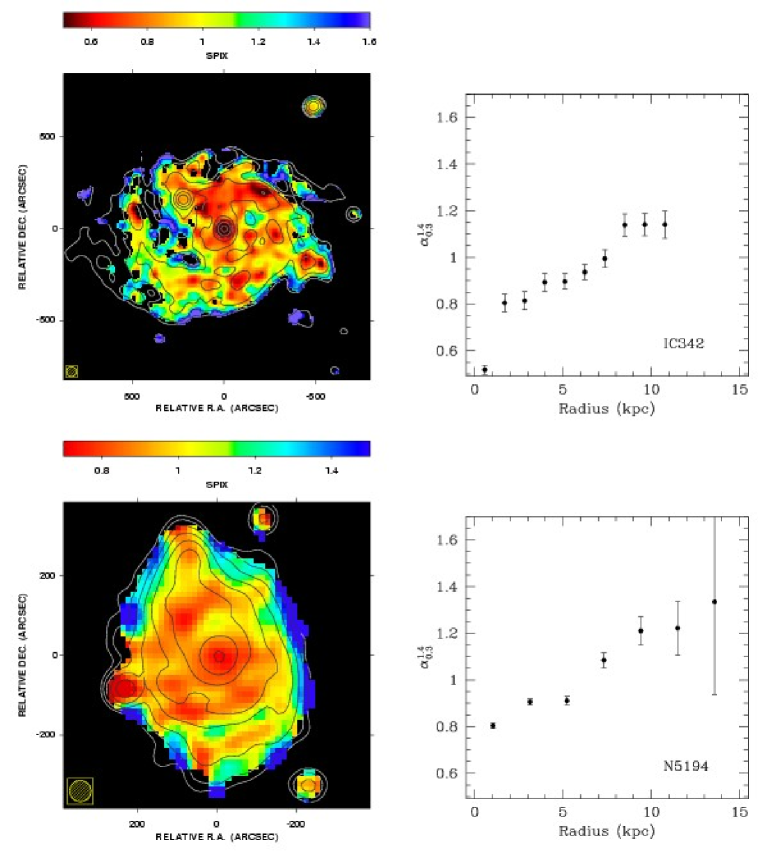
We have seen in 4.4 that the FIR emission may have a shorter scale length than the RC and CO emission, at least for galaxies with bright CO and relatively strong star formation. According to Eq. 8 and Fig. 9, we expect that an increase of the RC/FIR ratio with radius will result in an average radial steepening of the synchrotron spectrum in galaxy disks. In Fig. 10 we present the spectral index images of IC 342 and NGC 5194, measured between 327 MHz and 1.4 GHz. The 327 MHz images are taken from the Westerbork Northern Sky Survey and their resolution, about 54″, is well matched to that of the VLA D-array at 1.4 GHz. At these two frequencies, the contribution from thermal emission is negligible. Figure 10 shows that the spiral arms are characterized by . This indicates that these intense star-forming regions suffer a significant CR electron leakage. According with the predictions of the hydrostatic pressure model, in these high-pressure regions most probably . The interarm regions, or in general the underlying disks, are characterized by steeper spectra. The radially averaged spectral index profile show a monotonic steepening of the synchrotron spectrum with radius up to . This spectral behaviour suggests that as decreases, the confinement time of the radiating electrons in the disk became larger than .
It is worth noting that Niklas & Beck (1997) used a similar argument to test the phenomenological model of Helou & Bicay (1993). Niklas & Beck concluded that on global scales, this model failed to produce the expected dependence on spectral index for galaxies with different radiation fields and magnetic field strengths. Indeed, the linearity of the global RC-FIR correlation, indicates that is, on average, constant. This explains why a relation between spectral index and magnetic field is not seen on global scales. However, we have extended this idea to local scales, within galaxy disks. According to Figs. 9 and 10, we expect to be some fraction of within disks.
To summarize, we have used observationally determined relationships between the molecular gas surface density and the hydrostatic pressure to express the CO and RC intensities in terms of . Both quantities scale with pressure since high-pressure regions tend to be more molecular and, under the assumption of energy equipartition between the turbulent energy of the gas and the magnetic field energy, their synchrotron radiation amplified. For the hydrostatic pressure model to work requires a weak dependence of the cosmic ray electron density on pressure in disk galaxies. The observed radial gradient of cosmic ray electrons in the Milky Way appears to support this hypothesis. If cosmic ray leakage is taken into account, we show that this condition is compatible with a scenario in which the cosmic ray confinement time of the synchrotron electrons is inversely proportional to the SFR. The spatially resolved spectral index images of IC 342 and NGC 5194 are in general agreement with this prediction.
6 Conclusions
We have presented a comparison of the global RC, FIR, and CO in 24 BIMA SONG galaxies and a detailed study of the high-resolution (6″) CO-RC correlation in a subset of 9 sources. Our main conclusions are as follows:
(1) The global correlations between CO-RC, FIR-RC, and FIR-CO are comparably tight, and we cannot identify any of the relations as being a fundamental one.
(2) At 6″ resolution, for CO-bright galaxies, the CO-RC correlation is as tightly correlated as its global value, down to 100 pc size scales. The correlation between the CO and RC emission is linear with a dispersion that is less than a factor of two.
(3) Despite the low dispersion in the correlation, there are systematic variations in . The organized structures in are found along spiral arms and on size scales much larger than the resolution of the observations.
(4) Combining the above two points suggests that, down to 100 pc scales, there does not appear to be a characteristic size scale where the CO-RC correlation breaks down.
(5) Unlike the FIR-RC correlation, there is no systematic trend in CO-RC as a function of radius in galaxies. We speculate that high-resolution Spitzer observations will show detailed spatial correlation between the FIR and RC and CO. We also expect that Spitzer will show that the dominant variation in the FIR-RC correlation is across spiral arms, rather than in a radial trend.
(6) We propose that the correlations between the RC and CO on large and small scales may be explained as a consequence of regulation by hydrostatic pressure in galaxies. We use observationally determined relationships between the molecular gas surface density and the hydrostatic pressure to derive a relationship between the CO and RC intensities. Taken together with recent results linking the FIR emission with ISM pressure by Dopita et al. (2004), these scenarios link all three of the CO-RC-FIR emissions with the interstellar pressure, without invoking any explicit dependence on a star formation scenario.
(7) Under the assumption of hydrostatic pressure regulation, we use a leaky box model of cosmic rays to show that the spectral index between 327 MHz and 1.4 GHz depends on the ratio of the confinement time of the electrons in the star-forming region, , to their synchrotron lifetime, . We expect that in regions of high hydrostatic pressure, and . As the pressure decreases, the electrons decay before escaping the disk, , and the spectral index steepens to . We show spectral index maps of IC 342 and NGC 5194 that reflect this kind of dependence, with in the spiral arms and a monotonic steepening with radius up to .
Acknowledgements.
The authors thank an anonymous referee for the valuable comments and suggestions. We thank Hans Bloemen, Alberto Bolatto, Al Glassgold, Anne Green, Wim Hermsen, David Hollenbach, John Lugten, Chris McKee, Andy Strong, and Peter Teuben for helpful discussions. We are grateful to Rainer Beck, who provided us with his M51 radio-continuum image. Erik Rosolowsky kindly produced Figure 8 for us. T.T.H. is grateful to M. W. Regan for a helpful exchange regarding the CO scale lengths. This work is partially supported by NSF grant 0228963 to the Radio Astronomy Laboratory at UC Berkeley. M.M. wish to thank the Berkeley Radio Astronomy Laboratory for their hospitality during the development of this work.Appendix A Notes on Individual Galaxies
IC 342. At d=3.9 Mpc, IC 342 is the nearest galaxy in the sample, and the high-resolution images provide linear resolutions of 100 pc. (A recent Cepheid distance determination by Saha, Claver, & Hoessel 2002 suggests that d=3.3 Mpc, which would provide slightly improved linear resolution.) A prominent (though kinematically weak) north-south bar dominates the CO emission in the inner 2′ of this starburst source, with two spiral arms at larger distances north and south of the bar (Crosthwaite et al. 2001). Within the central bar, the scatter of the correlation is higher than it is at larger distances. The most significant deviation from the correlation is found in the inner 15″ where the peak of the RC emission is times higher with respect to the CO emission. This starburst galaxy may be a large-scale analog to starforming regions in the Milky Way, which do not exhibit the RC-FIR correlation on size scales of a few hundred pc (e.g. Boulanger & Perault 1988). However, it is relevant to note that on larger (55″, or 1.0 kpc) scales, the CO-RC correlation remains tight.
NGC 4258. The radio emission in this unusual source is associated with two, large-scale “anomalous arms” not seen in the optical but detected first in H (Courtes & Cruvellier 1961). In the inner galaxy, the radio emission is clearly associated with jets, presumably related to the AGN activity associated with the supermassive black hole; however, at larger distances, the nature of the radio emission is not so clear (e.g. Krause & Löhr 2004 and references therein). A detailed discussion of this unusual galaxy is beyond the scope of this paper, and a proper discussion of the RC-FIR-CO correlations in this source would warrant a separate study. However, we include NGC 4258 here and emphasize that, even in this highly unusual source, the CO-RC correlation is very good over those regions where both CO and RC are present.
NGC 4414. The “low-resolution” RC emission from this source has been convolved from 14″ resolution up to 55″, and at 55″, the RC emission as well as the CO emission are only marginally resolved. One must therefore be somewhat cautious about whether the 55″ pixels shown in the point-by-point comparison in the upper right panel of Figure 1() are truly independent. However, at 6″, the CO and RC structures of this galaxy are revealed as a ring with a diameter of 5 kpc. NGC 4414 is a flocculent galaxy, which means that it lacks prominent spiral structure in optical light, though Thornley (1996) found that imaging revealed low-level spiral structure. However, of four sources with newly-revealed spiral arms presented by Thornley, NGC 4414 remained “the most flocculent of the sample in emission”. The image shown in Figure 6 appears to be nearly featureless and shows a dispersion of only 0.09; that is, the CO/RC intensity ratio varies by only a factor of 1.2. On the other hand, the dynamic range of emission in the CO and RC varies by only slightly more than one order of magnitude.
NGC 4736. The molecular gas in this nearby source is distributed in a central molecular bar and in two tightly wound spiral arms which are associated with a bright ring of star formation (Wong & Blitz 2000). A background radio continuum source, apparent in the upper left panel of Figure 1(), has been omitted from the analysis in this paper. As discussed in 4.3, there appears to be an enhancement in (Figure 6) associated with the northwestern spiral arm; the enhancement may be a result of the starburst there. It also appears that is larger at the bar ends, at roughly 15″ from the galaxy center, and along the “arclike” extensions from the bar that probably are associated with the beginnings of the spiral structure (Wong & Blitz 2000).
NGC 5005. Two background continuum sources are apparent in the low-resolution RC images of NGC 5005; these have been omitted from all analysis. Like NGC 4414, the 55″ observations show that the CO and RC is only slightly resolved. At 6″ resolution, the central unresolved RC emission is associated with a nonstellar active galactic nucleus (AGN). Outside the nucleus, the agreement between the RC and CO emission is excellent, as can be seen both in Figure 1() as well as in Figure 6; the image is nearly featureless and has low dispersion.
NGC 5033. Like NGC 5005, NGC 5033 has an unresolved AGN at its nucleus, and its image is nearly featureless. An enhancement in is seen at the southern end of the CO emission; however, this CO emission is detected only at a 3 level and might be spurious. Background continuum sources are apparent in both the high- and low-resolution data sets.
NGC 5055. NGC 5055 is the prototypical flocculent spiral galaxy, which (like NGC 4414) was revealed to have regular spiral structure in -band imaging (Thornley 1996). At 6″ resolution, the RC and the CO emissions appear nearly featureless, though an inspection of the CO image and especially the image (Figure 6) show structures that follow very closely what appear to be inner spiral arms in Thornley’s -band image. Nonetheless, the dispersion in is only 0.11.
NGC 5194. The Whirlpool galaxy M 51 is the prototypical grand design spiral galaxy, with two prominent spiral arms where the molecular gas is generally confined. The arms wind in towards the center of the galaxy but remain in two distinct peaks; the molecular gas lacks emission right at the nucleus. The RC at the nucleus is dominated by the AGN activity. The image is remarkable in that it shows strong enhancements along the spiral arms, as discussed in 4.3.
NGC 6946. This nearby starburst galaxy has an elongated, bright north-south molecular feature in the inner 50″ and wispy arms at larger radii. The image (Figure 6) and profile (Figure 1) show an enhanced ratio within the central region, apart from the compact HII region nucleus, which shows relatively enhanced RC emission. Like IC 342, it may be that this region is a large-scale analog to active starforming regions in the Milky Way.
References
- Adler, Lo, & Allen (1991) Adler, D. S., Lo, K. Y., & Allen, R. J. 1991, ApJ, 382, 475
- Appleton et al. (2004) Appleton, P. N., et al. 2004, ApJS, 154, 147
- Beck & Golla (1988) Beck, R. & Golla, G. 1988, A&A, 191, L9
- Bell (2002) Bell, E. F. 2003, ApJ, 586, 794
- Bettens et al. (1993) Bettens, R. P. A., Brown, R. D., Cragg, D. M., Dickinson, C. J., & Godfrey, P. D. 1993, MNRAS, 263, 93
- Bicay & Helou (1990) Bicay, M. D. & Helou, G. 1990, ApJ, 362, 59
- Blitz & Rosolowsky (2004) Blitz, L. & Rosolowsky, E. 2004, ApJL, 612, L29
- Boulanger & Perault (1988) Boulanger, F. & Perault, M. 1988, ApJ, 330, 964
- Bradford et al. (2003) Bradford, C. M., Nikola, T., Stacey, G. J., Bolatto, A. D., Jackson, J. M., Savage, M. L., Davidson, J. A., & Higdon, S. J. 2003, ApJ, 586, 891
- Cohen & Green (2001) Cohen, M. & Green, A. J. 2001, MNRAS, 325, 531
- Condon (1987) Condon, J. J. 1987, ApJS, 65, 485
- (12) Condon, J.J., 1992, ARA&A, 30, 575
- (13) Condon, J. J., Cotton, W. D., Greisen, E. W., Yin, Q. F., Perley, R. A., Taylor, G. B., & Broderick, J. J. 1998, AJ, 115, 1693
- Condon, Helou, Sanders, & Soifer (1990) Condon, J. J., Helou, G., Sanders, D. B., & Soifer, B. T. 1990, ApJS, 73, 359
- Courtes & Cruvellier (1961) Courtes, G. & Cruvellier, P. 1961, Publications of the Observatoire Haute-Provence, 5
- Crosthwaite et al. (2001) Crosthwaite, L. P., Turner, J. L., Hurt, R. L., Levine, D. A., Martin, R. N., & Ho, P. T. P. 2001, AJ, 122, 797
- Dame (1993) Dame, T. M. 1993, AIP Conf. Proc. 278: Back to the Galaxy, 278, 267
- Deharveng et al. (2001) Deharveng, J.-M., Buat, V., Le Brun, V., Milliard, B., Kunth, D., Shull, J. M., & Gry, C. 2001, A&A, 375, 805
- Devereux & Young (1990) Devereux, N. A. & Young, J. S. 1990, ApJ, 359, 42
- Devereux & Young (1991) Devereux, N. A. & Young, J. S. 1991, ApJ, 371, 515
- Dickey, Hanson, & Helou (1990) Dickey, J. M., Hanson, M. M., & Helou, G. 1990, ApJ, 352, 522
- Dopita et al. (2004) Dopita, M., et al. 2004, ArXiv Astrophysics e-prints, astro-ph/0407008
- Elmegreen & Elmegreen (1987) Elmegreen, D. M. & Elmegreen, B. G. 1987, ApJ, 314, 3
- Fry, Morrison, Harding, & Boroson (1999) Fry, A. M., Morrison, H. L., Harding, P., & Boroson, T. A. 1999, AJ, 118, 1209
- Gordon et al. (2004) Gordon, K. D., et al. 2004, ApJS, 154, 215
- Groves, Cho, Dopita, & Lazarian (2003) Groves, B. A., Cho, J., Dopita, M., & Lazarian, A. 2003, PASA, 20, 252
- Haslam & Osbourne (1987) Haslam, C.G.T. & Osbourne, J.L. 1987, Nature, 327, 211
- Heckman et al. (2001) Heckman, T. M., Sembach, K. R., Meurer, G. R., Leitherer, C., Calzetti, D., & Martin, C. L. 2001, ApJ, 558, 56
- Helfer & Blitz (1997) Helfer, T. T. & Blitz, L. 1997, ApJ, 478, 162
- Helfer & Blitz (1997) Helfer, T. T. & Blitz, L. 1997, ApJ, 478, 233
- (31) Helfer, T.T., Thornley, M.D., Regan, M.W., Wong, T., Sheth, K., Vogel, S.N., Blitz, L., Bock, D.C.-J., 2003, ApJS, 145, 259
- Helou & Bicay (1993) Helou, G. & Bicay, M. D. 1993, ApJ, 415, 93
- Israel & Rowan-Robinson (1984) Israel, F. & Rowan-Robinson, M. 1984, ApJ, 283, 81
- Kennicutt (1998) Kennicutt, R. C. 1998, ApJ, 498, 541
- Kennicutt et al. (2003) Kennicutt, R. C., et al. 2003, PASP, 115, 928
- Leitherer, Ferguson, Heckman, & Lowenthal (1995) Leitherer, C., Ferguson, H. C., Heckman, T. M., & Lowenthal, J. D. 1995, ApJ, 454, L19
- A&A & Löhr (2004) Krause, M. & Löhr, A. 2004, A&A, 420, 115
- Kregel, van der Kruit, & de Grijs (2002) Kregel, M., van der Kruit, P. C., & de Grijs, R. 2002, MNRAS, 334, 646
- Leroy et al. (2004) Leroy, A., Bolatto, A., Simon, J., & Blitz, L. 2004, ApJ, submitted
- Lisenfeld Volk (2000) Lisenfeld, U., Völk, H. J. 2000, A&A, 354, 423
- Marscher & Brown (1978) Marscher, A. P. & Brown, R. L. 1978, ApJ, 221, 588
- Marsh & Helou (1995) Marsh, K. A. & Helou, G. 1995, ApJ, 445, 599
- (43) Murgia, M., Crapsi, A., Moscadelli, L.,Gregorini, L., 2002, A&A, 385, 412
- Niklas & Beck (1997) Niklas, S. & Beck, R. 1997, A&A, 320, 54
- Niklas, Klein, & Wielebinski (1997) Niklas, S., Klein, U., & Wielebinski, R. 1997, A&A, 322, 19
- Paglione, Marscher, Jackson, & Bertsch (1996) Paglione, T. A. D., Marscher, A. P., Jackson, J. M., & Bertsch, D. L. 1996, ApJ, 460, 295
- (47) Regan, M.W., Thornley, M.D., Helfer, T.T., Sheth, K., Wong, T., Vogel, S.N., Blitz, L., Bock, D.C.-J., 2001, ApJ, 561, 218
- Regan & Vogel (1995) Regan, M. W. & Vogel, S. N. 1995, ApJL, 452, L21
- Rice et al. (1988) Rice, W., Lonsdale, C. J., Soifer, B. T., Neugebauer, G., Koplan, E. L., Lloyd, L. A., de Jong, T., & Habing, H. J. 1988, ApJS, 68, 91
- Rice et al. (1990) Rice, W., Boulanger, F., Viallefond, F., Soifer, B. T., & Freedman, W. L. 1990, ApJ, 358, 418
- Rickard, Turner, & Palmer (1977) Rickard, L. J., Turner, B. E., & Palmer, P. 1977, ApJL, 218, L51
- Rownd & Young (1999) Rownd, B. K. & Young, J. S. 1999, AJ, 118, 670
- Saha, Claver, & Hoessel (2002) Saha, A., Claver, J., & Hoessel, J. G. 2002, AJ, 124, 839
- Sault, Teuben, & Wright (1995) Sault, R.J., Teuben, P.J., & Wright, M.C.H. 1995, in Astronomical Data Analysis Software and Systems IV, eds. R.A. Shaw, H.E. Payne, & J.J.E. Hayes, A.S.P. Conference Series 77, 433
- Shostak & van der Kruit (1984) Shostak, G. S. & van der Kruit, P. C. 1984, A&A, 132, 20
- Soifer, Boehmer, Neugebauer, & Sanders (1989) Soifer, B. T., Boehmer, L., Neugebauer, G., & Sanders, D. B. 1989, AJ, 98, 766
- Spergel, Malhotra, & Blitz (1996) Spergel, D. N., Malhotra, S., & Blitz, L. 1996, Spiral Galaxies in the Near-IR, Proceedings of the ESO/MPA Workshop Held at Garching, Germany, 7-9 June 1995 edited by Dante Minniti and Hans-Walter Rix. Springer-Verlag Berlin Heidelberg New York. Also ESO Astrophysics Symposia (European Southern Observatory), 1996, p.128, 128
- Strickland et al. (2004) Strickland, D. K., Heckman, T. M., Colbert, E. J. M., Hoopes, C. G., & Weaver, K. A. 2004, ApJ, 606, 829
- Strong & Mattox (1996) Strong, A. W. & Mattox, J. R. 1996, A&A, 308, L21
- Suchkov, Allen, & Heckman (1993) Suchkov, A., Allen, R. J., & Heckman, T. M. 1993, ApJ, 413, 542
- Thornley (1996) Thornley, M. D. 1996, ApJL, 469, L45
- van der Kruit & Searle (1981) van der Kruit, P. C. & Searle, L. 1981, A&A, 95, 105
- van der Kruit & Searle (1981) van der Kruit, P. C. & Searle, L. 1981, A&A, 95, 116
- van Gorkom & Ekers (1989) van Gorkom, J. H. & Ekers, R. D. 1989, ASP Conf. Ser. 6: Synthesis Imaging in Radio Astronomy, 341
- Völk (1989) Völk, H. J. 1989, A&A, 218, 67
- Wells (1997) Wells, B. S. 1997, Publications of the Astronomical Society of Australia, 14, 292
- White & Becker (1992) White, R. L. & Becker, R. H. 1992, ApJS, 79, 331
- (68) White, R. L., Becker, R. H., Helfand, D. J., & Gregg, M. D. 1997, ApJ, 475, 479
- Whiteoak & Green (1996) Whiteoak, J. B. Z. & Green, A. J. 1996, A&AS, 118, 329
- Wilson, Yang, & Cecil (2001) Wilson, A. S., Yang, Y., & Cecil, G. 2001, ApJ, 560, 689
- (71) Wong, T. 2000, Ph.D. thesis, Univ. California, Berkeley
- Wong & Blitz (2000) Wong, T. & Blitz, L. 2000, ApJ, 540, 771
- Wong & Blitz (2002) Wong, T. & Blitz, L. 2002, ApJ, 569, 157
- Wootten (1978) Wootten, H. A. 1978, Ph.D. Thesis
- Young & Scoville (1991) Young, J. S. & Scoville, N. Z. 1991, Ann Rev Astron Astroph, 29, 581
- (76) Yun, M.S., Reddy, N.A., Condon, J.J., 2001, ApJ, 554, 803