United Laboratory of Optical Astronomy, CAS
National Astronomical Observatories, China
Email: mailhejh@yahoo.com.cn
On the difference between type E and A OH/IR stars.
The observed SEDs of a sample of 60 OH/IR stars are fitted using a radiative transfer model of a dusty envelope. Among the whole sample, 21 stars have reliable phase-lag distances while the others have less accurate distances. , and relations have been plotted for these stars. It is found that type E (with emission feature at ) and type A (with absorption feature at ) OH/IR stars have different and relations while both of them follow a single relation. The type E stars are proven to be located in the area without large scale dense interstellar medium while the type A stars are located probably in dense interstellar medium. It is argued here that this may indicate the two types of OH/IR stars have different chemical composition or zero age main sequence mass and so evolve in different ways. This conclusion has reinforced the argument by Chen et al. (2001) who reached a similar conclusion from the galactic distribution of about 1000 OH/IR stars with the IRAS low-resolution spectra (LRS).
Key Words.:
stars: AGB and post-AGB—star: mass loss, evolutionmailhejh@yahoo.com.cn
1 Introduction
Recently Chen et al. (2001) have published a catalogue of OH/IR stars with IRAS LRS spectra. They also argued that many type E OH/IR stars which are located at high galactic latitude will never evolve into type A OH/IR stars . In order to examine the differences between the two groups of OH/IR stars (type E and A), it is tried in this paper to investigate the luminosity-period relation and mass loss rate-period relation of the two groups by radiative transfer modeling. The observed data and the radiative transfer model used are described in sections 2 and 3, and a detailed discussion of the derived quantities and conclusions can be found in section 4.
2 Data
A sample of 60 OH/IR stars with known distances is collected from the literature; 36 of them belong to type E, 18 belong to type A. For the purpose of comparison, 3 type H stars (red continuum), 2 type U stars (unusual spectrum) and 1 type F star (featureless) are also included. The observational SED (Spectral Energy Distribution) of each star consists of three parts: near infrared (NIR) photometry taken from ground based observations, IRAS far infrared (FIR) photometry and IRAS LRS spectrum. The LRS spectra are from the on-line IRAS Data Analysis Facility of the University of Calgary. The FIR fluxes are obtained from the CD-edition of the published IRAS PSC catalogue and only those fluxes with good quality () are used. The NIR photometry data of 21 OH/IR stars are given by Xiong et al. (1994), and that of the remaining 39 stars are taken from different papers. The references for NIR photometry data are listed in Table 1. The NIR data are corrected for interstellar extinction. The formula of van Herk (1965) is used:
| (1) |
where b is the galactic latitude, d is the distance from the sun. We also use the method from Cardelli et al. (1989) to calibrate the data at different wavelengths.
The periods of pulsation for 46 stars are also searched from Chen et al. (2001). Twinty one sample stars have the so called phase-lag distances (this is the most accurate distance available for OH/IR stars up till now, and hereafter these stars are called as the phase-lag sample, and the whole 60 stars as whole sample), and these distances are taken from Baud and Habing (1983), Herman et al. (1986) and van Langevelde et al. (1990). The distances of the other stars are taken from different papers where they are estimated by other methods, e.g. kinematic method, using relation and so on, and so they are not very accurate (error can be larger than ). The references for distance are listed also in Table 1. For the phase-lag sample, the periods, expansion velocities and phase-lag distances are shown in Table 2.
3 Modeling
3.1 Model description
The radiative transfer model of a spherical dusty envelope is used to fit the observed SEDs. The model used is originally compiled by Szczerba et al. (1997) . This code is able to calculate the emerging flux spectrum of a spherical shell observed at a specified distance when the luminosity () and effective temperature () of the central star and dust species, dust condensation temperature (), dust density distribution (), grain size distribution and the geometrical sizes of the envelope are given. The original code is slightly modified so as to make it possible to vary only the following five quantities when fitting SEDs: ,,, and , while the other quantities are fixed at their typical values: astronomical silicate grains whose electric permittivity and magnetic permeability are taken from Drain and Lee (1984) and Drain (1985); grain size distribution of interstellar dust as with the grain size range from to Mathis et al. (1977) . Here is the total optical thickness at , is the index of negative exponential density distribution law and is the relative geometrical thickness . The extinction coefficient and the albedo of dust grains are calculated from Mie theory. In order to fit the observed SEDs, 2475 models have been calculated by varying from K to K, from K to K, from to , form to and from to .
3.2 Model fitting
The models calculated above are used to fit the observed SEDs simply by weighted linear interpolation. The weights are given larger for LRS spectrum and FIR data and smaller for the NIR data because the NIR fluxes are varied for most sample stars. After having derived ,,, and the best fitted model SED for each star from above, it is easy to determine the luminosity () and gas mass loss rate () (when the outflow velocity is known) by assuming the dust to gas mass ratio to be for all stars. Here it should be pointed out that the mass loss rate is calculated at the inner border of the circumstellar shell, hence this quantity is theoretically in the simultaneous measure with the luminosity of the center star. Some derived quantities of the phase-lag sample stars are listed also in Table 2.
4 Analysis on the fitted results
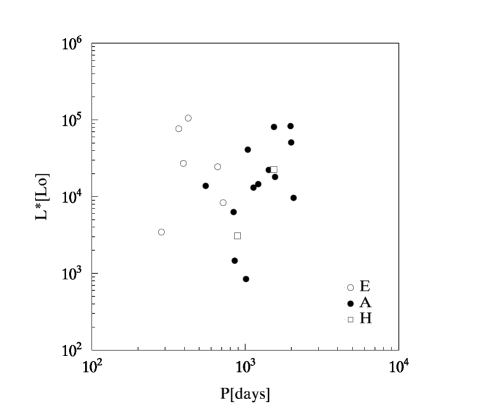
Firstly the luminosity-period relation ( relation) for the phase-lag sample of OH/IR stars is shown in Fig. 1. As we can see, for both type E and A stars, the luminosity seems to be larger for longer period, but the luminosity for the two types seem to be going along parallel paths, that is to say, the two relations do not join with each other smoothly from that of the type E to that of the type A as we expected. But it is difficult to draw any convincing conclusion from Fig. 1, because too few type E OH/IR stars are included in this figure. Then the same figure for the whole sample is displayed in Fig. 2 where many more type E stars are included. This figure is proven to confirm the conclusion of Fig. 1. The relation does follow different tracks for the type E and A OH/IR stars, although the dispersion in the relation is large for both types. In both Fig. 1 and 2, type H stars are located in type A region and seem to follow the relation of type A stars.


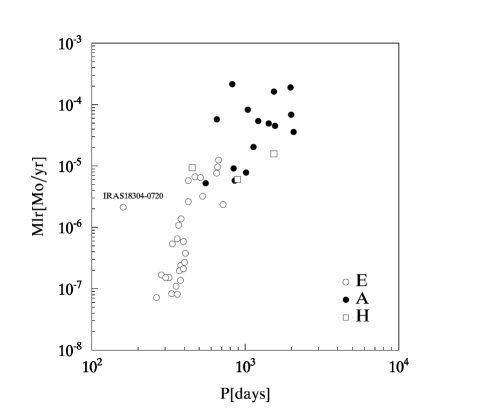
The relation of OH/IR stars and Miras had been addressed by many other authors Whitelock et al. (1991); Le Bertre (1993); Blommaert et al. (1998), but all of them had considered only a small number of OH/IR stars and taken them as a single class. Here we divid the OH/IR stars into different subclasses according to their IRAS LRS classification and more stars have been included. This give us the chance to see some inner structures of the relation for OH/IR stars, as described above.
The mass loss rate-period relation ( relation) of the whole sample is plotted in Fig. 3. It is easy to see that the whole sample follows a single relation and, just as we already know, the mass loss rates increase from type E stars with shorter period to type A stars with longer period. Similar relation had ever been found before for M-type stars by some other authors, eg. Whitelock et al. (1994). It should be noted that one star is located far from the majority; it is IRAS 18304-0720. This star is found to be seriously contaminated by cirrus emission, and extended structures have been detected around it in all four IRAS bands (). Hence the observed spectral energy distribution of this star no longer represents that of a single shell.
The relation is shown in Fig. 4. In this figure the type E stars seem to distribute in an area different from that of the stars of other types. Although the luminosity of type E stars can be very large, the mass loss rate seems always to be smaller than that of the other types with the same luminosity.
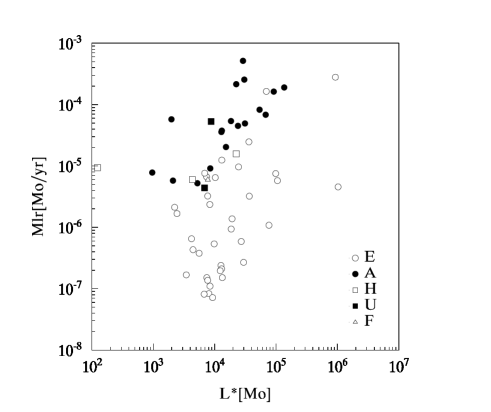
From the discussion above, the and relation of type E and A stars seems to follow different tracks while the relation of all types in the whole sample follow the same track. What do these facts mean to the evolution of OH/IR star? According to the general evolutionary picture of AGB star, the luminosity and the mass loss rate of the AGB stars should increase with time and both of them should be the function of the zero age main sequence mass () and chemical abundance. If we assume that all OH/IR stars are evolved from the progenitors of similar and chemical abundance and the type E ones are the precursors of the type A ones as we expected, it is reasonable to expect that both the luminosity and the mass loss rate of the type E ones should be smaller than that of the type A ones. But in Fig. 4 of our paper, many type E stars can reach high luminosity while their mass loss rates are always smaller than that of the type A stars with the same luminosity. From our Fig. 1,2,6 and 7, we can also see that some type E stars can evolve into luminous objects even if their period is shorter than type A ones. This give us the hint that some of the two types of OH/IR stars may not evolve from the same population of progenitors (with similar and chemical abundance). If this is the right, we can safely infer from the single relation obeyed by the whole sample that the differences in and chemical abundance of the progenitors have little effect in the relation of OH/IR stars.
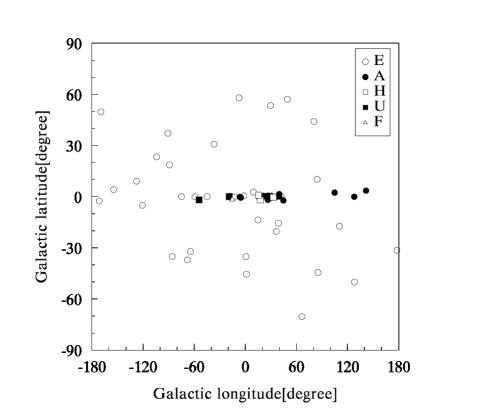
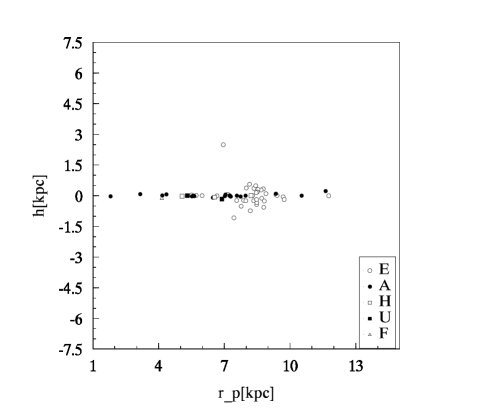
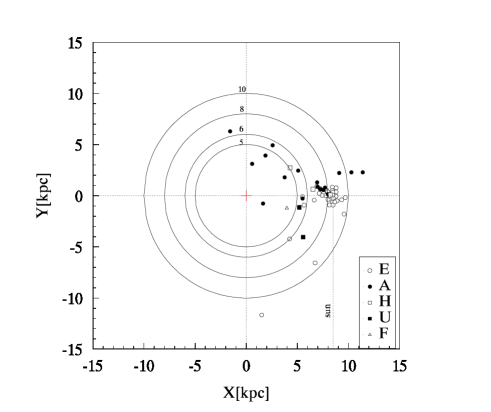
Chen et al. (2001) have argued that there are probably many type E OH/IR stars which would never evolve into type A ones, because they found that type A OH/IR stars are mainly located on the galactic plane while many type E stars are located at high galactic latitude (see their Fig. 5). Here a similar figure is given in Fig. 5a which shows a similar distribution of different types of OH/IR stars. In addition, the more detailed position information of these stars are also shown in Fig. 5b and 5c. The distances from the stars to the galactic plane and from the projection of these stars on the galactic plane to the galactic center are plotted in Fig. 5b while the projection of these stars on the galactic plane is shown in Fig. 5c. It is indicated from Fig. 5 that the majority of type E sample stars are nearby sources while the other types distribute over a larger area. There are three galactic arms near the sun: the one at several dozen parsecs outside the solar circle is the Orion arm; the one at about 2 kpc outside the solar circle is the Perseus arm and another at about 2 kpc inside the solar circle is the Sagittarius arm. From Fig. 5c, it is reasonable to suppose that many type A sample stars are located in the three galactic arms. Those stars whose distance to the galactic center is smaller than about 5kpc must be located inside the dense galactic HI cloud disk. And those type E stars are located either in the inter-arms area on the galactic plane like the sun or outside of the galactic plane. From the space distribution of the sample stars, it is not difficult to conclude that, in the whole sample, the type E and other type stars are probably formed in different interstellar environment, hence their chemical composition and evolution process can be different. This probably is the original cause of the discrepancy between the and relations of the type E and A stars. It should be noted that the distance of many stars are not very accurate, so Fig. 5b,c are only valuable for reference.
The conclusions above are mainly based on the quantities derived by modeling. But there exist many uncertainties in the modeling method. The observed data are not very certain because of the variation of light, interstellar extinction and emission. The distances to many OH/IR stars are not very accurate. There are also many uncertainties in the existing radiative transfer modeling. For example, the uncertain dust optical properties, the unknown dust grain physical status and density distribution, etc. The spectrum of the center star should be calculated in more detail by stellar photosphere models instead of using a blackbody spectrum. And many other physical processes such as the dust formation process, the dust-gas interaction process etc. need to be included in the model.
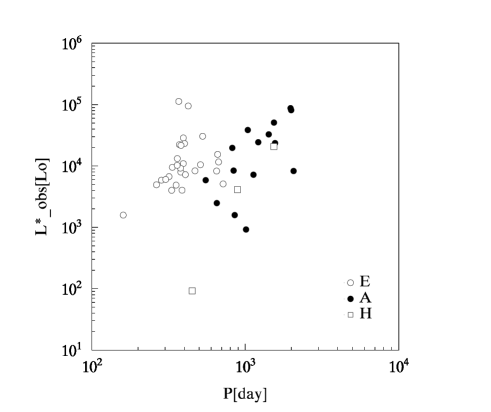
Because of these drawbacks of the modeling method, it is reasonable to question on the reliability of the derived data such as luminosity and mass loss rate. In order to clarify the doubts about the derived data, we also calculated the luminosity by directly integrating the observed SEDs. When the spectrum is integrated, it is represented by the blackbody spectrum of temperature of K (peak at about ) in the wavelength range shorter than the first NIR observed data point and longer than . The resulted relations are shown in Fig. 6 for the phase-lag sample and in Fig. 7 for the whole sample. In these two figures, the conclusion is basically the same. This ensures in some degree the reliability of the data derived by modeling and the conclusions derived from them.
Another problem should also be noted: some of the sample stars, even some type E ones, have their luminosity very large (about ); this is unusual for OH/IR stars. In order to verify whether any calculation errors have occurred, the luminosity data of some sample stars are compared with that from van Langevelde et al. (1990) who had estimated luminosity for some OH/IR stars with phase-lag distances in another way. The luminosity data derived in this paper are found to be comparable with theirs. And there are also some stars in their paper reach a high luminosity near to . It is reasonable to suspect that these luminous stars may actually be supergiants. But further inspection is needed for this subject.
Acknowledgements.
We thank Prof. R. Szczerba who has kindly provided us the radiative transfer code. We also have used in our work the online SIMBAD database and the online IRAS Data Analysis Facility at the University of Calgary. This work is supported by grants from National Natural Science Foundation of China and Chinese Academy of Sciences.References
- Baud and Habing (1983) Baud, B., Habing, H. J. 1983, A&A, 127, 73
- Baud et al. (1985) Baud, B., Sargent, A. I., Werner, M. W., Bentley, A. F. 1985, ApJ, 292, 628
- Bowers et al. (1983) Bowers, P. F., Johnston, K. J., Spencer, J. H. 1983, ApJ, 274, 733
- Blommaert et al. (1998) Blommaert, J. A. D. L., van der Veen, W. E. C. J., van Langevelde, H. J., Habing, H. J., Sjouwerman, L. O., 1998, A&A, 329, 991
- Cardelli et al. (1989) Cardelli, J. A., Clayton, G. C., Mathis, J. S. 1989, ApJ, 345, 245
- Chen et al. (2001) Chen, P. S., Szczerba, R., Kwok, S., Volk, K. 2001, A&A, (to be published)
- Drain (1985) Drain, B. T. 1985, ApJS, 57, 587
- Drain and Lee (1984) Drain, B. T., Lee, H. M. 1984, ApJ, 285, 89
- Evans and Bechwith (1984) Evans II, N. J., Beckwith, S. 1977, ApJ, 217, 729
- Fix and Mutel (1984) Fix, J. D., Mutel, R. L. 1984, AJ, 89, 406
- Fouque et al. (1992) Fouque, P., Le Bertre, T., Epchtein, N., Guglielmo, F., Kerschbaum, F. 1992, A&AS, 93, 151
- Garcia-Lario et al. (1997) Garcia-Lario, P., Manchado, A., Pych, W., Pottasch, S. R. 1997, A&AS, 126, 479
- Gehrz et al. (1985) Gehrz, R. D., Hackwell, J. A., Jones, T. W. 1985, ApJ, 290, 296
- Herman et al. (1986) Herman, J., Burger, J. H., Penninx, W. H. 1986, A&A, 167, 247
- Jones et al. (1983) Jones, T. J., Hyland, A. R., Gatley, I. 1983, ApJ, 273, 660
- Kwok et al. (1987) Kwok, S., Hrivnak, B. J., Boreiko, R. T. 1987, ApJ, 321, 975
- Le Bertre (1993) Le Bertre, T. 1993, A&AS, 97, 729
- Lepine et al. (1995) Lepine J. R. D., Ortiz, R., Epchtein, N. 1995, A&A, 299, 453
- Le Sidaner and Le Bertre (1996) Le Sidaner, P., Le Bertre, T. 1996, A&A, 314, 896
- Mathis et al. (1977) Mathis, J. S., Rumpl, w., Nordsieck, K. H. 1977, ApJ, 217, 425
- Nguyen-Q-Rie et al. (1979) Nguyen-Q-Rieu, Mr., Laury-Micoulaut, C., Winnberg, A., Schultz, G. V. 1979, A&A, 75, 351
- Nyman et al. (1993) Nyman, L.-A., Hall, P. J., Le Bertre, T. 1993, A&A, 280, 551
- Ortiz and Maciel (1996) Ortiz, R., Maciel, W. J. 1996, A&A, 313, 180
- Schultz et al. (1976) Schultz, G. V., Kreysa, E., Sherwood, W. A. 1976, A&A, 50, 171
- Szczerba et al. (1997) Szczerba, R., Omont, A., Volk, K., Cox, P., Kwok, S. 1997, A&A, 317, 859
- Sun and Zhang (1998) Sun J., Zhang H. Y. 1998, ChA&A,22, 442
- van Herk (1965) van Herk, G. 1965, Bull. Astron. Inst. Neth. 18, 71
- van Langevelde et al. (1990) van Langevelde, H. J., van der Heiden, R., van Schooneveld, C. 1990, A&A, 239, 193
- Whitelock et al. (1991) Whitelock, P., Feast, M., Catchpole, R., 1991, MNRAS,248, 276
- Whitelock et al. (1994) Whitelock, P., Menzies, J., Feast, M., Marang, F., Carter, B., Roberts, G., Catchpole, R., Chapman, J. 1994, MNRAS,267, 711
- Xiong et al. (1994) Xiong, G. Z., Chen, P. S., Gao, H. 1994, A&AS, 108, 1
| IRAS_name | NIR | dist. | IRAS_name | NIR | dist. | IRASname | NIR | dist. |
|---|---|---|---|---|---|---|---|---|
| 01037+1219 | 21 | 15 | 142976010 | 15 | 13 | 234121533 | 5 | 13 |
| 01304+6211 | 21 | 15 | 15193+3132 | 22 | 14 | 23425+4338 | 22 | 16 |
| 03293+6010 | 18 | 3 | 164744418 | 15 | 13 | 15255+1944 | 21 | 1 |
| 033367636 | 5 | 16 | 164944327 | 15 | 13 | 181821504 | 7 | 9 |
| 03507+1115 | 5 | 9 | 170734225 | 15 | 13 | 182571000 | 2,4,7 | 19 |
| 041408158 | 5 | 16 | 170733955 | 15 | 13 | 182571052 | 2,11,17 | 19 |
| 050986422 | 5 | 16 | 172713425 | 15 | 13 | 182761431 | 15 | 9,1 |
| 05528+2010 | 21 | 1 | 173173331 | 15 | 13 | 183480526 | 21 | 19 |
| 06500+0829 | 12 | 16 | 173603012 | 15 | 13 | 184310403 | 8,15 | 19 |
| 072092540 | 5 | 13 | 175401919 | 12 | 14 | 184320149 | 8,15,17 | 9 |
| 075851242 | 5 | 16 | 181351456 | 15 | 9 | 184450238 | 4,11,15 | 9 |
| 09425+3444 | 22 | 16 | 184370643 | 15 | 9 | 184600254 | 2,4,11,15 | 9 |
| 094292148 | 5 | 3 | 19017+0608 | 2,18 | 3 | 184880107 | 2,8,10,11 | 19 |
| 101893432 | 5 | 16 | 190592219 | 5 | 13 | 184980017 | 4,11,12,17 | 19 |
| 102875733 | 15 | 13 | 20000+4954 | 18 | 9 | 18549+0208 | 8 | 19 |
| 105801803 | 5 | 16 | 200770625 | 5 | 13 | 18560+0638 | 21 | 19 |
| 123106233 | 15 | 13 | 202594035 | 20 | 14 | 19039+0809 | 21 | 9 |
| 131576421 | 15 | 13 | 212064054 | 20 | 14 | 19192+0922 | 6 | 19 |
| 140862839 | 5 | 14 | 22516+0838 | 5 | 13 | 195500201 | 5 | 1 |
| 14247+0454 | 5 | 9 | 23041+1016 | 5 | 14 | 22177+5936 | 21 | 9 |
-
Reference list: (1) Baud and Habing (1983); (2) Baud et al. (1985); (3) Bowers et al. (1983); (4) Evans and Bechwith (1984); (5) Fouque et al. (1992); (6) Fix and Mutel (1984); (7) Garcia-Lario et al. (1997); (8) Gehrz et al. (1985); (9) Herman et al. (1986); (10) Kwok et al. (1987); (11) Jones et al. (1983); (12) Lepine et al. (1995); (13) Le Sidaner and Le Bertre (1996); (14) Nguyen-Q-Rie et al. (1979); (15) Nyman et al. (1993); (16) Ortiz and Maciel (1996); (17) Schultz et al. (1976); (18) Sun and Zhang (1998); (19) van Langevelde et al. (1990); (20) Whitelock et al. (1994); (21) Xiong et al. (1994); (22) query from SIMBAD database
| IRAS_name | period | D | LRS type | |||
|---|---|---|---|---|---|---|
| [day] | [kpc] | [] | [/yr] | |||
| 01037+1219…… | 660.0 | 18.2 | 0.74 | 24.56 | 0.96 | E |
| 05528+2010…… | 368.3 | 2.7 | 1.20 | 76.86 | 0.11 | E |
| 15255+1944…… | 425.1 | 7.5 | 3.10 | 105.71 | 0.58 | E |
| 19039+0809…… | 284.2 | 6.6 | 0.29 | 3.46 | 0.02 | E |
| 184310403…… | 717.0 | 17.5 | 1.45 | 8.36 | 0.24 | E |
| 195500201…… | 394.8 | 5.4 | 0.85 | 27.20 | 0.06 | E |
| 01304+6211…… | 1995.0 | 11.0 | 2.90 | 50.91 | 6.86 | A |
| 183480526…… | 1566.0 | 14.0 | 1.44 | 18.09 | 4.50 | A |
| 18560+0638…… | 1424.0 | 16.1 | 2.04 | 22.31 | 4.93 | A |
| 22177+5936…… | 1215.0 | 14.5 | 2.38 | 14.54 | 5.58 | A |
| 181821504…… | 1011.7 | 20.5 | 0.55 | 0.84 | 0.78 | A |
| 182571052…… | 1129.5 | 18.2 | 5.06 | 13.09 | 2.04 | A |
| 182571000…… | 1975.2 | 19.0 | 8.51 | 83.31 | 18.99 | A |
| 182761431…… | 890.0 | 12.0 | 2.08 | 3.09 | 0.60 | H |
| 184320149…… | 1038.6 | 17.5 | 7.70 | 40.99 | 8.26 | A |
| 184450238…… | 853.0 | 17.0 | 1.09 | 1.46 | 0.58 | A |
| 184600254…… | 2064.4 | 19.5 | 1.77 | 9.67 | 3.59 | A |
| 184880107…… | 1540.2 | 20.6 | 11.87 | 81.31 | 16.32 | A |
| 184980017…… | 1536.3 | 15.9 | 5.02 | 22.58 | 1.58 | H |
| 18549+0208…… | 840.0 | 13.6 | 4.21 | 6.30 | 0.91 | A |
| 19192+0922…… | 552.0 | 16.1 | 1.13 | 13.82 | 0.52 | A |