A HST study of the stellar populations in the cometary dwarf irregular galaxy NGC 2366111Based on observations obtained with the NASA/ESA Hubble Space Telescope through the Space Telescope Science Institute, which is operated by AURA,Inc. under NASA contract NAS5-26555.
Abstract
We present and photometry of the resolved stars in the cometary dwarf irregular galaxy NGC 2366, using Wide Field Planetary Camera 2 images obtained with the Hubble Space Telescope. The resulting color-magnitude diagram reaches down to 26.0 mag. It reveals not only a young population of blue main-sequence stars (age 30 Myr) but also an intermediate-age population of blue and red supergiants (20 Myr age 100 Myr), and an older evolved populations of asymptotic giant branch (AGB) stars (age 100 Myr) and red giant branch (RGB) stars (age 1 Gyr). The measured magnitude = 23.65 0.10 mag of the RGB tip results in a distance modulus = 27.67 0.10, which corresponds to a distance of 3.42 0.15 Mpc, in agreement with previous distance determinations. The youngest stars are associated with the bright complex of H ii regions NGC 2363 Mrk 71 in the southwest extremity of the galaxy. As a consequence of the diffusion and relaxation processes of stellar ensembles, the older the stellar population is, the smoother and more extended is its spatial distribution. An underlying population of older stars is found throughout the body of NGC 2366. The most notable feature of this older population is the presence of numerous relatively bright AGB stars. The number ratio of AGB to RGB stars and the average absolute brightness of AGB stars in NGC 2366 are appreciably higher than in the BCD VII Zw 403, indicating a younger age of the AGB stars in NGC 2366. In addition to the present burst of age 100 Myr, there has been strong star formation activity in the past of NGC 2366, from 100 Myr to 3 Gyr ago.
1 Introduction
In the hierarchical model of galaxy formation, large galaxies result from the merging of smaller structures. These building-block dwarf galaxies are too faint and too small to be studied directly at large redshifts. However, we stand a much better chance of understanding these with local examples. The dwarf irregular galaxy NGC 2366 is suitable for carrying out a detailed study with the Hubble Space Telescope (HST). A member of the M81 group of galaxies (Karachentseva et al., 1985), it is at a distance of 3.44 Mpc, as determined by Cepheid variables (Tolstoy et al., 1995). Using the brightest stars as distance indicators, Tikhonov et al. (1991) also find a distance of 3.4 Mpc222At this distance, 1″ corresponds to a linear size of 16 pc.. Thus, NGC 2366 is close enough for the galaxy to be resolved into stars by HST and color-magnitude diagrams (CMDs) of its stellar populations can be constructed to determine its star formation history. NGC 2366 is the prototype of the interesting class of “cometary” galaxies described by Loose & Thuan (1986). It is characterized by an elongated body – the tail of the “comet” – and a bright starburst region at its southwest end – the head of the “comet”.
The complex of bright high-excitation H ii regions in the southwest part of NGC 2366 is called NGC 2363 Mrk 71. Several abundance measurements have been made for NGC 2363 (Peimbert et al., 1986; Masegosa et al., 1991; González-Delgado et al., 1994; Izotov et al., 1997; Noeske et al., 2000). They yield an oxygen abundance 12 + log O/H 7.9, or 1/10 solar. Modeling of the physical conditions in NGC 2363, based on observations from the literature, has been carried out by Luridiana et al. (1999). Using Fabry-Perot and optical spectroscopic observations, Roy et al. (1991, 1992) have discovered an expanding supernova bubble in NGC 2363. Besides NGC 2363, there are other H ii regions in NGC 2366. Roy et al. (1996) have derived the abundances for several of these H ii regions. They find their oxygen abundances 12 + log O/H to be in the range 8.1 – 8.3, slightly higher than that of Mrk 71.
Several observations of NGC 2366 have been made in the 21 cm line (Huchtmeier et al., 1981; Thuan & Martin, 1981; Wevers et al., 1986; Hunter et al., 2001; Thuan et al., 2004). All these determinations give similar neutral hydrogen gas masses, (H i) = 8.0 108 333Hunter et al. (2001) by misreading a decimal point mistakenly noted that the value of Thuan & Martin (1981) was 10 times higher than theirs. In fact, the two values are in good agreement., so that the ratio of integrated H i content to blue luminosity (H i)/ is 1.36 /. A striking feature of the H i intensity map of NGC 2366 is the presence of two parallel ridges about 6′ (5.8 kpc) long running along the major axis of the optical body and separated by a zone nearly devoid of H i. Hunter et al. (2001) and Thuan et al. (2004) have interpreted those structures to be a H i ring inclined with respect to the line of sight by an angle of 60°. The H i ring is surrounded by diffuse neutral gas emission, forming an extended envelope around the optical body.
Drissen et al. (2000) have used HST and ground-based observations to obtain CMDs of NGC 2363 and discuss its star formation history and that of neighboring star clusters. However, their analysis was mostly restricted to young stellar populations. Of note is the discovery of a rare luminous blue variable (LBV) star in NGC 2366 by Drissen et al. (1997), 5″ east of NGC 2363, and presently the brightest optical source in the galaxy. The LBV star has been erupting since 1994. Drissen et al. (2001) have monitored the photometric and spectroscopic time variations of the LBV star with the HST and have constructed a physical model for it.
The general properties and evolutionary status of NGC 2366 have been discussed by Noeske et al. (2000). They have used photometric and spectroscopic ground-based observations to put constraints on the age of the older stellar populations in NGC 2366. Noeske et al. (2000) concluded that the light of NGC 2366 is dominated by stellar populations with age not exceeding 3 Gyr, significantly lower than the typical age of 5 Gyr derived for the underlying stellar component of other dwarf galaxies.
However their conclusions are based on population synthesis of spectroscopic observations, the HST observations of Drissen et al. (2000, 2001) not being deep enough for studying old stellar populations. To remedy the situation, we have obtained deep HST Wide Field and Planetary Camera 2 (WFPC2) and images of NGC 2366. We use these data to look anew at both young and old stellar populations of the cometary dwarf galaxy and discuss its evolutionary status. We describe the observations in Sect. 2. The distance to NGC 2366 is derived in Sect. 3. The stellar populations and star formation history of NGC 2366 are discussed in Sect. 4. We summarize our findings in Sect. 5.
2 Observations
2.1 Data reduction
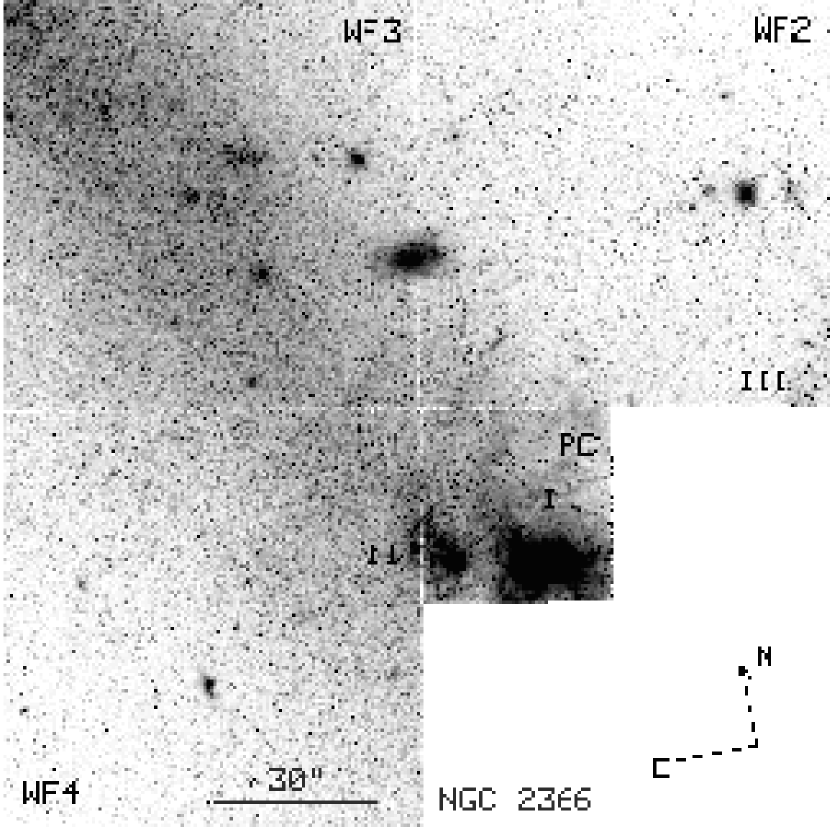
We have obtained HST images of NGC 2366 on 2000 December 12 during cycle 9 with the WFPC2 through filters F555W and F814W, which we will refer to hereafter as and . The observations were broken into five subexposures in the filter and into three subexposures in the filter to permit identification and removal of cosmic rays. The total exposure time was 6700s in and 4100s in . The galaxy was positioned so that the brightest H ii region NGC 2363 is located in the PC frame, to take advantage from its twice as good spatial resolution. The WFPC2 was oriented in order the major axis of the galaxy lies along the diagonals of the PC and WF3 frames. The scale of the WFPC2 is 0046 per pixel in the PC frame and 0102 per pixel in the WF frames. Because the considerable major axis of NGC 2366 ( 300″) is larger than the combined diagonal lengths of the PC and WF3 frames ( 160″), the northermost parts of the galaxy could not be imaged.
Preliminary processing of the raw images including corrections for flat-fielding was done at the Space Telescope Science Institute through the standard pipeline. Subsequent reductions were carried out at the Main Astronomical Observatory of the Ukrainian Academy of Sciences and the University of Virginia using IRAF444IRAF is the Image Reduction and Analysis Facility distributed by the National Optical Astronomy Observatory, which is operated by the Association of Universities for Research in Astronomy (AURA) under cooperative agreement with the National Science Foundation (NSF). and STSDAS555STSDAS: the Space Telescope Science Data Analysis System.. Cosmic rays were removed and the images in each filter were combined using the CRREJ routine. We found that all subexposures in a given filter coregistered to better than 0.2 pixels.
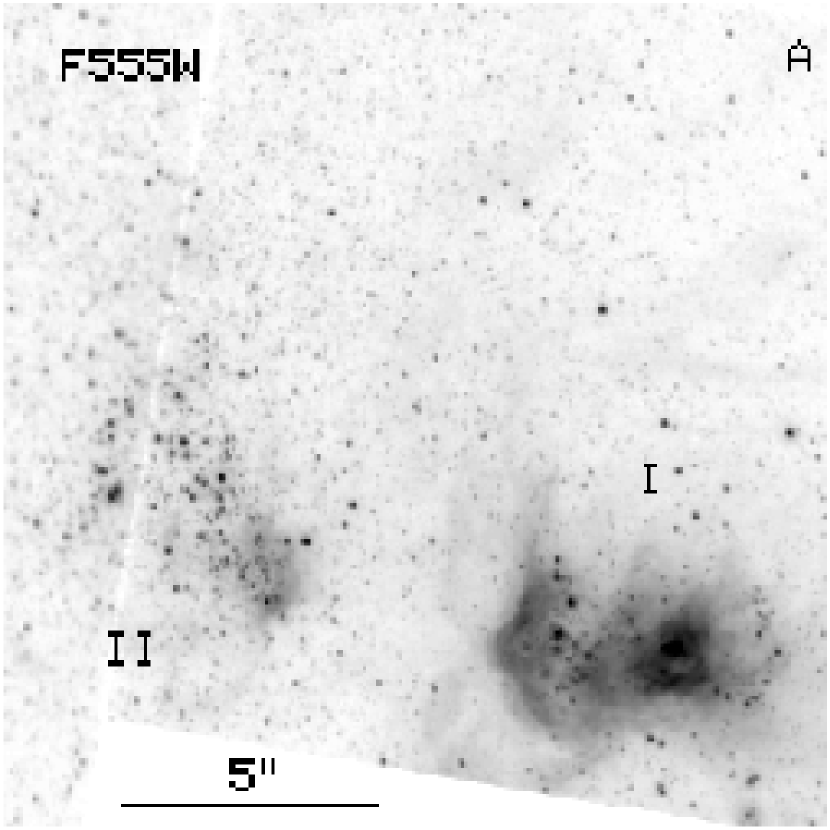
Fig. 1 shows the mosaic image of NGC 2366. We shall follow the notation of Drissen et al. (2000) in labeling the three main H ii regions. The two brightest ones, I and II, are on the PC chip, while we see a small part of III in the bottom right corner of the WF2 frame. The extended low-surface-brightness body of the galaxy is visible in all WF and PC frames. Several background galaxies can be seen in the field of NGC 2366, the brightest of them being the spiral galaxy to the north of region II.
2.2 Construction of color-magnitude diagrams
The superior spatial resolution of the HST/WFPC2 images combined with the proximity of NGC 2366 permits to resolve the galaxy into individual stars and study its stellar populations by means of CMDs. We used the DAOPHOT package in IRAF for point-spread-function (PSF)-fitting photometry. The PSFs are derived separately for each of the PC and WF fields and in each filter using the brightest isolated stars in each image. The background level in the PC field was measured in an annulus with radii 4 and 6 pixels (018 and 028) around each source and subtracted. The sky level in the WF fields was measured in an annulus with radii 3 and 5 pixels (030 and 051). The PSF-fitting stellar photometry was done by adopting the zero points of Holtzman et al. (1995b) and a 2-pixel fitting radius for the PC frames and a 1.5-pixel fitting radius for the WF frames. The detectability limit is set to the 3 threshold above the local background noise. To convert instrumental magnitudes with an aperture radius of 2 or 1.5 pixels to the magnitudes corresponding to the Holtzman et al. (1995a) calibrating aperture radius of 05 (respectively 11 and 5 pixels for the PC and WF frames), we need to derive aperture corrections. For this, we compared PSF-fitted magnitudes of bright isolated stars with the magnitudes of the same stars measured with the aperture photometry technique within an 05 aperture. For the PC frames we obtained the corrections (05) – = –0.63 mag and (05) – = –0.77 mag. For the WF frames the corresponding corrections are –0.39 mag in both and . Our derived corrections are very similar to those obtained by Holtzman et al. (1995a).
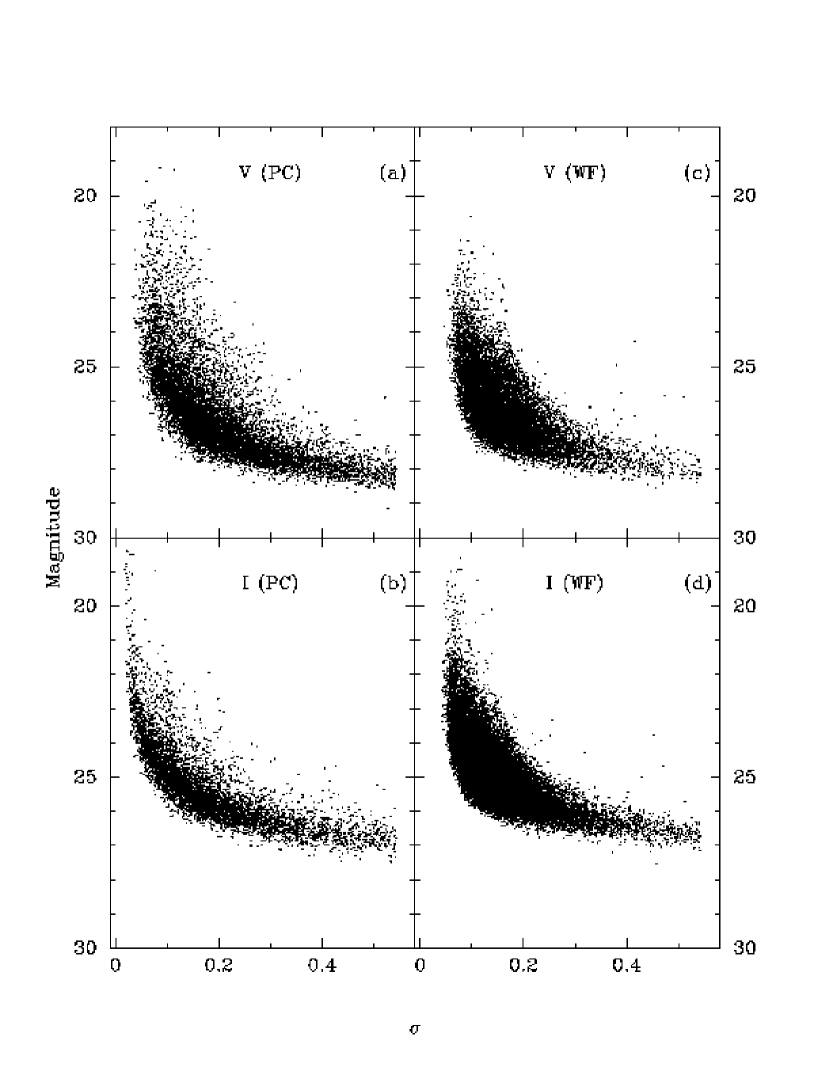
Stars with a sharpness out of the –1.0 – +1.0 range in both PC and WF frames were eliminated to minimize the number of false detections. Correction for charge-transfer efficiency loss has been done according to the prescriptions of Dolphin (2002). Figure 2 shows the distribution of photometric errors as a function of and magnitudes as determined by DAOPHOT. It is seen that errors are about 0.2 mag at = 27 mag and = 26 mag for both PC and WF frames. They increase to about 0.4 mag at = 28 mag and = 27 mag.
The total numbers of recovered stars in both PC and WF frames are respectively 51632, 33564 and 22121 in the band, the band and in both bands, adopting a matching radius of 1 pixel. The corresponding numbers of recovered stars in the PC frame only are 9888, 5918 and 3415. That more than a third of the stars are not matched is due to the combination of incompleteness effects and an increasing number of false detections at faint magnitudes. The transformation of instrumental magnitudes to the Johnson-Cousins photometric system as defined by Landolt (1992) was performed according to the prescriptions of Holtzman et al. (1995b). The magnitudes and colors of point sources were corrected for Galactic interstellar extinction adopting = 0.12 mag and = 0.07 mag (Schlegel et al., 1998).
We have carried out a completeness analysis for each of the frames using the DAOPHOT routine ADDSTAR. For each magnitude bin listed in Table 1, we have added artificial stars amounting to 5% of the total number of real stars detected in each frame. We then performed a new photometric reduction using the same procedure as the one applied to the original frame, and checked how many added stars were recovered in this magnitude bin. This operation was repeated 10 times for each frame and for each magnitude bin and the results were averaged. The completeness factor in each magnitude bin defined as the percentage of recovered artificial stars is shown in Table 1. The completeness limit of the PC image is acceptable in the 25 – 26 mag range, 73% and 66% respectively in and , but drops to 30% and 2% in the 27 – 28 mag range. The completeness limits of the WF2 and WF4 images are comparable to that of the PC image. However, because of the larger crowding, the completeness limits of the WF3 image are worse, being 50% in and 30% in in the 25 – 26 mag range.
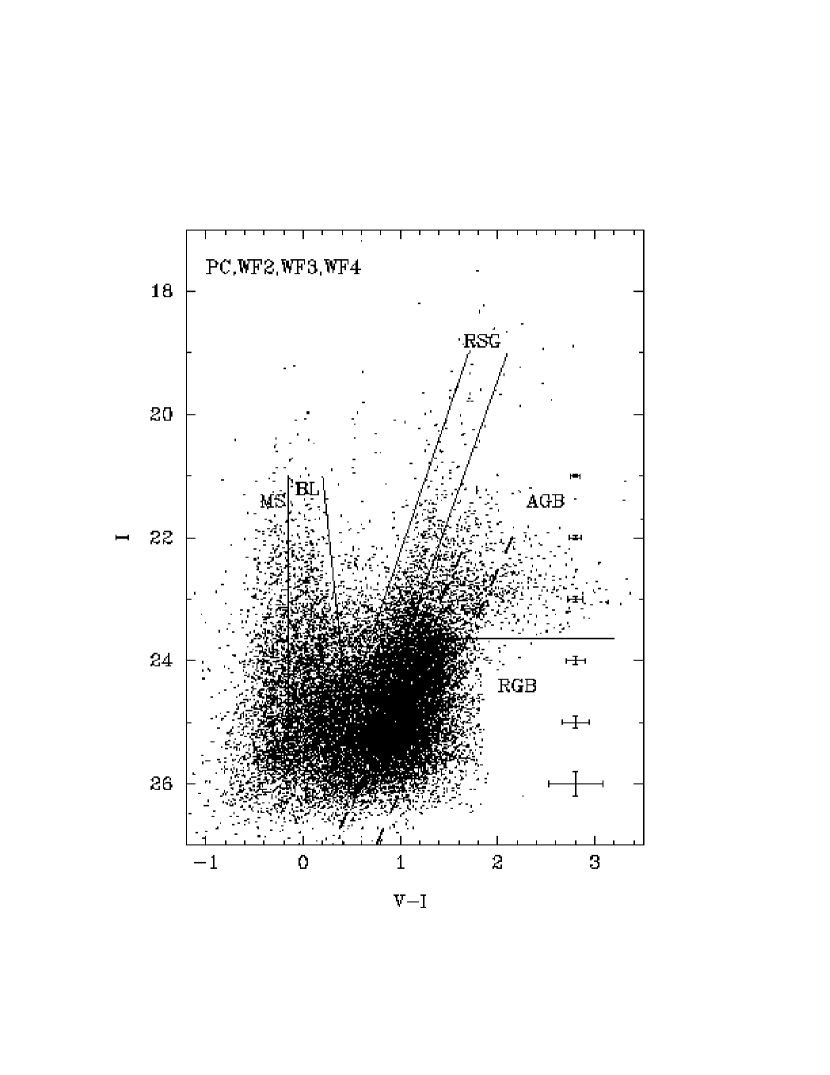
Fig. 3 shows the vs CMD of NGC 2366 derived from all frames. It can be seen that NGC 2366 contains diverse stellar populations in a variety of evolutionary stages: main-sequence (MS), blue loop (BL), red supergiant (RSG), asymptotic giant branch (AGB), and red giant branch (RGB) stars.
3 Distance determination
The detection of RGB stars allows to derive the distance to NGC 2366 using the observed magnitude of the tip of RGB stars (TRGB). This technique is based on the observed constancy of the absolute magnitude –4.05 mag of TRGB stars in old globular stellar clusters (Da Costa & Armandroff, 1990). In the CMD, the TRGB is signaled by a sharp drop in the number of RGB stars toward brighter magnitudes. This drop can be seen distinctly in the CMD of Fig. 3. To quantify the drop, we have plotted the number distribution of the RGB stars in steps of 0.1 mag in Fig. 4 (solid line). We have considered those RGB stars located in the CMD (Fig. 3) to the blue of the straight line defined by the pair of points (,) = [(27,0.75);(22,2.15)] (right dashed line) to minimize the contribution of the AGB stars, and to the red of the straight line defined by (,) = [(27,0.3);(22,1.7)] (left dashed line) to minimize the contribution of the more massive red helium burning stars. The dotted line in Fig. 4 shows the derivative of the distribution. The location of the TRGB is determined by the first large increase in both the RGB luminosity function and its derivative and is marked by a vertical tick mark in Fig. 4. We obtain (TRGB) = 23.65 0.10 mag.
The distance modulus is derived from the equation = (TRGB) – (TRGB). The absolute magnitude is defined as (TRGB) = (TRGB) – (), where (TRGB) is the bolometric magnitude of the TRGB and () is the bolometric correction to the magnitude. The latter quantity is given as a function of the color of the TRGB by () = 0.881 – 0.243, while the bolometric magnitude depends on metallicity and is given by (TRGB) = –0.19[Fe/H] – 3.81 (Da Costa & Armandroff, 1990; Lee et al., 1993). Hence for distance determination, knowledge of the stellar metallicity is necessary. Usually [Fe/H] is derived using the color of RGB stars at the absolute magnitude = –3. As pointed out by Lee et al. (1993) from analysis of Yale theoretical isochrones, this is because is mainly dependent on metallicity and not very much on age.
In Fig. 5a we show the RGB region of the CMD as obtained from all frames, adopting a distance modulus = 27.67 mag (to be discussed in the next paragraph). We show by solid lines and from left to right the isochrones for the Galactic globular clusters M15, NGC 6397, M2, NGC 6752, NGC 1851 and 47 Tuc with respective metallicities [Fe/H] = –2.17, –1.91, –1.58, –1.54, –1.29 and –0.71 (Da Costa & Armandroff 1990). Figs. 5b and 5c will be discussed in Section 4.4. It can be seen from Fig. 5a that the clump of red stars in the NGC 2366 CMD is broad with a significant part located to the blue of the lowest metallicity isochrone, that of the globular cluster M15. We believe that the relatively large width of the red star distribution is real and that it is not due to uncertainties in the photometry, as these are small (Fig. 2). The broad distribution implies that star formation in NGC 2366 has occurred for a relatively long period. The clump consists of a mixture of red helium burning stars and RGB stars of different ages.
We set the color of the TRGB to be equal to the color of the reddest RGB stars, ()TRGB 1.5. These stars are presumably the oldest ones in NGC 2363 and hence they are the most appropriate for comparison with globular cluster isochrones. These reddest stars are fitted reasonably well by the isochrone of the globular cluster M2 with [Fe/H] = –1.58. For this metallicity, (TRGB) = –4.02 mag. The resulting distance modulus of NGC 2366 is then = 27.67 0.10. The corresponding distance to the galaxy is = 3.42 0.15 Mpc, in excellent agreement with the values = 3.4 Mpc derived by Tikhonov et al. (1991) from the brightest stars and = 3.44 Mpc by Tolstoy et al. (1995) from Cepheid variables. It is larger than the value of 2.9 Mpc obtained by Aparicio et al. (1995), also from the brightest stars. Because (TRGB) is only slightly dependent on the color, uncertainties in (TRGB) have little influence on the derived distance.
The above distance determination is based on the assumption that the reddest RGB stars in NGC 2366 have the age of globular cluster stars, i.e. are 10 Gyr old. For younger ages of the RGB stars, theoretical isochrones, e.g. those of the Padua group (Bertelli et al., 1994; Girardi et al., 1996, 2000) or the Geneva group (Lejeune & Schaerer, 2001), may be more appropriate. These are most often used for the analysis of resolved stellar populations in Local Group and relatively nearby galaxies. However, as discussed by several authors (e.g., Da Costa & Armandroff, 1990; Lynds et al., 1998; Izotov & Thuan, 2002), these theoretical isochrones do have problems: they do not fit those observed for globular clusters. In particular, Izotov & Thuan (2002) have shown that, except for the isochrones with = 0.001 from Bertelli et al. (1994), all 10 Gyr Padua isochrones do not reproduce the observed ones for globular clusters, being too blue and not extending to bright enough absolute magnitudes. Furthermore, the isochrones that do fit were obtained from stellar evolutionary models calculated with older opacities. Isochrones obtained from models with new opacities for the same metallicity are again too blue (Girardi et al., 2000). As for the theoretical 10 Gyr isochrones based on the Geneva stellar evolutionary models, they are too red compared to those observed for globular clusters. However, despite all these uncertainties, Padua models (Bertelli et al., 1994) can provide a good guide to the dependence of (TRGB) on the age of the RGB stars, since in this case we are considering relative rather than absolute values. These models predict that (TRGB) is nearly constant for RGB stars with ages 3 Gyr. This implies that the distance of 3.42 Mpc derived above for NGC 2366 is valid as long as its oldest RGB stars are 3 Gyr or older, which is likely the case for NGC 2366 (see section 4.4).
4 Stellar populations
Several generations of stellar populations are evidently present in the CMD of NGC 2366 (Fig. 3), suggesting that star formation in this galaxy has occurred during the past several Gyr. Ongoing star formation is evidenced by the presence of the supergiant H ii regions I and II at the southwestern edge of the galaxy. Past star formation is inferred from the presence of MS stars with ages of only a few Myr, of BL and RSG stars with ages ranging from 20 Myr to 100 Myr, of AGB stars with ages 100 Myr and of RGB stars with ages 1 Gyr.
The spatial distribution of these different stellar populations, as delimited in Fig. 3, is shown in Fig. 6. To minimize incompleteness effects (Table 1) and photometric errors (Fig. 2) which become important for 25 mag, we will consider in Fig. 6 and in all the following discussions on star counts only sources that are brighter than = 25 mag. It can be seen that a large number of the MS stars (Fig. 6a) are located in the H ii regions I, II, and III as well as in those in the northeast part of the elongated main body. They show a clumpy distribution, reflecting the compactness of the H ii regions. But there are also some MS stars that are more evenly distributed over the whole body of the galaxy, out to the edges of the WFPC2 frames. BL and RSG stars are distributed more smoothly than MS stars (Fig. 6b), however their surface density is larger in the high-surface-brightness part of the main body. As for the AGB and RGB stars, they show a smooth distribution over the whole WFPC2 field of view (Fig. 6c – 6d). There is a clear correlation of the spatial extent of a stellar population with its age: the older the stellar population, the smoother and more extended is its spatial distribution. Such population gradients have been known for a long time, starting with the pioneering studies of the Milky Way by Walter Baade in the 1950’s. They have also been observed in other dwarf galaxies resolved by HST (e.g., Lynds et al., 1998; Schulte-Ladbeck et al., 1998; Crone et al., 2000; Izotov & Thuan, 2002). They are likely a consequence of the diffusion and relaxation processes of stellar ensembles. We discuss next selected regions of NGC 2366 in more detail.
4.1 Regions I and II
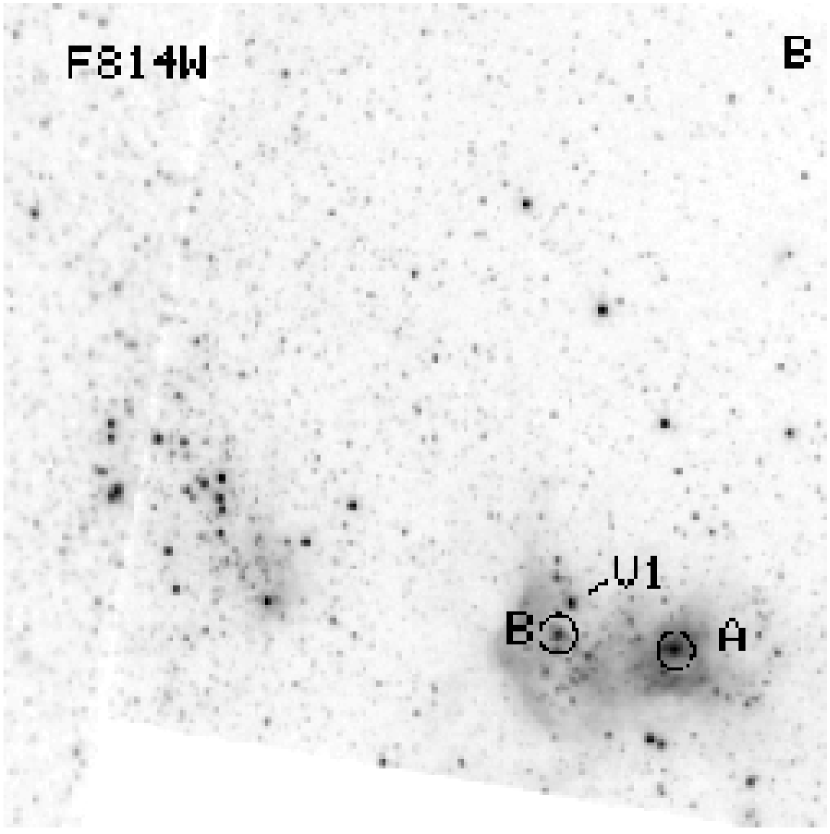
Most of the regions I ( NGC 2363 Mrk 71) and II have been imaged with the PC, although some parts of region II are also in the WF4 frame (Fig. 1). Fig. 7 shows zoomed and views of the two regions. Widespread ionized gas emission resulting mainly from strong [O iii] 5007 line emission, can be seen in the image (Fig. 7a). However, extended ionized gas emission is also present in the image (Fig. 7b), in this case being mainly gaseous continuum emission. Region I contains two young compact clusters which we label A and B following the notation of Drissen et al. (2000). They are marked by circles in Fig. 7b. The LBV star discovered by Drissen et al. (1997) is labeled as V1. Unfortunately, the LBV star is saturated in both our and images and cluster A is saturated in the image, preventing us from performing photometry of these two objects in those bands. Fig 7a shows that the ionization of the gas in region I is mostly caused by cluster A. The ionization of the gas in region II is not as important, suggesting that extremely young massive stars are absent there. Fig. 7b shows also the presence of numerous bright RSG stars in region II.
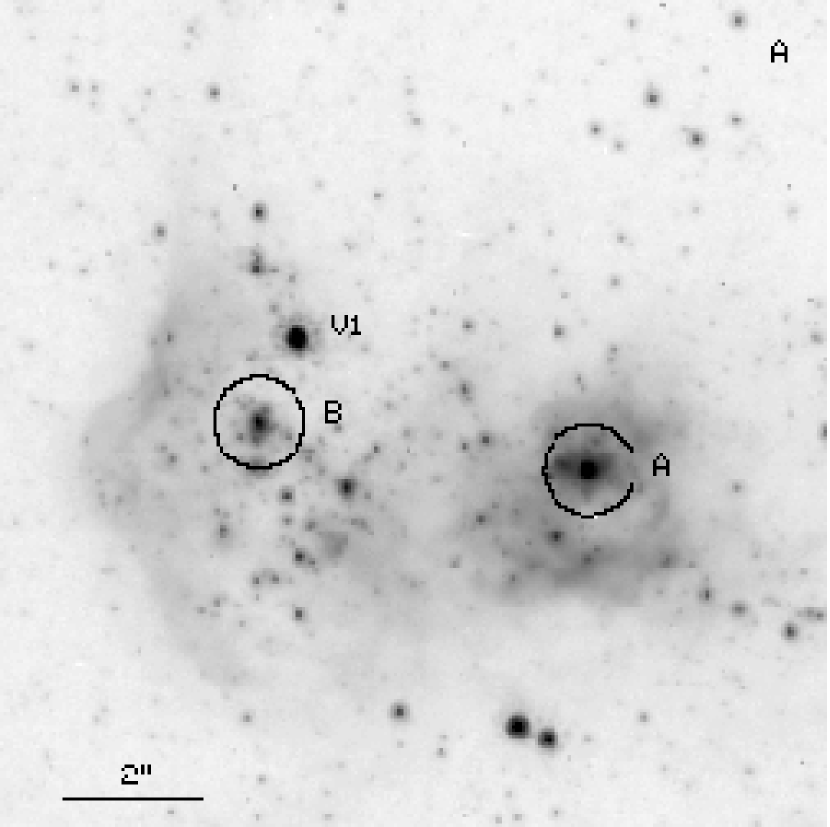
A more detailed view of region I in and is shown in Fig. 8. Although both clusters A and B are very compact (Fig. 8a), they are marginally resolved. The FWHM of circular-shaped cluster A on the image (which is not saturated) is 3.8 pixels or 2.8 pc, similar to the super-star cluster (SSC) R 136a in the Large Magellanic Cloud and to SSCs in other galaxies. The FWHM of elongated-shaped cluster B is larger, being 4.7 pixels or 3.5 pc. Both clusters are blue as evidenced from the image (Fig. 8b) with cluster A being slightly redder because of enhanced dust extinction (Drissen et al., 2000) and saturation of the central pixels of its image. The relatively high internal extinction in cluster A ( 0.3 mag) is confirmed by spectroscopic observations (Masegosa et al., 1991; González-Delgado et al., 1994; Izotov et al., 1997; Hunter & Hoffman, 1999; Noeske et al., 2000). In fact, Fig. 8b shows that extinction is not confined to cluster A. It is also present in the extended red region (white in Figure 8b) to the south of cluster A. The red color of this region is due partly to two bright RSG stars and a few other fainter stars, but also to dust.
We have performed aperture photometry of both clusters using an aperture with a 6-pixel radius. The background was measured within an annulus with radii 6 and 8 pixels and subtracted. Stellar crowding and a highly variable background limit the precision of the photometry. The derived magnitudes are corrected for Galactic extinction using = 0.12 mag (Schlegel et al., 1998) and transformed to the standard system using Holtzman et al. (1995b)’ prescriptions. For cluster A we obtain = 17.97 0.02. As for cluster B, = 18.64 0.02, = 18.92 0.02 and = –0.28 0.03. Since our image of cluster A is saturated, we cannot compare our photometry with that of Drissen et al. (2000). However for cluster B our magnitude is 0.3 mag fainter. To check our photometry, we have retrieved from the HST archives the Drissen et al. (2000) images, and have derived from them = 18.66 0.03 for cluster B, in excellent agreement with the measurements from our image. The difference is probably due to a larger aperture used by Drissen et al. (2000) although they do not precise it in their article. With a distance modulus = 27.67, the absolute magnitudes of clusters A and B are respectively –9.70 mag and –8.75 mag.
Fig. 9 shows the CMDs for regions I and II. These are dominated by young stellar populations. They both contain MS stars with ages 10 Myr. Region I also contains two RSG stars with ages 10 Myr (the two brightest stars with 1.8). Fig. 9 shows also a substantial population of more evolved AGB and RGB stars, with ages ranging from 100 Myr to 1 Gyr.
The remarkable feature of the CMD of region II is the presence of numerous RSG stars. Drissen et al. (2000) first noted the presence of these stars and estimated their age to be 10 Myr. Our comparison with the theoretical isochrones of Bertelli et al. (1994) for the metallicity = 0.001 shows that the ages of the RSG stars range between 10 and 30 Myr, in agreement with Noeske et al. (2000). Thus, although there is presently a strong burst of star formation, many of the stars in regions I and II were born over a long period of star formation which started 1 Gyr ago. To quantify our statements, we have calculated the number ratios of different stellar types with 25 mag. For regions I and II we obtain respectively MS/RGB = 3.34 and 2.02, (BL+RSG)/RGB = 2.16 and 2.17, and AGB/RGB = 0.18 and 0.24. The values of these ratios confirm our statement that young stellar populations are dominant in regions I and II.
4.2 The main body
4.2.1 Color-magnitude diagrams
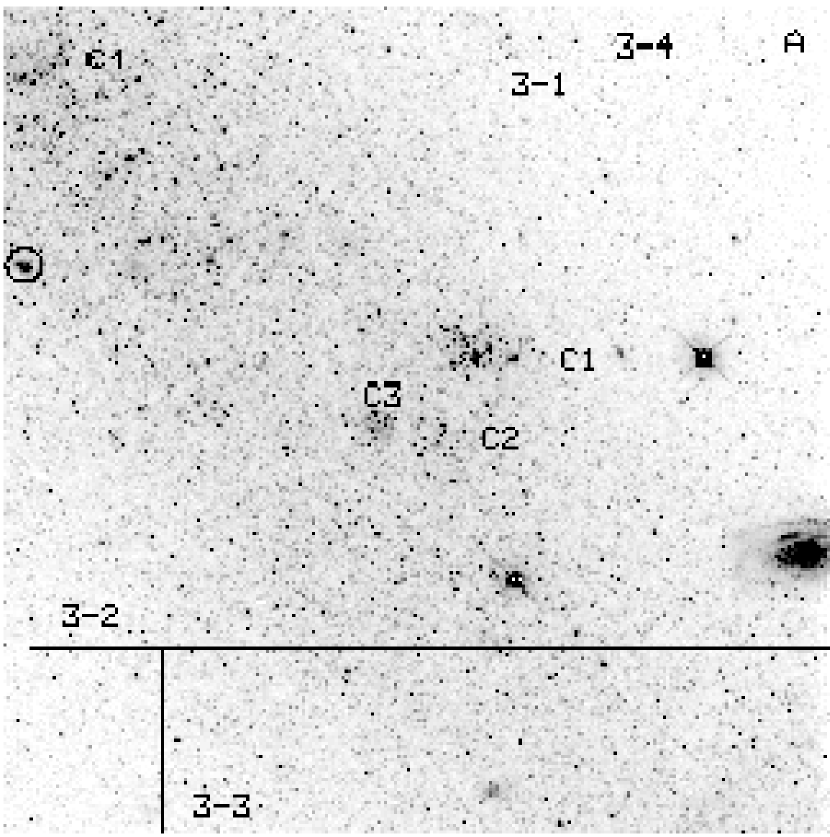
To study variations in the spatial distributions of the stellar populations in the main body located in the WF3 frame, it is convenient to divide it into three regions labeled 3-1 to 3-3, with the latter being closest to regions I and II discussed in the preceding section (Fig. 10a). Region 3-4 which is outside the densest part of the main body is used as comparison. The four most prominent stellar open clusters are labeled C1 to C4 and the circle indicates a compact H ii region. Regions located to the west of the main body in the WF2 frame are shown in Fig. 10b. They will be discussed later.
Region 3-1, which is the furthest away from regions I and II, also contains the largest number of MS stars after those regions, as shown by Fig. 6a. Several H ii regions are present in 3-1 as seen from the H image of Drissen et al. (2000). There is only one high-surface brightness H ii region (open circle), probably ionized by a few O stars. We measure for it = 20.23 0.02 and = 20.75 0.05 in an aperture with a 8-pixel radius. The derived color = –0.52 0.05 mag of the H ii region is bluer than that of the hottest MS stars, because of a significant contribution of [O iii] 5007 emission in the band.
The number of MS stars in regions 3-2 and 3-3 is smaller, judging from Fig. 6a. They are mainly populated by relatively young BL and RSG stars (Fig. 6b). In Fig. 11 we show the CMDs for all regions from 3-1 to 3-4. The main sequence is most populated in region 3-1 (Fig. 11a). Other relatively young stars with ages between 10 Myr and 100 Myr are well represented as well. Older AGB (age 100 Myr) and RGB (age 1 Gyr) stars are also present. The star count ratios for this region are MS/RGB = 0.27, (BL+RSG)/RGB = 1.32 and AGB/RGB = 0.36. It is seen that, while the (BL+RSG)/RGB and AGB/RGB number ratios in region 3-1 are comparable to those in the brightest regions of NGC 2363, regions I and II, the number ratio of MS to RGB stars is about one order of magnitude lower. The MS in region 3-2 is not as populous as in region 3-1 with MS/RGB = 0.19 (Fig. 11b). Only a few post-main-sequence stars with ages 30 Myr are seen. The lack of high-surface brightness H ii regions in region 3-2 suggests that star formation here has stopped more than 10 Myr ago. However, the population of BL+RSG and AGB stars is as numerous here as in region 3-1, with (BL+RSG)/RGB = 1.08 and AGB/RGB = 0.36, suggesting that star formation in region 3-2 was active several hundred Myr ago. Only stars with ages 50 Myr are present in region 3-3 (Fig. 11c). Fewer main-sequence stars are present in this region, giving MS/RGB = 0.08. As in region 3-2, the BL+RSG and AGB stellar populations are numerous, so that (BL+RSG)/RGB = 1.12 and AGB/RGB = 0.22. Lastly, mainly relatively old stars with ages 300 Myr are present in the CMD of region 3-4 (Fig. 11d), resulting in small values of MS/RGB and (BL+RSG)/RGB, 0.03 and 0.50 respectively, and a relatively high value of AGB/RGB equal to 0.24.
Thus it is clear that there is a systematic increase in stellar population age from 3-1 to 3-3, suggesting propagating star formation in the main body from the SW to the NE directions, which originated in 3-3 some 100 Myr ago. Regions I and II to the SW of 3-3 do not belong to this age sequence. This is evidence that new centers of star formation in a cometary-like galaxy like NGC 2366 arise in the body of the galaxy in a stochastic manner. The numerous peaks and minima in the neutral H i distribution of NGC 2366 (e.g. Thuan et al., 2004) are also evidence for this stochastic mode of star formation, the present star-forming centers coinciding with the H i peaks and the H i holes corresponding to cavities carved out in the interstellar medium by past starbursts that have faded away. In Fig. 12 we show the CMDs for the four open stellar clusters labeled in Fig. 10a. The absence of high-surface-brightness ionized gas emission suggests that the age of all four clusters is larger than 10 Myr. Several stars with ages between 20 Myr and 30 Myr are seen in the CMDs of clusters C1, C2 and C3. Cluster C4 appears to be older than 30 Myr.
4.2.2 Surface brightness profiles
Another way to study the properties of stellar populations is to consider integrated characteristics such as surface brightnesses and colors of different regions in the galaxy. The advantage of this approach is that it includes both resolved and unresolved stars. The disadvantage is that populations with different ages contribute to the integrated light and assumptions on the star formation history need to be made to derive the distribution of stellar ages.
In Fig. 13a – 13c we show the and surface-brightness and color distributions along the major axis (i.e. along the diagonals of the PC and WF3 frames) of NGC 2366 in a 2″ wide strip centered on the star cluster A (Fig. 8) taken to be the origin. Fig. 13d – 13f show the and surface-brightness and color distributions in a 10″ wide strip perpendicular to the major axis of NGC 2366, with the origin taken to be at the intersection of the strip with the major axis, at the distance of –45″ as defined in Fig. 13a – 13c. Surface brightnesses and colors are transformed to the standard photometric system following the prescriptions by Holtzman et al. (1995b) and corrected for extinction with = 0.12 mag (Schlegel et al., 1998).
It can be seen that cluster A peaks at a surface brightness () 16.5 mag arcsec-2, or 5.5 mag brighter than the surface brightness in the main body (WF3). This peak surface brightness is a lower limit since a few central pixels in the image of cluster A are saturated. The profile of the H ii region around A is broader in (Fig. 13a) than in (Fig. 13b) because of the larger contribution of the extended ionized gas emission in . Thus, the region with blue color (Fig. 13c) is particularly broad. The bluest color is –1.0 mag.
Fig. 13c shows that there is a slight increase in the color from 0.7 for –140″ –60″ (region 3-1) to 0.9 for –60″ –40″ (region 3-3). We use single stellar population (SSP) models to interpret the colors. A SSP is composed of stars of the same age formed in an instantaneous burst of star formation with masses distributed according to a Salpeter initial mass function. Instantaneous burst models are more appropriate for fitting the integrated colors of the galaxy than continuous star formation models with a constant star formation rate because the star formation rate in different regions of NGC 2366 varied with time. This means that, in a given region, most of the light comes from particular stellar types with particular ages. Thus, in the blue regions with 0.7, the surface density of BL and RSG stars is higher than that of RGB stars (compare Fig. 6b and 6d) and they contribute most of the light. The galaxy brightness distribution (Fig. 1) is similar to the surface density distribution of BL and RSG stars, but not that of the RGB stars. On the other hand, in red regions with 0.9, the opposite situation prevails: the surface density of RGB stars is significantly higher than that of BL and RSG stars and RGB stars contribute most of the light of the galaxy in these red regions. A color of 0.7 is consistent with that predicted for a 3 Gyr single stellar population according to Padua models with = 0.001 (Girardi et al., 2000, http://pleiadi.pd.astro.it), while a color of 0.9 corresponds to a single stellar population of several Gyr. The unknown star formation history for NGC 2366 at large ages ( 5 Gyr) precludes a more precise determination of the galaxy’s age based on integrated colors.
The minor axis brightness profiles (Fig. 13d,e) show that the main body of NGC 2366 has a size of 150″ (2.4 kpc) at a surface brightness level of 25 mag arcsec-2. This is consistent with the surface photometry of Noeske et al. (2000) who found the size of the optical body to be 53 2′ at the surface brightness level of 25 mag arcsec-2. H i interferometric mapping reveals that the optical body of NGC 2366 is embedded within a larger envelope of H i gas of size 136 44 at a H i column density level of 5 1019 cm-2 (Thuan et al., 2004). With an inclination of 60 degrees as derived from fitting the H i rotation curve by a tilted ring model, this corresponds to a H i disk of 13.1 kpc in size (Thuan et al., 2004). As in Fig. 13c, Fig. 13f shows an increase of the color from a value of 0.7 in regions near the major axis to a value of 0.9 in the outer parts of NGC 2366. This increase at large distances is consistent with the more extended spatial distribution of older and hence redder stellar populations discussed in the introduction to Section 4.
We can also compare the observed color of the reddest regions in NGC 2366 with the integrated colors of the globular clusters considered before in the CMD analysis, the isochrones of which are shown in Fig. 5. Again, for these regions which do not contain young stellar populations, instantaneous burst models constitute a reasonable approximation because of the slow variation of the color for ages several Gyr. Also, it is not excluded that stars in the halo of NGC 2366 were formed during a relatively short period. These arguments are supported by the CMD for region 3-4, where mainly old stellar populations are present. Although this region was not used to derive the color spatial distributions in Fig. 13, its global color is also 0.9. From the catalogue of Galactic globular clusters of Harris (1996), the colors corrected for extinction for the clusters M15, NGC 6397, M2, NGC 6752, NGC 1851, 47 Tuc listed in order of increasing metallicity are 0.72, 0.80, 0.84, 0.88, 0.98, 1.09 mag. This comparison shows that while a value of 0.9 mag is still consistent with a 10 Gyr population with metallicity [Fe/H] = –1.58 (M2) and –1.54 (NGC 6752), the colors of the more metal-rich clusters NGC 1851 (–1.29) and 47 Tuc (–0.71) are too red (see also Fig. 5a). Therefore, if the metallicity of stars in NGC 2366 is larger than that of NGC 6752, then their age is less than 10 Gyr. Such a relatively young age appears to be typical for cometary galaxies. Noeske et al. (2000) derived from ground-based spectroscopic and photometric observations for several cometary galaxies, including NGC 2366, an age of 4 Gyr.
4.3 Northwestern and southeastern regions
We discuss now the CMDs of the northwestern regions located in the WF2 frame and of the southeastern regions located in the frame WF4.
In Fig. 10b we show the boundaries of the northwestern region 2-1 which contains part of region III as defined by Drissen et al. (2000) and of the northwestern region 2-2 where an enhanced density of MS stars is seen (Fig. 6a). The extended low-surface-brightness emission around some stars suggests the presence of early B stars. The CMDs of these regions (Fig. 14) confirm this conclusion. Several stars with ages in the range 20 – 30 Myr are present. However, AGB and RGB stellar populations are seen as well, implying that star formation has occurred over the last 1 Gyr in both regions.
In Fig. 15 we compare the CMDs of the disk and halo components of the southeastern region contained in the WF4 frame (Fig. 1). The CMD for the disk component includes sources above the diagonal connecting the upper left and lower right corners of the WF4 frame, while the CMD for the halo component includes sources below that diagonal. Fig. 15b shows that the halo is populated mainly by old stellar populations with a particularly narrow RGB. On the other hand, the disk component (Fig. 15a) is populated by intermediate-age stars in addition to older stars. The fractions of stars of different types which we derived for the disk and halo are respectively MS/RGB = 0.16 and 0.11, (BL+RSG)/RGB = 1.41 and 0.79, and AGB/RGB = 0.28 and 0.23.
4.4 AGB and RGB stars
We now discuss in greater detail the more evolved populations of RGB and AGB stars. To put our results in perspective, we will compare the CMD of NGC 2366 with those of other BCDs.
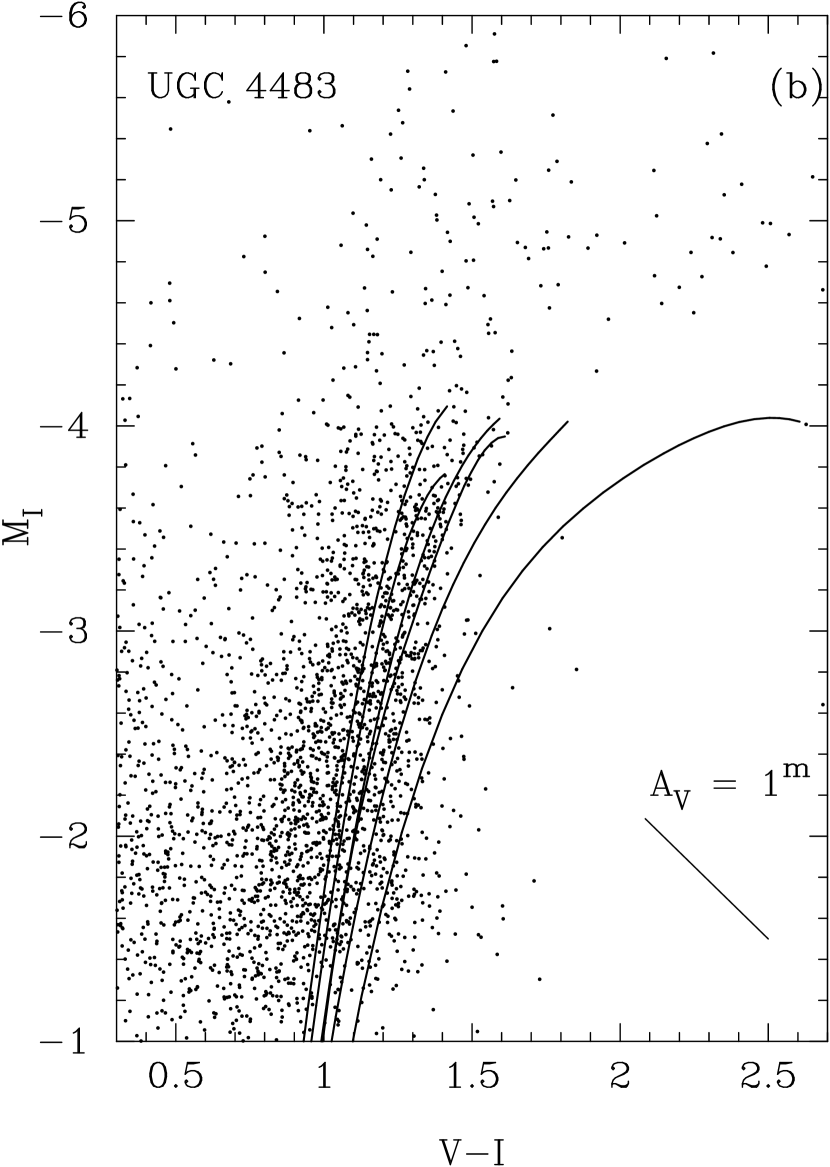
AGB stars which are tracers of intermediate-age populations (e.g., Maraston, 1998) are detected in all parts of NGC 2366 (Fig. 6). There are two striking properties which characterize that AGB stellar population. First, Fig. 5 shows that they are much more numerous in NGC 2366 than in two other BCDs, UGC 4483 with a lower ionized gas metallicity (12 + log O/H = 7.54 or 1/23 solar) and at the same distance of 3.4 Mpc (Izotov & Thuan, 2002), and VII Zw 403 also with a lower ionized gas metallicity (12 + log O/H 7.69 or 1/17 solar) but at a slightly larger distance (4.5 Mpc as determined from the tip of the giant branch, Schulte-Ladbeck et al., 1998; Lynds et al., 1998). While the ratios MS/RGB and (BL+RSG)/RGB which characterize the young stellar populations, vary over a wide range from region to region in NGC 2366, the AGB/RGB ratio varies in the relatively narrow range of 0.18 – 0.36, with an average value of 0.26 for the whole galaxy, counting only stars with 25 mag. For comparison, the fraction AGB/RGB is 0.14 for VII Zw 403 (this is an upper limit because VII Zw 403 is at a larger distance and the RGB star count is less complete) and 0.17 in UGC 4483. The second striking fact is that AGB stars in NGC 2366 are brighter on the mean than those in VII Zw 403 and in other dwarf galaxies (see Fig. 14 of Izotov & Thuan (2002) where CMDs for five BCDs and irregular galaxies outside the Local Group and six Local Group irregular galaxies are compared). The AGB stars in NGC 2366 have a mean absolute magnitude –4.9 mag (Fig. 5), brighter by 0.3 mag than those in VII Zw 403. However, they are comparable in brightness to those in UGC 4483 (Izotov & Thuan, 2002).
The difference in the absolute brightnesses of AGB stars in NGC 2366 and VII Zw 403 can be due to a younger age in NGC 2366. To derive ages, theoretical isochrones are needed. The ones that are available in the literature fail to reproduce the observed properties of AGB stars at low metallicities in several respects (e.g., Lynds et al., 1998). First, while AGB stars in the CMDs of NGC 2366, of the BCDs VII Zw 403 and UGCA 290 and of some Local Group irregular galaxies have roughly a constant absolute magnitude (see Fig. 14 of Izotov & Thuan, 2002), the models predict a steady increase of absolute magnitude with increasing color, up to the tip of the AGB (TAGB) phase when the brightness of AGB stars is maximum. The Padua theoretical isochrones (Girardi et al., 2000) with 0.001 cannot reproduce the red colors of the AGB stars seen in these galaxies. As for the Geneva isochrones (Lejeune & Schaerer, 2001), they do not include the AGB stage. While the Padua isochrones cannot be used to derive absolute ages, they are probably good enough for obtaining relative ages. We thus compare the AGB populations of NGC 2366 and VII Zw 403, using the Padua models with = 0.001 of Bertelli et al. (1994), and assuming that AGB stars in both galaxies have the same metallicity. A difference of 0.3 mag in brightness translates into an age of 3 Gyr for the AGB stars in NGC 2366 assuming an age of 10 Gyr for those in VII Zw 403. Izotov & Thuan (2002) have derived an age of 2 Gyr for the AGB stars in the BCD UGC 4483.
The relative contribution of the bolometric luminosities of AGB and RGB stars gives information on the star formation history in NGC 2366 (Renzini & Buzzoni, 1986; Renzini & Fusi Pecci, 1988; Maraston, 1998). The method is based on the so-called fuel-consumption theorem (Renzini & Buzzoni, 1986) which uses as the main ingredient of population synthesis the amount of nuclear fuel burned in each evolutionary stage. Then the bolometric luminosity can be calculated at each evolutionary stage. The models so calculated predict that, in the case of instantaneous star formation, the total bolometric luminosity of AGB stars is greater than that of RGB stars if the age of the stellar population is 1 – 2 Gyr (Maraston, 1998). At ages of 10 Gyr the relative contribution of AGB stars decreases and becomes 4 times lower than that of RGB stars. If instead star formation has occurred from now to the past, then the contribution of AGB stars is always greater than that of RGB stars (Renzini & Buzzoni, 1986).
Converting the observed magnitudes of all observed AGB and RGB stars to bolometric magnitudes and adding their luminosities, we obtain the ratio of the total bolometric luminosity of AGB stars to RGB stars to be 1.4. Such a ratio corresponds to an age of 1 Gyr in the case of instantaneous star formation, but this age is higher if star formation occurs on longer timescales. It is likely that 1 – 3 Gyr ago, star formation activity in this galaxy was higher than now. However, we cannot exclude the possibility that 10 Gyr old stars are present in NGC 2366. Because of the age-metallicity degeneracy of the RGB and too large a distance which prevents the detection of indicators of old stellar populations, such as RR Lyrae, red giant clump and horizontal branch stars, we cannot put a definite upper limit to the age of NGC 2366 with our present WFPC2 observations. Deeper HST/ACS observations are needed. All we can say is that the detected stellar populations are consistent with an age not exceeding 3 Gyr. However, this upper limit is not very firm because of the uncertain metallicity of AGB and RGB stars. Finally, we note that the CMD of NGC 2366 which shows an important RGB stellar population is quite different from the CMD of I Zw 18, the most metal-deficient BCD known, with a metallicity of only 1/50 that of the Sun. The CMD of I Zw 18 is conspicuous in its lack of RGB stars, making the BCD a bona fide young galaxy with an age 500 Myr (Izotov & Thuan, 2004).
5 Summary
We have obtained Hubble Space Telescope WFPC2 and images of the nearby cometary dwarf irregular galaxy NGC 2366 and have studied its resolved stellar population. The analysis of the color-magnitude diagram (CMD) of this galaxy has led us to the following conclusions:
1. The CMD of NGC 2366 is populated by stars with different ages including young main-sequence stars with ages 30 Myr, evolved core helium burning massive stars (blue-loop stars and red supergiants) with ages between 20 Myr and 100 Myr, and older asymptotic giant branch (AGB) and red giant branch (RGB) stars with ages 100 Myr and 1 Gyr respectively. The most notable feature of the CMD is the presence of numerous AGB stars. Counting only stars brighter than = 25 mag, we find that, while the star count ratios MS/RGB and (BL+RSG)/RGB which characterize the younger stellar populations, vary in a wide range from region to region, the ratio AGB/RGB varies over a relatively narrow range of 0.18 – 0.36, with an average value of 0.26 for the whole galaxy. For comparison, the ratio AGB/RGB is 0.14 for the BCD VII Zw 403 and 0.17 for the BCD UGC 4483. This suggests that, in addition to the present burst of age 100 Myr, strong star formation activity has occurred during the last 3 Gyr in NGC 2366.
2. The older the stellar population is, the smoother and more extended is its spatial distribution. This is likely due to diffusion and relaxation processes of stellar ensembles. An underlying population of older stars is found throughout the body of NGC 2366.
3. From the observed magnitude of the tip of the RGB equal to 23.65 0.10, we derive a distance modulus = 27.67 0.10 corresponding to a distance 3.42 0.15 Mpc, in agreement with previous distance determinations and suggesting that NGC 2366 is a member of M81 group of galaxies.
4. AGB stars in NGC 2366 are appreciably brighter than those observed in some other dwarf galaxies with similar metallicities. For example, they are 0.3 mag brighter than those seen in the BCD VII Zw 403. The higher luminosities of the AGB stars in NGC 2366 are probably due their relatively young ages ( 3 Gyr) as compared to those in other dwarf galaxies.
References
- Aparicio et al. (1995) Aparicio, A., et al. 1995, AJ, 110, 212
- Bertelli et al. (1994) Bertelli, G., Bressan, A., Fagotto, F., & Nasi, E. 1994, A&AS, 106, 275
- Crone et al. (2000) Crone, M. M., Schulte-Ladbeck, R. E., Hopp, U., & Greggio, L. 2000, ApJ, 545, L31
- Da Costa & Armandroff (1990) Da Costa, G. S., & Armandroff, T. E. 1990, AJ, 100, 162
- Dolphin (2002) Dolphin, A. E. 2002, in HST Calibration Workshop, Space Telescope Science Institute, eds. S. Arribas, A. Koekemoer, and B. Whitmore, 301
- Drissen et al. (1997) Drissen, L., Roy, J.-R., & Robert, C. 1997, ApJ, 474, L35
- Drissen et al. (2000) Drissen, L., Roy, J.-R., Robert, C., Devost, D., & Doyon, R. 2000, AJ, 119, 688
- Drissen et al. (2001) Drissen, L., Crowther, P. A., Smith, L. J., Robert, C., Roy, J.-R., & Hillier, D. J. 2001, ApJ, 546, 484
- Girardi et al. (1996) Girardi, L., Bressan, A., Chiosi, C., Bertelli, G., & Nasi, E. 1996, A&AS, 117, 113
- Girardi et al. (2000) Girardi, L., Bressan, A., Bertelli, G., & Chiosi, C. 2000, A&AS, 141, 371
- González-Delgado et al. (1994) González-Delgado, R. M., et al. 1994, ApJ, 437, 239
- Harris (1996) Harris, W. E. 1996, AJ, 112, 1487
- Holtzman et al. (1995a) Holtzman, J., et al. 1995a, PASP, 107, 156
- Holtzman et al. (1995b) Holtzman, J., et al. 1995b, PASP, 107, 1065
- Huchtmeier et al. (1981) Huchtmeier, W. K., Seiradakis, J. H., & Materne, J. H. 1981, A&A, 102, 134
- Hunter & Hoffman (1999) Hunter, D. A., & Hoffman, L. 1999, AJ, 117, 2789
- Hunter et al. (2001) Hunter, D. A., Elmegreen, B. G., & van Woerden, H. 2001, ApJ, 556, 773
- Izotov & Thuan (2002) Izotov, Y. I., & Thuan, T. X. 2002, ApJ, 567, 875
- Izotov & Thuan (2004) Izotov, Y. I., & Thuan, T. X. 2004, ApJ, 616, 768
- Izotov et al. (1997) Izotov, Y. I., Thuan, T. X., & Lipovetsky, V. A. 1997, ApJS, 108, 1
- Karachentseva et al. (1985) Karachentseva, V. E., Karachentsev, I. D., & Börngen, F. 1985, A&AS, 60, 213
- Landolt (1992) Landolt, A. U. 1992, AJ, 104, 336
- Lee et al. (1993) Lee, M. G., Freedman, W. L., & Madore, B. F. 1993, ApJ, 417, 553
- Lejeune & Schaerer (2001) Lejeune, T., & Schaerer, D. 2001, A&A, 366, 538
- Loose & Thuan (1986) Loose, H.-H., & Thuan, T. X. 1986, in Star Forming Dwarf Galaxies and Related Objects, ed. D. Kunth, T. X. Thuan & J. T. T. Van (Gif-sur-Yvette: Editions Frontières), 73
- Luridiana et al. (1999) Luridiana, V., Peimbert, M., & Leitherer, C. 1999, ApJ, 527, 110
- Lynds et al. (1998) Lynds, R., Tolstoy, E., O’Neil, E. J., Jr., & Hunter, D. A. 1998, AJ, 116, 146
- Maraston (1998) Maraston, C. 1998, MNRAS, 300, 872
- Masegosa et al. (1991) Masegosa, J., Moles, M., & del Olmo, A. 1991, A&A, 249, 505
- Noeske et al. (2000) Noeske, K. G., Guseva, N. G., Fricke, K. J., Izotov, Y. I., Papaderos, P., & Thuan, T. X. 2000, A&A, 361, 33
- Peimbert et al. (1986) Peimbert, M., Peña, M., & Torres-Peimbert, S. 1986, A&A, 158, 266
- Renzini & Buzzoni (1986) Renzini, A., & Buzzoni, A. 1986, in The Stellar Populations of Galaxies, ed. C. Chiosi & A. Renzini (Kluwer, Dordrecht), 325
- Renzini & Fusi Pecci (1988) Renzini, A., & Fusi Pecci, F. 1988, ARA&A, 26, 199
- Roy et al. (1991) Roy, J.-R., Boulesteix, J., Joncas, G., & Grundseth, B. 1991, ApJ, 367, 141
- Roy et al. (1992) Roy, J.-R., Aubé, M., McCall, M. L., & Dufour, R. J. 1992, ApJ, 386, 498
- Roy et al. (1996) Roy, J.-R., Belley, J., Dutil, Y., & Martin, P. 1996, ApJ, 460, 284
- Schlegel et al. (1998) Schlegel, D. J., Finkbeiner, D. P., & Davis, M. 1998, ApJ, 500, 525
- Schulte-Ladbeck et al. (1998) Schulte-Ladbeck, R. E., Crone, M. M., & Hopp, U. 1998, ApJ, 493, L23
- Thuan & Martin (1981) Thuan, T. X., & Martin, G. E. 1981, ApJ, 247, 823
- Thuan et al. (2004) Thuan, T. X., Hibbard, J. E., & Lévrier, F. 2004, AJ, 128, 617
- Tikhonov et al. (1991) Tikhonov, N. A., Bilkina, B. I., Karachentsev, I. D., & Georgiev, Ts. B. 1991, A&AS, 89, 1
- Tolstoy et al. (1995) Tolstoy, E., Saha, A., Hoessel, J. G., & McQuade, K. 1995, AJ, 110, 1640
- Wevers et al. (1986) Wevers, B. M. H. R., van der Kruit, P. C., & Allen, R. J. 1986, A&AS, 66, 505
| Mag. | PC | WF2 | WF3 | WF4 | |||||||
|---|---|---|---|---|---|---|---|---|---|---|---|
| F555W | F814W | F555W | F814W | F555W | F814W | F555W | F814W | ||||
| 19–20 | 98.20.9 | 98.40.7 | 97.90.8 | 98.50.7 | 97.20.6 | 97.30.7 | 97.70.6 | 98.70.5 | |||
| 20–21 | 97.00.9 | 98.10.7 | 97.41.1 | 98.31.2 | 97.30.8 | 97.20.9 | 97.60.6 | 98.01.1 | |||
| 21–22 | 96.70.7 | 96.80.6 | 97.70.9 | 97.70.8 | 96.40.8 | 96.10.9 | 97.51.0 | 97.60.4 | |||
| 22–23 | 94.51.0 | 94.71.4 | 96.80.8 | 95.50.9 | 94.71.2 | 95.61.1 | 96.91.0 | 95.31.1 | |||
| 23–24 | 91.21.3 | 90.61.7 | 94.51.2 | 92.12.1 | 91.51.5 | 81.92.1 | 93.91.6 | 88.61.8 | |||
| 24–25 | 85.51.8 | 84.02.6 | 90.70.7 | 80.22.3 | 79.81.2 | 58.92.0 | 86.71.1 | 75.21.9 | |||
| 25–26 | 73.42.5 | 65.92.3 | 77.61.5 | 57.54.6 | 50.32.1 | 29.92.9 | 69.91.8 | 48.43.3 | |||
| 26–27 | 59.33.0 | 34.33.4 | 53.12.2 | 14.32.9 | 19.42.9 | 5.21.9 | 43.81.8 | 13.01.6 | |||
| 27–28 | 30.23.1 | 2.32.6 | 23.53.5 | 0.20.9 | 1.72.1 | 0.30.3 | 14.22.4 | 0.20.3 | |||
| 28–29 | 3.92.7 | 0.10.4 | 0.80.6 | 0.20.6 | 1.41.4 | ||||||